This report documents the current performance of the Network Based Application Recognition (NBAR) classification engine on Cisco 2600-XM, 3700, 7206, 7300, and 7500 Series Routers. It includes a description of the testbed, the testing methodology, and the benchmarks that were used for performance testing. Detailed results are provided for each benchmark. Cisco IOS Software® Release 12.3(10) was used for all performance measurements. The purpose of this document is to provide field engineers with performance guidelines for the NBAR feature on these platforms.
Overview
NBAR is an intelligent classification engine in Cisco IOS Software that can recognize a wide variety of applications, including Web-based and client/server applications. Once the applications are recognized, the network can invoke required services for that particular application.
NBAR performs the following two functions:
1. Identification of applications and protocols (Layer 4 to Layer 7)
2. Protocol discovery
Identification of Applications and Protocols (Layer 4 to Layer 7)
NBAR can classify applications that use:
• Statically assigned Transfer Control Protocol (TCP) and User Datagram Protocol (UDP) port numbers
• Non-UDP and non-TCP IP protocols
• Dynamically assigned TCP and UCP port numbers negotiated during connection establishment; Stateful inspection is required for classification of applications and protocols. This is the ability to discover data connections that will be classified, by passing the control connections over the data connection port where assignments are made.
• Sub-port classification; Classification of HTTP (URLs, mime or host names) and Citrix applications Independent Computing Architecture (ICA) traffic based on published application name)
• Classification based on deep packet inspection and multiple application-specific attributes. Real-Time Transport Protocol (RTP) Payload Classification is based on this algorithm, in which the packet is classified as RTP, based on multiple attributes in the RTP header.
Protocol Discovery
Protocol Discovery (PD) is a commonly used NBAR feature that collects application and protocol statistics (packet counts, byte counts and bit rates) per interface. GUI based management tools can graphically display this information, by polling Simple Network Management Protocol (SNMP) statistics from the NBAR PD Management Information Base (MIB).
As with any networking feature, it is important to understand the performance and scalability characteristics before deploying the feature into a production network. On software based platforms, the metrics that are considered are CPU utilization impact and the sustainable data rate while this feature is enabled.
What Does NBAR Performance Depend On?
Several factors can impact NBAR performance in software-based execution.
A. Router Configuration
1. Number of protocols being matched against it
2. Number of regular expressions being used
3. The complexity of packet inspection logic required
B. Traffic Profile (Packet Protocol Sequence)
1. The number of flows
2. Long duration flows are less expensive than shorter duration flows
3. Stateful protocol matches are more performance impacting than static port applications
A traffic mix consisting of a high volume of short-lived flows requires a higher level of resources to classify new flows which soon "expire" from the flow cache. Conversely, a lower level of resources is required with a traffic mix of fewer and longer-lived flows, since these flow entries would be in the cache for a longer amount of time.
Things That do not Impact NBAR
1. Post match actions (such as queuing, tagging, etc.)
2. Link speed (NBAR is interface agnostic)
3. Having NBAR on multiple interfaces (packets already classified are cached, no reclassification will take place)
4. Inbound vs. outbound packet matches (using NBAR on service policy input instead of service policy output)
Since NBAR is a feature used in a variety of network environments, it will be enabled on a variety of Cisco platforms. This white paper provides performance data for the following Cisco IOS Software routing platforms:
• Cisco 2600-XM Series Router
• Cisco 3745 Series Router
• Cisco 7206- NPE G1 Series Router
• Cisco 7301 Series Router
• Cisco 7505- RSP4 / VIP680 Series Router
Test Methodology
A common test setup was created for measuring NBAR performance on the selected platforms using the same test equipment and traffic load. The IXIA traffic generator was used to replicate real network traffic flows. These traffic flows were created by capturing actual client and server session traffic for a particular protocol. Once captured, the flows were replayed back on the test network via the IXIA devices. The Device Under Test (DUT) was subjected to the test traffic under four different scenarios-first a baseline test without NBAR enabled, then three performance tests with the NBAR features enabled in the following order-protocol discovery, match protocol, and both protocol discovery and match protocol. All the tests were run under varying traffic loads expressed as a percentage of the maximum load. This maximum load is also called the No Drop Rate (NDR) load. Once the load exceeds NDR, the router would begin to drop packets. For the performance and baseline tests, the offered traffic load would be 20% NDR, 40% NDR, 60% NDR and 100% NDR. This comparison provides a basis for anticipating the effect enabling NBAR will have on an existing system.
For all tests, the following measurements were recorded:
• Throughput in Mbps
• Average CPU utilization after 5 minutes
All tests were run for 10 minutes.
Traffic Profile
The traffic types used in this test plan include a mixture of typical Enterprise traffic (EMIX) including HTTP GET requests and RTP. This section provides a description of the traffic profile and the associated NBAR protocol match conditions. The EMIX traffic profile was built from individual session captures of each protocol, and these sessions were repeated to reach the desired percentage of each protocols contribution to the EMIX traffic profile. The following table represents the mix of traffic included in this test effort including the number the packets in each flow.
Table 1. Test Traffic
Application/Protocol
Packets per Flow
Percentage of Total Traffic (by packet count)
Average Packet Size (in bytes)
RTP
217
9%
81
Telnet
158
7%
114
HTTP - URL
473
20%
452
FTP
216
9%
72
SMTP
96
4%
101
Citrix ICA
360
15%
254
SAP
216
9%
358
WinMX
118
5%
267
eDonkey
220
9%
253
Unclassifiable Traffic
300
13%
256
Total
2374
100%
256
The match criteria specified via the CLI is shown below:
match protocol ftp
match protocol telnet
match protocol smtp
match protocol rtp video
match protocol citrix ica-tag 2
match protocol sap-app
match protocol winmx
match protocol edonkey
match protocol http url "*"
Note: In addition to the Packet Description Language Modules (PDLMs) native to Release 12.3(10), the SAP, Citrix, WinMX and eDonkey PDLMs were also loaded on the devices under test to facilitate NBAR matches for the respective application traffic.
Summary of Test Results
The test results are presented per platform. For each performance test, a graph is used to compare the baseline no NDR (with no NBAR enabled) CPU utilization to the feature NDR (with NBAR enabled) CPU utilization.
Table 2. Summary of Performance Tests
Hardware
Interface
NDR
Baseline
Protocol Discovery
Match Protocol
Match Protocol & Protocol Discovery
CPU %
Throughput
CPU %
Throughput
CPU %
Throughput
CPU %
Throughput
Cisco 2611 XM Series Router
FE
60%
53
15.68
71
15.44
40%
36
10.24
48
10.24
71
10.28
74
10.32
20%
20
5.12
28
5.192
37
5.184
38
5.128
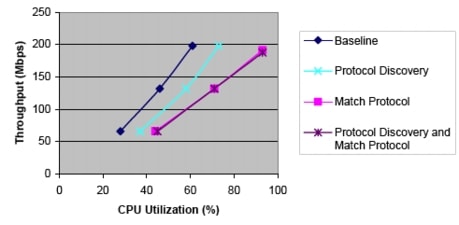
Cisco 3745 Series Router
GE
60%
61
197.746
73
197.746
93
190.96
93
187.52
40%
46
131.819
58
131.819
71
131.819
71
131.819
20%
28
65.901
37
65.901
44
65.901
45
65.901
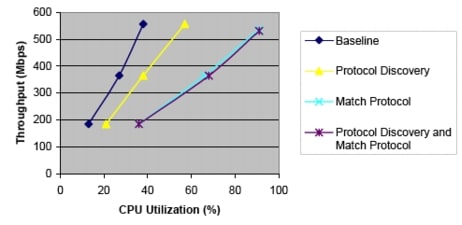
Cisco 7206 NPE G1 Series Router
GE
60%
38
555.766
57
555.766
91
535.896
91
529.928
40%
27
364.866
38
364.866
66
364.396
68
364.385
20%
13
185.225
21
185.225
36
185.225
36
185.225
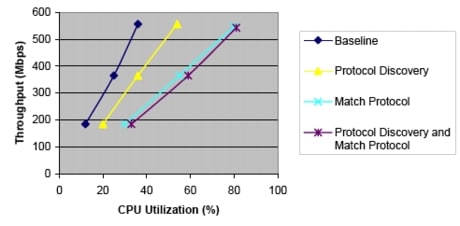
Cisco 7301 Series Router
GE
60%
36
555.766
54
555.766
80
546.64
81
542
40%
25
364.866
36
364.866
55
364.866
59
364.866
20%
12
185.225
20
185.225
30
185.225
33
185.225
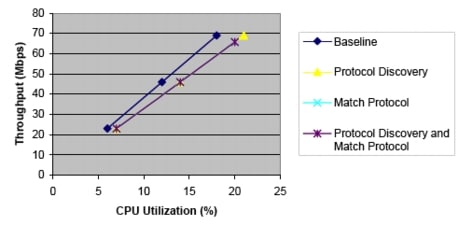
Cisco 7505 RSP4/VIP-680 Series Router
PA-A3
60%
18
68.968
21
68.968
20
65.705
20
65.701
40%
12
45.978
14
45.978
14
45.978
14
45.978
20%
6
22.99
7
22.99
7
22.99
7
22.99
Figure 1. Cisco 7505 RSP4/VIP680 Series Router
Difference between Baseline and:
Protocol Discovery
Match Protocol
Protocol Discovery & Match Protocol
CPU Δ
Throughput Δ (%)
CPU Δ
Throughput Δ (%)
CPU Δ
Throughput Δ (%)
60% NDR
3
0
2
4.7
2
4.7
40% NDR
2
0
2
0
2
0
20% NDR
1
0
1
0
1
0
Figure 2. Cisco 7206 NPE G1 Series Router
Difference between Baseline and:
Protocol Discovery
Match Protocol
Protocol Discovery & Match Protocol
CPU Δ
Throughput Δ (%)
CPU Δ
Throughput Δ (%)
CPU Δ
Throughput Δ (%)
60% NDR
19
0
53
3.57
53
4.64
40% NDR
11
0
39
0.12
41
0.13
20% NDR
8
0
23
0
23
0
Figure 3. Cisco 7301 Series Router
Difference between Baseline and:
Protocol Discovery
Match Protocol
Protocol Discovery & Match Protocol
CPU Ä
Throughput Ä (%)
CPU Ä
Throughput Ä (%)
CPU Ä
Throughput Ä (%)
60% NDR
19
0
53
3.57
53
4.6
40% NDR
11
0
39
0.12
41
0.13
20% NDR
8
0
23
0
23
0
Figure 4. Cisco 3745 Series Router
Difference between Baseline and:
Protocol Discovery
Match Protocol
Protocol Discovery & Match Protocol
CPU Ä
Throughput Ä (%)
CPU Ä
Throughput Ä (%)
CPU Ä
Throughput Ä (%)
60% NDR
12
0
32
3.4
32
5.1
40% NDR
12
0
25
0
25
0
20% NDR
9
0
16
0
17
0
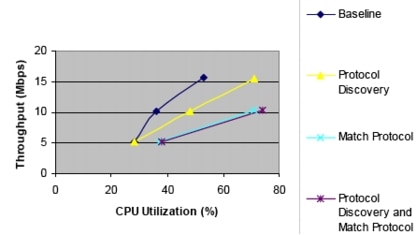
Figure 5. Cisco 2611-XM Series Router
Difference between Baseline and:
Protocol Discovery
Match Protocol
Protocol Discovery & Match Protocol
CPU Δ
Throughput Δ (%)
CPU Δ
Throughput Δ (%)
CPU Δ
Throughput Δ (%)
40% NDR
12
0
35
0
38
0
20% NDR
8
0
17
0
18
0
Frequently Asked Questions
Q. Why have Cisco chosen 60% NDR and not, for example, 80% NDR or more?
A. This paper targets routers that are running at less than 60% CPU utilization. If the router is above that utilization, it's not realistic to increase the load. Higher stress was measured; however those results will be used for performance improvement comparisons, not for publication.
Q. Could you explain a little more the concept of EMIX? Is it a typical traffic mix that you have selected for this test, or is it a new emerging standard for performance testing in within Cisco, or even within the networking community?
A. As noted in this paper, traffic mix is a major determinant of performance. However, there is no industry standard on EMIX (Enterprise traffic mix or Internet traffic mix). There is no typical mix that would satisfy various customer situations. To do more, two or three mixes would be needed and then choosing the one that most reflects your situation. It wasn't meant to be either easy or hard for NBAR.
Q. Could you provide a short description of the Citrix ICA tag 2? This would help the understanding if this EMIX is applicable to our customers.
A. The "match protocol citrix ica-tag 2" command looks for Citrix ICA traffic with a low priority value corresponding to client port or client drive mapping. Lower than that is ICA priority tag 3, signifying background priority, which includes ICA print traffic.
Citrix ICA stands for Citrix® Independent Computing Architecture. It is the "thin" protocol that enables Citrix to separate screen updates and user input processing from the rest of the logic of the application. When using a Citrix ICA client, all application logic executes on the server and only screen updates, mouse movements and keystrokes, are transmitted via the Citrix ICA session.
Q. Is performance dependent on the number of interfaces that NBAR is enabled on? Does the link speed of the interface(s) that NBAR is enabled on affect performance?
A. No. NBAR performance is not dependent on the number of interfaces that NBAR is enabled on or the link speed of those interfaces. Performance is dependent on the number of packets that the NBAR engine has to inspect, how deep into the packet it has to look to perform regular expression matching and the complexity (length) of the match string. Once classified, flow entries are cached until the connection is torn down or the flow entry expires from the cache. Cached entries have minimal performance cost, the longer the flow duration, greater the cache hits and better the performance. Conversely, if the traffic profile is comprised of a large number of short duration flows, the performance cost is greater.
Q. Are the new Integrated Services Routers (ISRs) going to be tested (Cisco 1800, 2800, and 3800 Series Routers)?
A. No, not at this time. This testing preceded introduction of those routers. They are indicative of what would occur generally. The focus of the tests was to characterize the performance profile of NBAR, not how NBAR performs on different platforms.
Q. Can you explain how throughput increases in many of the cases when NBAR is invoked?
A. Throughput does not go up. Review the graphs and follow the throughput rate horizontally across, from the baseline NDR throughput and CPU percentage to the corresponding line where NBAR is enabled. The cost is the incremental CPU percentage, featured below each graph.
Q. In the cases where throughput decreases, does that mean packets are being dropped?
A. No, the router is not dropping packets. Packet loss doesn't occur until the CPU percentage is very high, for example 96% and above.
[an error occurred while processing this directive]