Downloads |
 Feedback Feedback
|
Table Of Contents
Configuration Checklist for Packet Capturing
Adding an End User to the Standard Packet Sniffer Users Group
Configuring Packet-Capturing Service Parameters
Configuring Packet Capturing in the Phone Configuration Window
Configuring Packet Capturing in Gateway and Trunk Configuration Windows
Packet Capturing Configuration Settings
Cisco CallManager Troubleshooting Tools
Troubleshooting Perfmon Data Logging
Configuring Troubleshooting Perfmon Data Logging
Viewing the Perfmon Log Files with the Microsoft Performance Tool
Cisco Discovery Protocol Support
Simple Network Management Protocol Support
Troubleshooting the Server Without Root Access
Serviceability GUI and CLI Commands for Commonly-used Linux Commands
How to Collect Logs and Trace Files
How to Schedule Collection of Logs and Trace Files
How to Free Up Space on the Hard Disk
How to Reboot the Cisco CallManager Server
How to Change Debug Levels for Traces
Verify Cisco CallManager Services Are Running
Where to Find More Information
Troubleshooting Tools
This section addresses the tools and utilities that you use to configure, monitor, and troubleshoot Cisco CallManager 5.0(1) and provides general guidelines for collecting information to avoid repetitive testing and recollection of identical data.
Note
To access some of the URL sites listed this document, you must be a registered user and you must be logged in.
This section contains the following topics:
•
•
•
•
Sniffer Traces
Typically, you collect sniffer traces by connecting a laptop or other sniffer-equipped device on a Catalyst port that is configured to span the VLAN or port(s) (CatOS, Cat6K-IOS, XL-IOS) that contains the trouble information. If no free port is available, connect the sniffer-equipped device on a hub that is inserted between the switch and the device.
Tip
Have available the IP/MAC addresses of all equipment that is involved, such as IP phones, gateways, Cisco CallManagers, and so on.
Collecting Traces
The video described below will show you how to gather basic Call Connection Manager (CCM) and Signal Distribution Layer (SDL) traces from your CallManager cluster. You can then use this information in your TAC Service Request.
After watching this video, you will be able to:
•
•
•
You can view this informative Flash video at:
www.cisco.com/warp/public/788/video_64826/callmanager-tool.html
(available to non-registered users)www.cisco.com/warp/customer/788/video_64826/callmanager-tool.html
(available to registered users)Debugs
The output from debug privileged EXEC commands provides diagnostic information about a variety of internetworking events relating to protocol status and network activity in general.
Set up your terminal emulator software (such as HyperTerminal), so it can capture the debug output to a file. In HyperTerminal, click Transfer; then, click Capture Text and choose the appropriate options.
Before running any IOS voice gateway debugs, make sure that
service timestamps debug datetime msecis globally configured on the gateway.
Note
Preferably, collect debugs during non-working hours. If debugs must be collected in a live environment, configure
no logging consoleandlogging buffered. To collect the debugs, use show log.Some debugs can be lengthy, so collect them directly on the console port (default logging console) or on the buffer (logging buffer). Collecting debugs over a Telnet session may have an impact on the device performance, and the result could be incomplete debugs, which requires that you re-collect them.
To stop a debug, use the no debug all or undebug all commands. Verify that the debugs have been turned off by using the command show debug.
Packet Capture
This section contains information on the following topics:
•
•
•
•
•
•
Packet Capturing Overview
Because third-party troubleshooting tools that sniff media and TCP packets do not work after you enable encryption, you must use Cisco CallManager Administration to perform the following tasks if a problem occurs:
•
•
•
Tip
For more information, see the Cisco CallManager Security Guide.
Configuration Checklist for Packet Capturing
Extracting and analyzing pertinent data includes performing the following tasks in Table 2-1:
Table 2-1 Configuration Checklist for Packet Capturing
Step 1
Add end users to the Standard Packet Sniffer Users group.
Adding an End User to the Standard Packet Sniffer Users Group
Step 2
Configure packet capturing service parameters in the Service Parameter Configuration window in Cisco CallManager Administration; for example, configure the Packet Capture Enable service parameter.
Step 3
Configure packet capturing settings on a per-device basis in the Phone or Gateway or Trunk Configuration window.
Note
•
•
Step 4
Capture SRTP packets by using a sniffer trace between the affected devices.
Refer to the documentation that supports your sniffer trace tool.
Step 5
After you capture the packets, set the Packet Capture Enable service parameter to False.
•
Step 6
Gather the files that you need to analyze the packets.
Step 7
Cisco Technical Assistance Center (TAC) analyzes the packets. Contact TAC directly to perform this task.
Adding an End User to the Standard Packet Sniffer Users Group
End users that belong to the Standard Packet Sniffer Users group can configure the Packet Capture Mode and Packet Capture Duration settings for devices that support packet capturing. If the user does not exist in the Standard Packet Sniffer Users group, the user cannot initiate packet capturing.
The following procedure, which describes how to add an end user to the Standard Packet Sniffer Users group, assumes that you configured the end user in Cisco CallManager Administration, as described in the Cisco CallManager Administration Guide.
Procedure
Step 1
Step 2
Step 3
Step 4
Step 5
Configuring Packet-Capturing Service Parameters
To configure parameters for packet capturing, perform the following procedure:
Procedure
Step 1
Step 2
Step 3
Step 4
Tip
Note
Step 5
Step 6
•
•
Configuring Packet Capturing in the Phone Configuration Window
After you enable packet capturing in the Service Parameter window, you can configure packet capturing on a per-device basis in the Phone Configuration window of Cisco CallManager Administration.
You enable or disable packet capturing on a per-phone basis. The default setting for packet capturing equals None.
Tip
If you do not want to capture packets or if you completed the task, set the Packet Capture Enable service parameter to False.To configure packet capturing for phones, perform the following procedure:
Procedure
Step 1
Step 2
Step 3
Step 4
Step 5
Tip
Additional Steps
Capture SRTP packets by using a sniffer trace between the affected devices.
After you capture the packets, set the Packet Capture Enable service parameter to False.
See the "Analyzing Captured Packets" section.
Configuring Packet Capturing in Gateway and Trunk Configuration Windows
The following gateways and trunks support packet capturing in Cisco CallManager Administration:
•
•
•
•
Tip
If you do not want to capture packets or if you completed the task, set the Packet Capture Enable service parameter to False.To configure packet capturing settings in the Gateway or Trunk Configuration window, perform the following procedure:
Procedure
Step 1
Step 2
•
•
•
•
Step 3
Tip
Step 4
Step 5
Step 6
Tip
Additional Steps
Capture SRTP packets by using a sniffer trace between the affected devices.
After you capture the packets, set the Packet Capture Enable service parameter to False.
See the "Analyzing Captured Packets" section.
Packet Capturing Configuration Settings
Use Table 2-2, which describes the Packet Capture Mode and Packet Capture Duration settings, with the following sections:
•
•
Analyzing Captured Packets
Cisco Technical Assistance Center (TAC) analyzes the packets by using a debugging tool. Before you contact TAC, capture SRTP packets by using a sniffer trace between the affected devices. Contact TAC directly after you gather the following information:
•
•
•
For more information, see the Cisco CallManager Security Guide.
Cisco CallManager Troubleshooting Tools
Refer to the Cisco CallManager Serviceability Administration Guide and the Cisco CallManager Serviceability System Guide for detailed information of the following different types of tools that Cisco CallManager Serviceability provides to monitor and analyze the various Cisco CallManager systems.
Cisco Secure Telnet
Cisco Secure Telnet allows Cisco Service Engineers (CSE) transparent firewall access to the Cisco CallManager node on your site. Using strong encryption, Cisco Secure Telnet enables a special Telnet client from Cisco Systems to connect to a Telnet daemon behind your firewall. This secure connection allows remote monitoring and troubleshooting of your Cisco CallManager nodes, without requiring firewall modifications.
Note
Command Line Interface
The command line interface (CLI) is used to access the Cisco CallManager system for basic maintenance and failure recovery. Access to the system can be obtained by either a hard-wired terminal (a system monitor and keyboard) or by performing a SSH session.
The account name and password are created at install time. The password can be changed after install, but the account name can never be changed.
A command is a text instruction that caused the system to perform some function. Commands may be stand alone or they can have mandatory or optional arguments or options.
A level is a collection of commands; for example, show is a level, whereas show status is a command. Each level and command also has an associated privilege level. You will be allowed to execute a command only if you have a sufficient privilege level.
For complete information on the Cisco CallManager CLI command set, see Appendix A in the Cisco IP Telephony Platform Administration Guide, Release 5.0(1).
Troubleshooting Perfmon Data Logging
Caution
The troubleshooting perfmon data logging feature assists Cisco TAC in identifying system problems. When you enable troubleshooting perfmon data logging, you initiate the collection of a set of Cisco CallManager and operating system performance statistics on the selected node. The statistics that are collected include comprehensive information that can be used for system diagnosis and information from a set of counters that is not a part of the current set of preconfigured counters.
Because an extensive amount of information is collected in a short time, Cisco recommends that you do not enable the enable troubleshooting perfmon data logging for any extended time and that you enable the Log Partitioning Monitor to monitor disk usage while troubleshooting perfmon data logging is enabled.
When you enable the troubleshooting perfmon data feature on a system with no active phone calls and you use the default setting for the troubleshooting perfmon data logging parameters, Cisco estimates that the system experiences a less than 5 percent increase in CPU utilization, and an insignificant increase in the amount of memory being used, and it write approximately 50 MB of information to the log files daily.
You can perform the following administrative tasks with the troubleshooting perfmon data logging feature:
•
•
•
•
•
•
•
•
The troubleshooting perfmon data logging feature collects information from the following counters within the following perfmon objects. Refer to the "Performance Objects and Counters" chapter in Cisco CallManager Serviceability System Guide for a description on the counters:
•
–
–
–
–
–
–
–
•
–
–
–
–
–
–
–
–
–
•
–
–
–
–
–
–
–
–
–
–
–
–
–
–
–
–
–
–
–
–
–
–
–
–
–
–
–
–
–
–
–
–
–
–
–
–
–
–
–
–
•
–
–
–
–
–
–
–
•
–
–
–
–
–
–
–
–
–
–
–
–
–
–
–
•
–
–
–
–
–
–
–
–
•
–
–
•
–
–
–
–
–
–
–
–
–
•
–
–
–
–
–
–
–
–
–
–
–
–
–
–
•
–
–
–
–
–
–
–
–
–
•
–
–
–
–
–
–
–
–
–
–
–
–
•
–
–
–
–
–
–
–
The procedure below provides the steps for using the troubleshooting perfmon data logging feature.
Procedure
Step 1
See the"Configuring Troubleshooting Perfmon Data Logging" section
Step 2
See the Cisco CallManager Administration Guide.
Step 3
•
•
Step 4
See the "Viewing the Perfmon Log Files with the Microsoft Performance Tool" section
Step 5
Configuring Troubleshooting Perfmon Data Logging
The following procedure describes how to configure the troubleshooting perfmon data logging feature.
Procedure
Step 1
The Service Parameter Configuration window displays.
Step 2
Step 3
Step 4
Step 5
Viewing the Perfmon Log Files with the Microsoft Performance Tool
To view the log files by using the Microsoft Performance tool, follow these steps:
Procedure
Step 1
Step 2
Step 3
Step 4
Step 5
Step 6
Step 7
Step 8
Step 9
Step 10
Step 11
CiscoWorks2000
CiscoWorks2000 serves as the network management system of choice for all Cisco devices including Cisco CallManager. Because CiscoWorks2000 is not bundled with Cisco CallManager, you must purchase it separately. Use the following tools with CiscoWorks2000 for remote serviceability:
•
•
Refer to the Cisco CallManager Serviceability Administration Guide and the CiscoWorks2000 documentation for more information on CiscoWorks2000 at the following URL:
http://www.cisco.com/univercd/cc/td/doc/product/rtrmgmt/cw2000/index.htm
System Log Management
Although it can be adapted to other network management systems, Cisco Syslog Analysis, which is packaged with CiscoWorks2000 Resource Manager Essentials, provides the best method to manage Syslog messages from Cisco devices.
Cisco Syslog Analyzer serves as the component of Cisco Syslog Analysis that provides a common storage and analysis of the system log for multiple applications. The other major component, Syslog Analyzer Collector, gathers log messages from Cisco CallManager servers.
These two Cisco applications work together to provide a centralized system logging service for Cisco IP Telephony Solutions.
Refer to the Cisco CallManager Serviceability Administration Guide for more information.
Cisco Discovery Protocol Support
The Cisco Discovery Protocol Support enables discovery of Cisco CallManager servers and management of those servers by CiscoWorks2000.
Refer to the Cisco CallManager Serviceability Administration Guide and the CiscoWorks2000 documentation for more information on CiscoWorks2000 at the following URL:
http://www.cisco.com/univercd/cc/td/doc/product/rtrmgmt/cw2000/index.htm
Simple Network Management Protocol Support
Network management systems (NMS) use SNMP, an industry-standard interface, to exchange management information between network devices. A part of the TCP/IP protocol suite, SNMP enables administrators to remotely manage network performance, find and solve network problems, and plan for network growth.
An SNMP-managed network comprises three key components: managed devices, agents, and network management systems.
•
•
•
–
–
–
For detailed information, refer to the Cisco CallManager Serviceability Administration Guide and the Cisco CallManager Serviceability System Guide.
Troubleshooting the Server Without Root Access
This section is a quick reference for commands and utilities to help you troubleshoot a Cisco CallManager server with root access disabled. It includes the following topics:
•
–
–
–
–
–
Serviceability GUI and CLI Commands for Commonly-used Linux Commands
Real Time Monitoring Tool (RTMT) is a client application you can install on your PC by downloading the RTMT client from your server at this URL:
https://<server_ipaddress>:8443/ccmadmin/pluginsFindList.do
Procedure
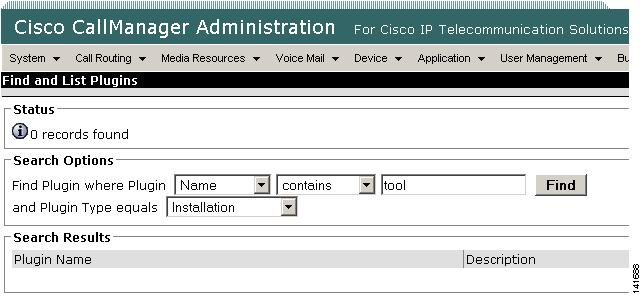
Step 1
Step 2
The Find and List Plugins screen screen is displayed as shown in Figure 2-1
Figure 2-1 Cisco CallManager Find and List Plugins Screen
Step 3
Step 4
Step 5
The Search Results box will display links to both the Windows and Linux versions of the Cisco CallManager Real-Time Monitoring Tool.
Step 6
Step 7
Table 2-5 provides a summary of the CLI commands and GUI selections detailed in following sections.
Common Troubleshooting Tasks
How to Collect Logs and Trace Files
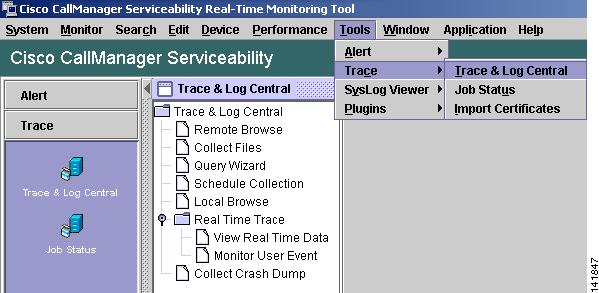
GUI
Using the RTMT client application, go to the Tools menu and select Trace > Trace & Log Central to see the different trace utilities.
Figure 2-2 Cisco CallManager RTMT Trace & Log Central
CLI
•
•
•
How to Schedule Collection of Logs and Trace Files
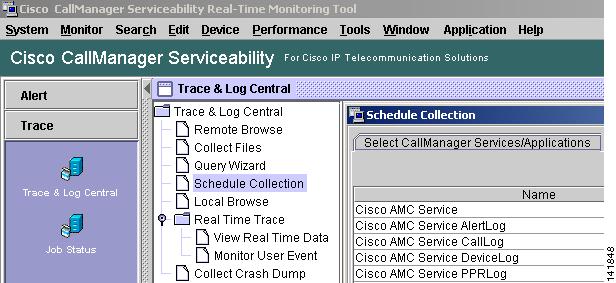
GUI
Using the RTMT client application go to the Tools menu and select Trace & Log Central > Schedule Collection.
Figure 2-3 Cisco CallManager RTMT Schedule Collection
How to Access the Database
CLI
Log in as admin and use any of the following show commands:
•
•
•
•
•
•
•
•
•
•
•
•
•
•
•
To run a SQL command use the run command:
•
How to Free Up Space on the Hard Disk
You can only delete files from the Log partition.
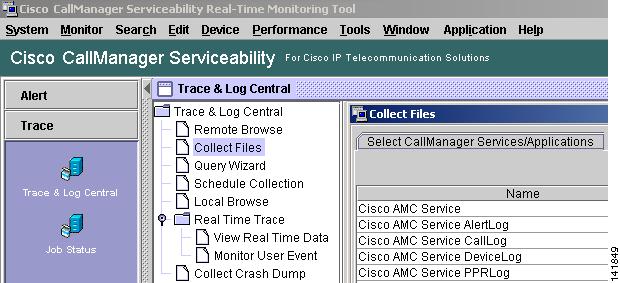
GUI
Using the RTMT client, go to the Tools menu and select Trace & Log Central > Collect Files.
Figure 2-4 Cisco CallManager RTMT Collect Files
Choose the criteria to select the files you want to collect, then check the option Delete Files. This will delete the files on the Cisco CallManager server after downloading the files to your PC.
CLI:
•
How to Look at Core Files
GUI
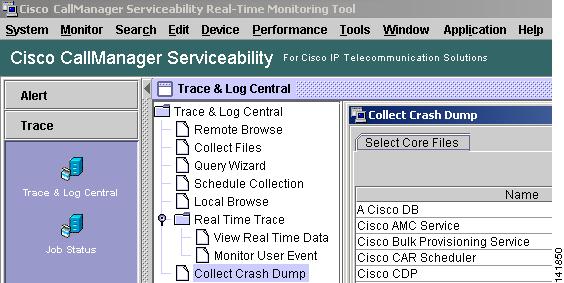
It is not possible to view the core files; however, you can download the Core files by using the RTMT application and selecting Tools > Trace & Log Central > Collect Crash Dump.
Figure 2-5 Cisco CallManager RTMT Collect Crash Dump
CLI
•
How to Reboot the Cisco CallManager Server
GUI
Login to the Platform Web page on the server and go to Restart > Current Version.
CLI
•
How to Change Debug Levels for Traces
GUI
Login to the Serviceability web page at https://<server_ipaddress>:8443/ccmservice/ and go to Trace > Configuration
CLI
•
How to Look at Netstats
GUI
none
CLI
•
Troubleshooting Tips
The following tips may help you when troubleshooting the Cisco CallManager.
Tip
Tip
Each Cisco CallManager log traces files locally. If a phone or gateway is registered to a particular Cisco CallManager, then the call processing gets done on that Cisco CallManager if the call is initiated there. You will need to capture traces on that Cisco CallManager to debug a problem.
A common mistake involves having devices registered on a subscriber server, but capturing traces on the publisher server. These trace files will be nearly empty (and definitely will not have the call in them).
Another common problem involves having Device 1 registered to CM1 and Device 2 registered to CM2. If Device 1 calls Device 2, the call trace occurs in CM1 and if Device 2 calls Device 1 the trace occurs in CM2. If you are troubleshooting a two-way calling issue, you need both traces from both Cisco CallManagers to obtain all the information needed to troubleshoot.
Tip
Multiple calls may have been made, so knowing the approximate time of the call helps TAC quickly locate the trouble.
You can obtain statistics on a Cisco IP Phone 79xx by pressing the i button twice during an active call.
When you are running a test to reproduce the issue and produce information, know the following data that is crucial to understanding the issue:
•
•
•
Note
If you are reproducing a problem, make sure to choose the file for the timeframe by looking at the modification date and the timestamps in the file. The best way to collect the right trace is to reproduce a problem and then quickly locate the most recent file and copy it from the Cisco CallManager server.
Tip
Files will get overwritten after some time. The only way to know which file is being logged to is to choose View >Refresh on the menu bar and look at the dates and times on the files.
Verify Cisco CallManager Services Are Running
Use the following procedure to verify which Cisco CallManager services are active on a server.
Procedure
Step 1
The Cisco CallManager Serviceability window displays.
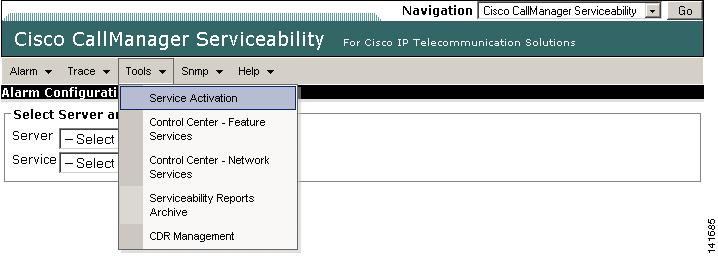
Step 2
Figure 2-6 Cisco CallManager Serviceability Window Tools Menu
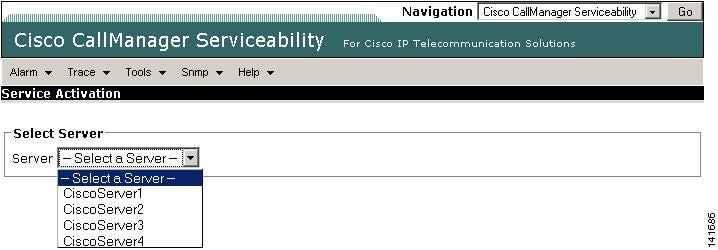
Step 3
Figure 2-7 Cisco CallManager Serviceability Window Service Activation
The server that you choose displays next to the Current Server title, and a series of boxes with configured services displays.
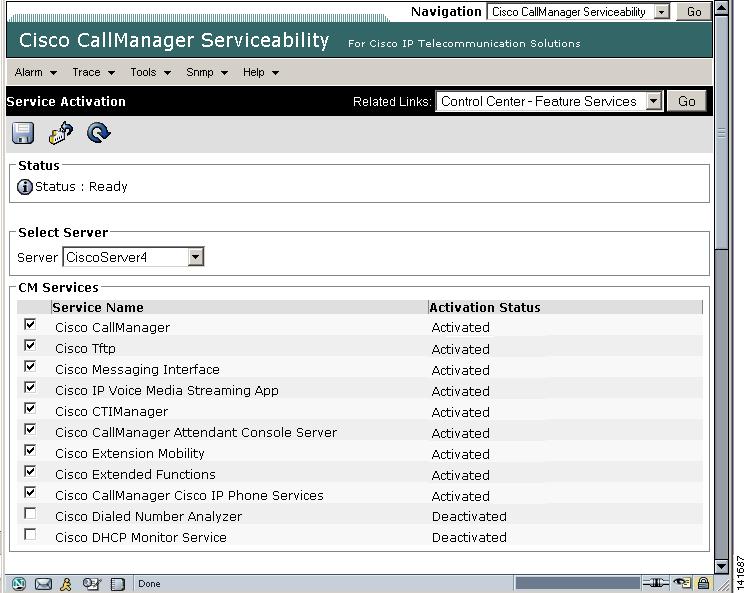
Activation Status column displays either Activated or Deactivated in the Cisco CallManager line as shown in Figure 2-8.
Figure 2-8 Service Activation Window
If the Activated status displays, the specified Cisco CallManager service is active on the chosen server.
If the Deactivated status displays, continue with the following steps.
Step 4
Step 5
The Activation Status column displays Activated in the specifed Cisco CallManager service line.
The sepcified Cisco CallManager service is now active for the chosen server.
Perform the following procedure if the Cisco CallManager has been in service and you want to verify if it is currently running.
Procedure
Step 1
The Cisco CallManager Serviceability window displays.
Step 2
Step 3
The server that you chose displays next to the Current Server title, and a box with configured services displays.
The Status column displays which services are running for the chosen server.
Where to Find More Information
Additional Cisco Documentation
•
•
•
•
•