-
Cisco CallManager Serviceability Administration Guide, Release 3.3(4)
-
Preface
-
Introduction
-
Alarm Configuration
-
Alarm Definitions
-
Alarm Information
-
Trace Configuration
-
Trace Collection Configuration
-
Trace Analysis Configuration
-
Q.931 Translator
-
Service Activation
-
Control Center
-
Real-Time Monitoring Configuration
-
Phone Problem Reports Viewer
-
CDR Analysis and Reporting
-
CAR System Configuration
-
CAR Report Configuration
-
CAR User Reports Configuration
-
CAR System Reports Configuration
-
CAR Device Reports Configuration
-
CDR Search Configuration
-
Microsoft Performance
-
Bulk Trace Analysis
-
Overview of CiscoWorks2000
-
Path Analysis Configuration
-
System Log Management Configuration
-
Cisco Discovery Protocol Support Configuration
-
Cisco Secure Telnet Configuration
-
Show Command Line Interface
-
Simple Network Management Protocol Configuration
-
Understanding CAR Reports
-
Index
-
 Feedback
Table Of Contents
CAR Device Reports Configuration
Gateway Detail Report Configuration
Gateway Summary Report Configuration
Gateway Utilization Reports Configuration
Route Group Utilization Reports Configuration
Route List Utilization Report Configuration
Route Pattern Utilization Report Configuration
Configuring Conference Bridge Utilization Reports
Configuring Voice-Mail Utilization Reports
CAR Device Reports Configuration
CAR provides reporting capabilities for three levels of users: Administrators, managers, and individual users. Only administrators generate device reports.
Device reports track the load and performance of Cisco CallManager-related devices, such as conference bridges, voice-mail server, and gateways.
This chapter contains the following topics:
•
Configuring Conference Bridge Utilization Reports
•
Configuring Gateway Reports
Configure the following device reports for gateways:
•
•
•
•
•
•
Gateway Detail Report Configuration
Only CAR administrators generate the gateway detail report. Use the gateway detail report to track issues with specific gateways.
This section describes how to generate, view, or mail detailed information about selected gateways.
Caution
Procedure
Step 1
The Gateway Detail window displays.
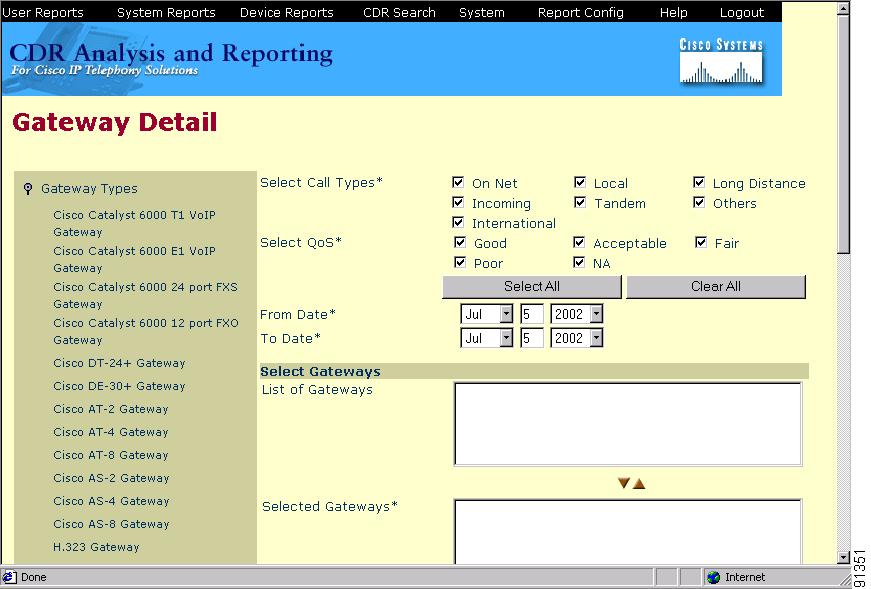
Step 2
The tree structure expands anda list of gateway types displays, as shown in Figure 18-1.
Figure 18-1 Tree Structure Expanded Displaying Gateway Types
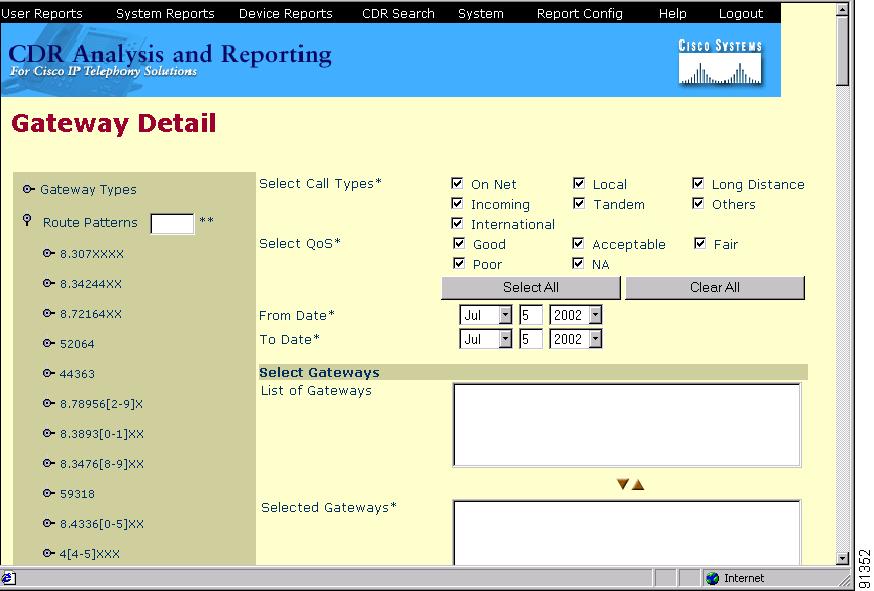
To specify only those gateways that use a particular route pattern, rather than a gateway type, click the icon next to Route Patterns in the column on the left side of the window.
The tree structure expands and displays a list of route patterns as shown in Figure 18-2.
Figure 18-2 Tree Structure Expanded Displaying Route Patterns
Note
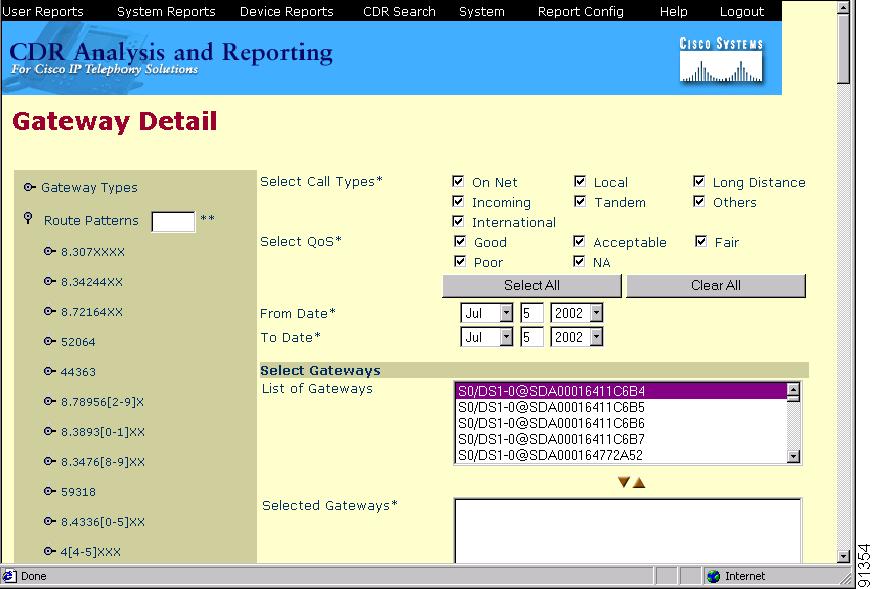
Step 3
The gateway name displays in the List of Gateways box as shown in Figure 18-3.
Figure 18-3 List of Gateways
Note
Step 4
Note
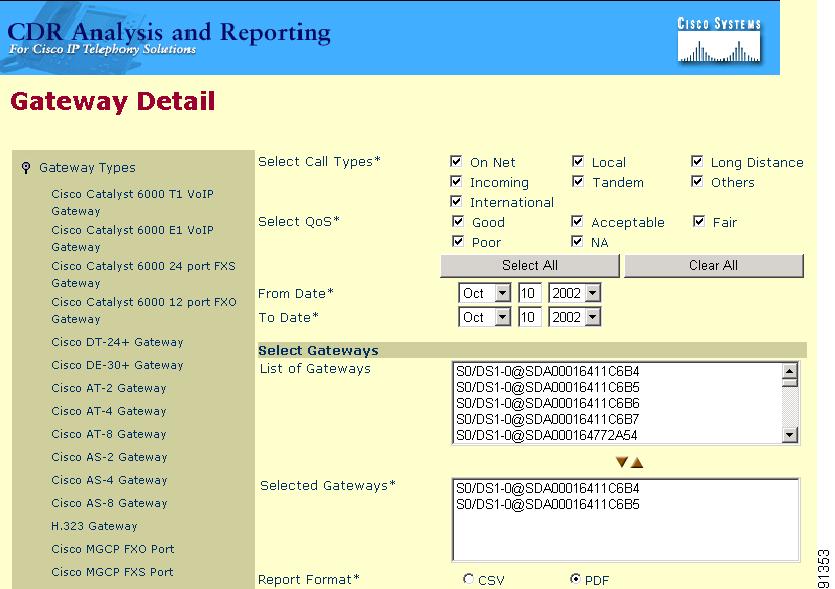
Step 5
The gateway(s) you chose displays in the Selected Gateways box as shown in Figure 18-4.
Figure 18-4 Selected Gateways
Step 6
Step 7
Step 8
Note
Step 9
You can view CSV files in CAR or save them to disk and view them by using a spreadsheet application such as Microsoft Excel; you can view PDF files in CAR by using Adobe Acrobat Reader.
Step 10
If you chose CSV, the report generates, and you are prompted to view the file or to save it to disk. If you chose PDF, the report displays.
Step 11
Related Topic
•
Gateway Summary Report Configuration
Only CAR administrators generate the gateway summary report. This report provides a summary of all the calls that went through the gateways. You can use this information for monitoring the traffic and QoS for calls through the gateways.
You can either view reports that the system automatically generates or generate new reports. Only CAR administrators can schedule reports for automatic generation. See CAR System Configuration, for more information.
Caution
This section describes how to generate, view, or mail summary information about gateways.
Procedure
Step 1
The Gateway Summary window displays.
Step 2
Step 3
Step 4
Step 5
You can view CSV files in CAR or save them to disk and view them by using a spreadsheet application such as Microsoft Excel; you can view PDF files in CAR by using Adobe Acrobat Reader.
Step 6
If you chose CSV, the report generates, and you are prompted to view the file or to save it to disk. If you chose PDF, the report displays.
Step 7
Related Topic
•
Gateway Utilization Reports Configuration
Only CAR administrators generate the gateway utilization report. The report provides an estimate of the utilization percentage of the gateway for the period and not the exact utilization. For example, the system calculates the utilization of a gateway between 11hrs-12hrs, as (number of calls in the 5-minute interval that used the gateway *100) / (maximum number of calls that could possibly use the gateway at any time). Maximum number of calls possible using the gateway at any time = maximum number of ports for the gateway as configured in the CAR Gateway Configuration page. After calculating the utilization for each 5-minute sample for the whole one-hour duration, the maximum utilization value found for that one hour display in the report as the utilization for the time between 11hrs-12hrs. Similarly, to get a utilization for the whole day, the whole day gets divided into samples of 5 minutes each, and maximum utilization is calculated. You can examine the usage based on each hour of a day or on a specified number of days for each week or month. Reports generate for each of the gateways that are selected.
You can either view reports that the system automatically generates or generate new reports. Only CAR administrators can schedule reports for automatic generation. See CAR System Configuration, for more information.
Caution
This section describes how to generate, view, or mail gateway utilization reports.
Procedure
Step 1
The Gateway Utilization window displays.
Step 2
Table 18-4 Generate Report Fields
Hour of Day
Displays the cumulative results for each hour in a 24-hour period for the period that you specify in Step 8.
Day of Week
Displays the days of the week that occur within the period that you specify in Step 8.
Day of Month
Displays the days of the month that occur within the period that you specify in Step 8.
Step 3
Step 4
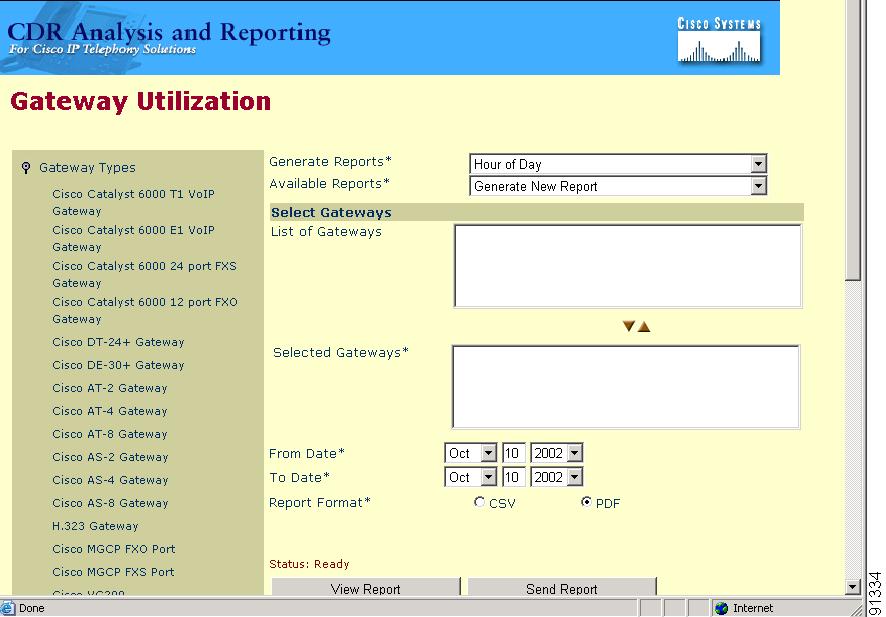
The tree structure expands and a list of gateway types displays, as shown in Figure 18-5.
Figure 18-5 Tree Structure Expanded Displaying Gateway Types
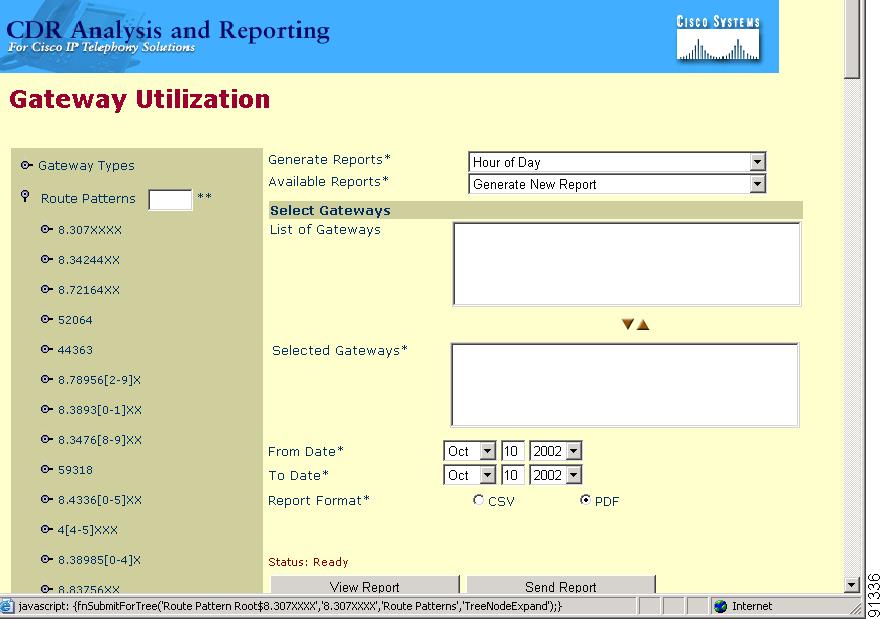
A list of gateway types displays. To specify only those gateways that use a particular route pattern, rather than a gateway type, click Route Patterns in the column on the left side of the window.
The tree structure expands and displays a list of route patterns as shown in Figure 18-6.
Figure 18-6 Tree Structure Expanded Displaying Route Patterns
Note
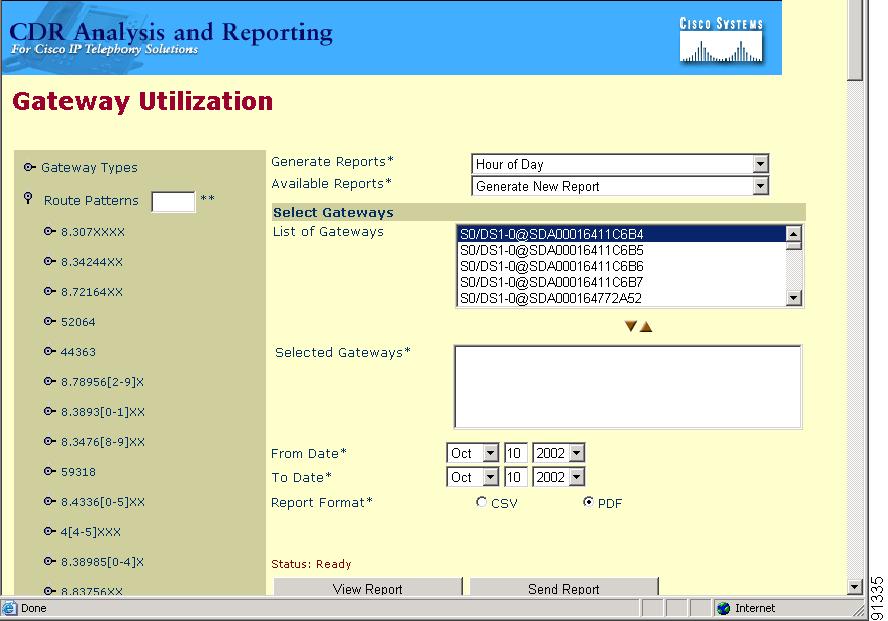
Step 5
The gateway name displays in the List of Gateways box as shown in Figure 18-7.
Figure 18-7 List of Gateways
Note
Step 6
Note
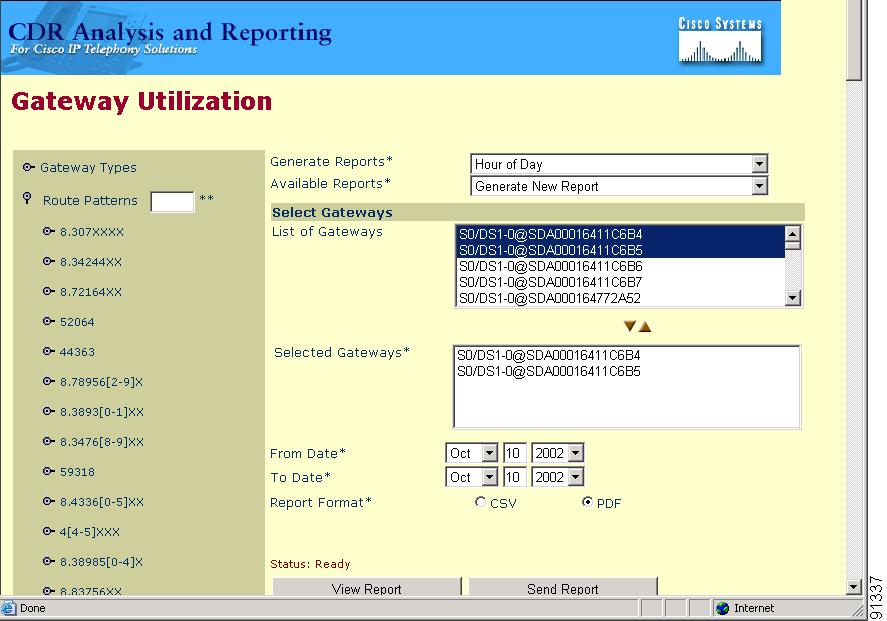
Step 7
The gateway(s) you chose displays in the Selected Gateways box, as shown in Figure 18-8.
Figure 18-8 Selected Gateways
Step 8
Note
Step 9
You can view CSV files in CAR or save them to disk and view them by using a spreadsheet application such as Microsoft Excel; you can view PDF files in CAR by using Adobe Acrobat Reader.
Step 10
If you chose CSV, the report generates, and you are prompted to view the file or to save it to disk. If you chose PDF, the report displays.
Step 11
Related Topic
•
Route Group Utilization Reports Configuration
Only CAR administrators generate the route group utilization report. This report provides an estimate of the maximum utilization percentage of the route group (cumulative utilization of all the gateways under the route group) for the period and not the exact utilization. The system calculates the utilization in the same way as it is done for Gateway Utilization, but this calculation gives cumulative utilization of all the gateways under the route group. You can examine the usage based on each hour of a day or on a specified number of days for each week or month. Reports generates for each of the selected route groups.
You can either view reports that the system automatically generates or generate new reports. Only CAR administrators can schedule reports for automatic generation. See CAR System Configuration, for more information.
Caution
This section describes how to generate, view, or mail route group utilization reports.
Procedure
Step 1
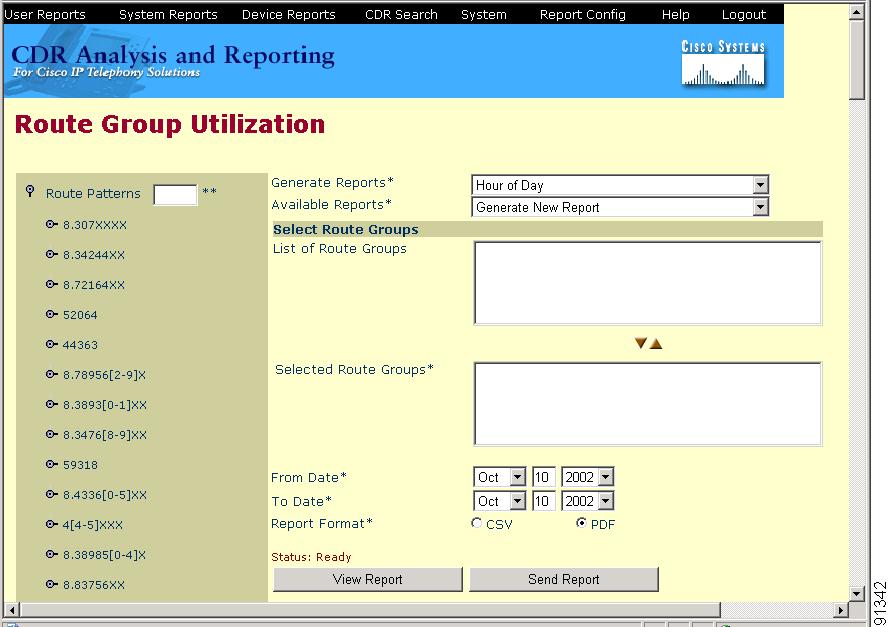
The Route Group Utilization window displays.
Step 2
Step 3
Step 4
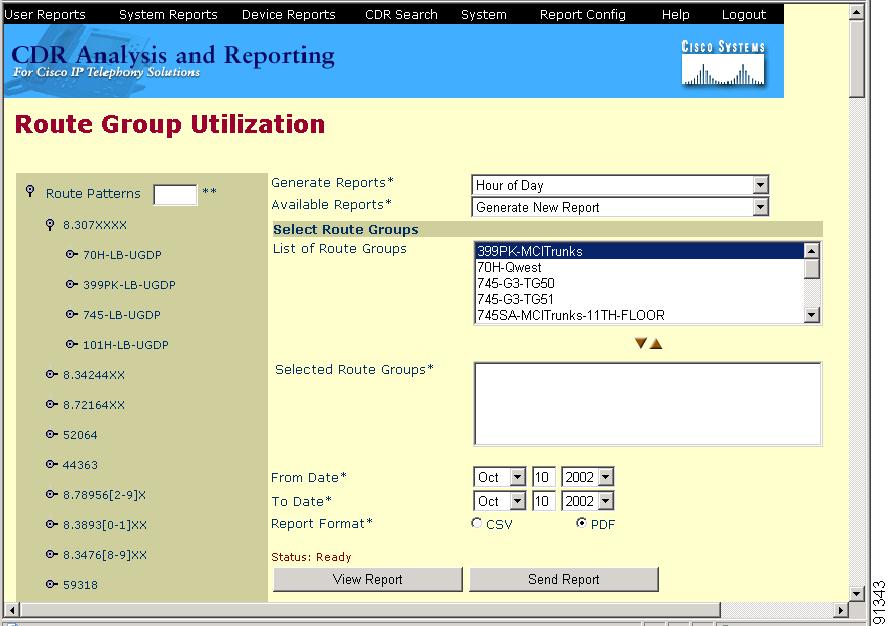
The tree structure expands displaying the route patterns you chose, as shown in Figure 18-9.
Figure 18-9 Tree Stucture Expanded Displaying Route Patterns
Note
Step 5
The route groups for this route pattern display in the List of Route Groups box, as shown in Figure 18-10.
Figure 18-10 List of Route Groups
Note
Step 6
Note
Step 7
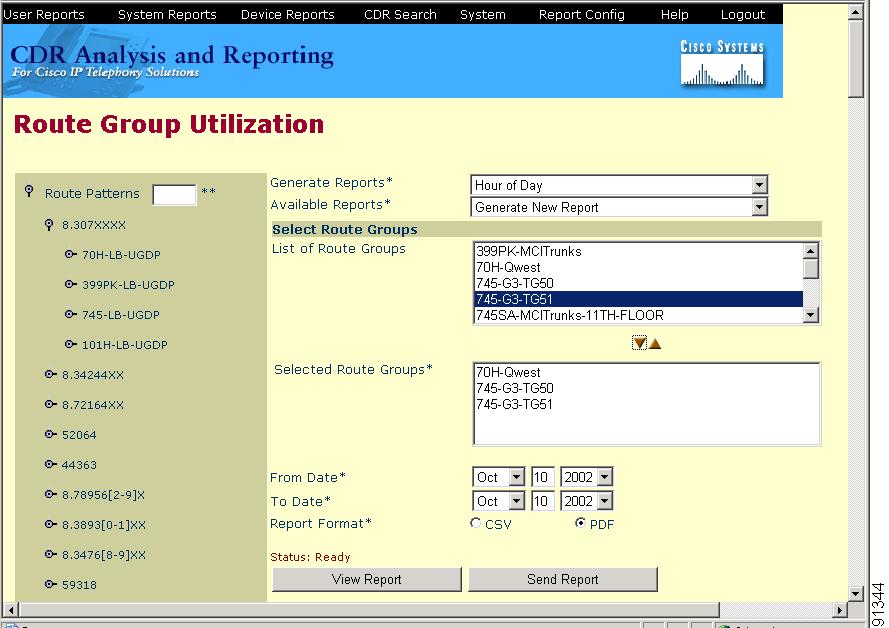
The route groups you chose display in the Selected Route Groups box, as shown in Figure 18-11.
Figure 18-11 Selected Route Groups
Step 8
Note
Step 9
You can view CSV files in CAR or save them to disk and view them by using a spreadsheet application such as Microsoft Excel; you can view PDF files in CAR by using Adobe Acrobat Reader.
Step 10
If you chose CSV, the report generates, and you are prompted to view the file or to save it to disk. If you chose PDF, the report displays.
Step 11
Related Topic
•
Route List Utilization Report Configuration
Only CAR administrators generate the route list utilization report. The route list utilization report provides an estimate of the maximum utilization percentage of the route list (cumulative utilization of all the gateways under the route list) for the period and not the exact utilization. The system calculates the utilization in the same way as it is done for Gateway Utilization, but this gives cumulative utilization of all the gateways under the route list.
You can examine the usage based on each hour of a day or on a specified number of days for each week or month. Reports generate for each of the selected route lists.
You can either view reports that the system automatically generates or generate new reports. Only CAR administrators can schedule reports for automatic generation. See System Scheduler Configuration, for more information.
Caution
This section describes how to generate, view, or mail route list utilization reports.
Procedure
Step 1
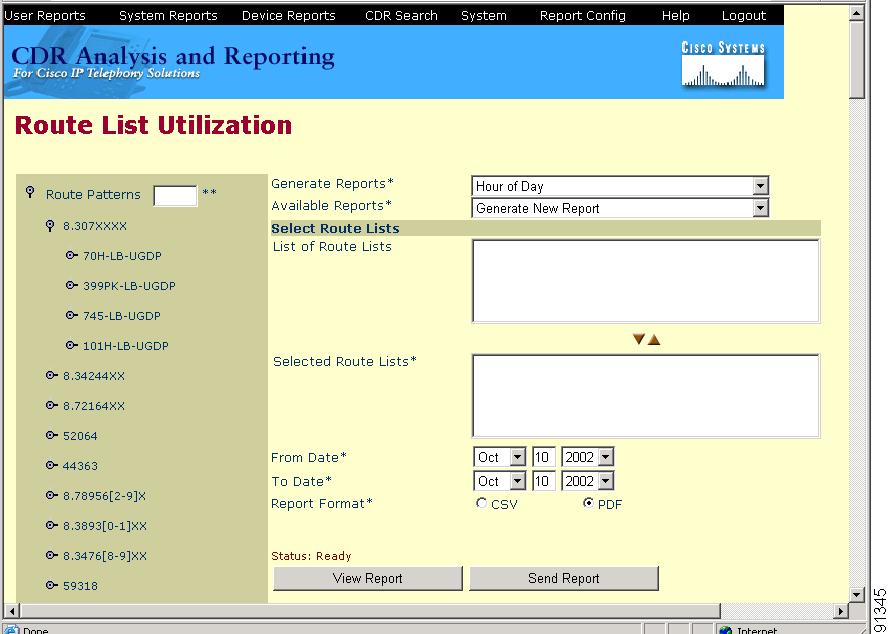
The Route List Utilization window displays.
Step 2
Table 18-6 Generate Report Fields
Hour of Day
Displays the cumulative results for each hour in a 24-hour period for the period that you specify in Step 8.
Day of Week
Displays the days of the week that occur within the period that you specify in Step 8.
Day of Month
Displays the days of the month that occur within the period that you specify in Step 8.
Step 3
Step 4
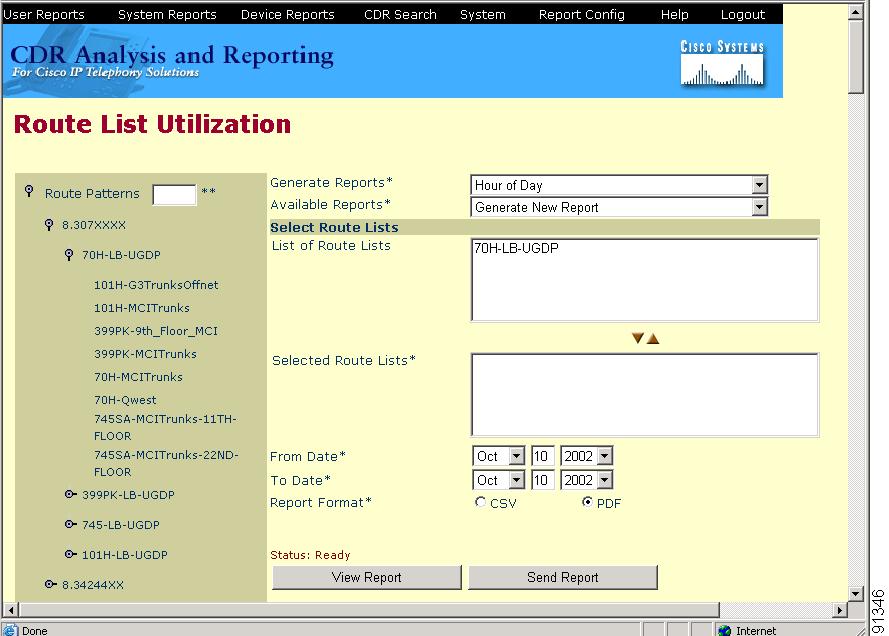
The tree structure expands displaying the route patterns you chose, as shown in Figure 18-12.
Figure 18-12 Tree Stucture Expanded Displaying Route Patterns
Note
Step 5
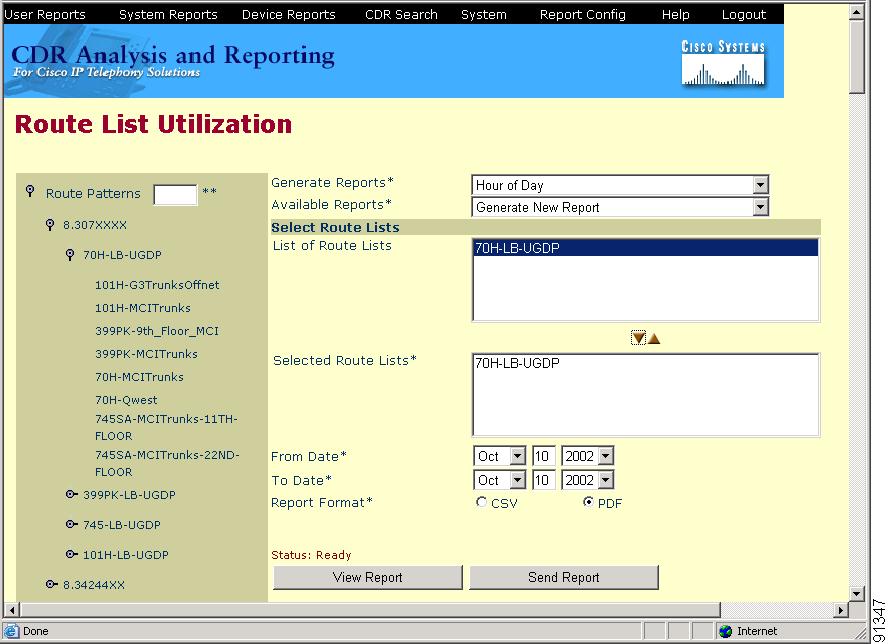
The route list name displays in the List of Route Lists box, as shown in Figure 18-13.
Figure 18-13 List of Route Lists
Note
Step 6
Note
Step 7
The route lists you chose display in the Selected Route Lists box, as shown in Figure 18-14.
Figure 18-14 Selected Route Lists
Step 8
Note
Step 9
You can view CSV files in CAR or save them to disk and view them by using a spreadsheet application such as Microsoft Excel; you can view PDF files in CAR by using Adobe Acrobat Reader.
Step 10
If you chose CSV, the report generates, and you are prompted to view the file or to save it to disk. If you chose PDF, the report displays.
Step 11
Related Topic
•
Route Pattern Utilization Report Configuration
Only CAR administrators generate the route pattern utilization report. The report provides an estimate of the maximum utilization percentage of the route pattern (cumulative utilization of all the gateways under the route pattern) for the period and not the exact utilization. The system calculates the utilization in the same way as it is done for Gateway Utilization, but this gives cumulative utilization of all the gateways under the route pattern. You can examine the usage based on each hour of a day or on a specified number of days for each week or month. Reports generate for each of the selected route patterns.
You can either view reports that the system automatically generates or generate new reports. Only CAR administrators can schedule reports for automatic generation. See System Scheduler Configuration, for more information.
Caution
This section describes how to generate, view, or mail route pattern utilization reports.
Procedure
Step 1
The Route Pattern Utilization window displays.
Step 2
Table 18-7 Generate Report Fields
Hour of Day
Displays the cumulative results for each hour in a 24-hour period for the period that you specify in Step 8.
Day of Week
Displays the days of the week that occur within the period that you specify in Step 8.
Day of Month
Displays the days of the month that occur within the period that you specify in Step 8.
Step 3
Step 4
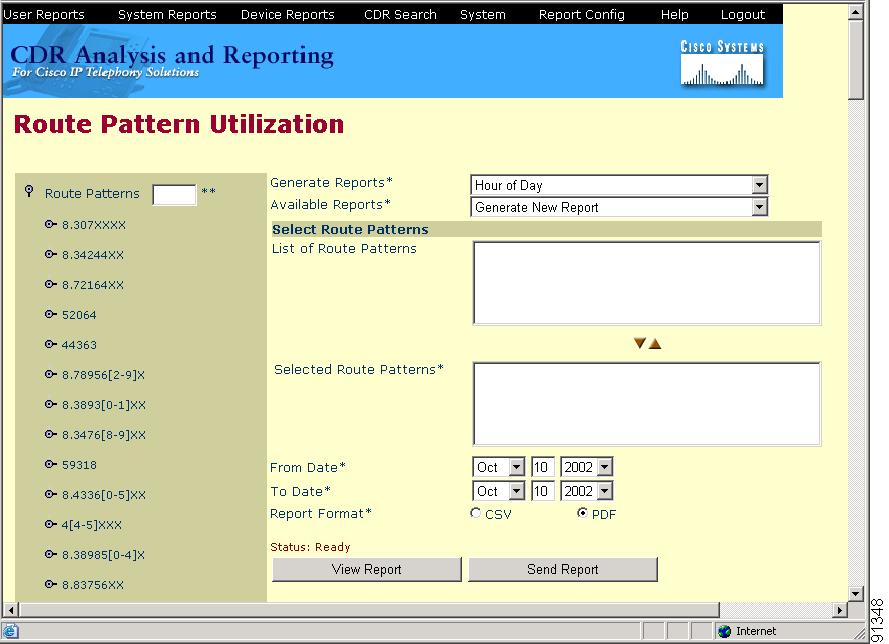
The tree structure expands displaying the route pattern(s) you chose, as shown in Figure 18-15.
Figure 18-15 Tree Structure Expanded Displaying Route Patterns
Note
Step 5
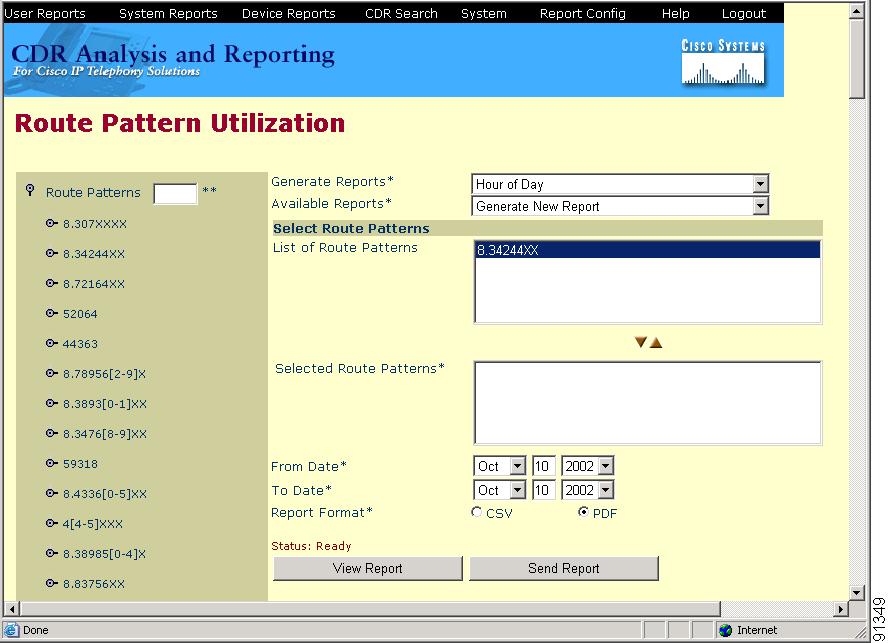
The route pattern name displays in the List of Route Patterns box, as shown in Figure 18-16.
Figure 18-16 List of Route Patterns
Note
Step 6
Note
Step 7
The route pattern you chose displays in the Selected Route Patterns box, as shown in Figure 18-17.
Figure 18-17 Selected Route Patterns
Step 8
Note
Step 9
You can view CSV files in CAR or save them to disk and view them by using a spreadsheet application such as Microsoft Excel; you can view PDF files in CAR by using Adobe Acrobat Reader.
Step 10
If you chose CSV, the report generates, and you are prompted to view the file or to save it to disk. If you chose PDF, the report displays.
Step 11
Related Topic
•
Configuring Conference Bridge Utilization Reports
Only CAR administrators generate the conference bridge utilization report. The report provides an estimate of the maximum utilization percentage of the Conference Bridges (cumulative utilization of all the Conference Bridges in the system) for the period and not the exact utilization. For example, the system calculates the utilization of a Conference Bridge between 11hrs-12hrs by sampling the one-hour duration in 5-minute equal samples. The utilization for each 5 minutes gets calculated as (number of calls in the 5-minute interval that used the conference bridge *100) / (maximum number of calls that the conference bridge can handle at any time). After calculating the utilization for each 5-minute sample for the whole one-hour duration, the maximum utilization value found for that one hour displays in the report as the utilization for the time between 11hrs-12hrs. You can examine the usage based on each hour of a day or on a specified number of days for each week or month. Reports generate for each conference bridge.
You can either view reports that the system automatically generates or generate new reports. Only CAR administrators can schedule reports for automatic generation. See System Scheduler Configuration, for more information.
Caution
This section describes how to generate, view, or mail conference bridge utilization reports.
Procedure
Step 1
The Conference Bridge Utilization window displays.
Step 2
Table 18-8 Generate Report Fields
Hour of Day
Displays the cumulative results for each hour in a 24-hour period for the period that you specify in Step 4.
Day of Week
Displays the days of the week that occur within the period that you specify in Step 4.
Day of Month
Displays the days of the month that occur within the period that you specify in Step 4.
Step 3
Step 4
Note
Step 5
You can view CSV files in CAR or save them to disk and view them by using a spreadsheet application such as Microsoft Excel; you can view PDF files in CAR by using Adobe Acrobat Reader.
Step 6
If you chose CSV, the report generates, and you are prompted to view the file or to save it to disk. If you chose PDF, the report displays.
Step 7
Related Topic
•
Configuring Voice-Mail Utilization Reports
Only CAR administrators generate the voice-mail utilization report. The report provides an estimate of the maximum utilization percentage of the voice-mail devices for the period and not the exact utilization. For example, the system calculates the utilization of a voice-mail device between 11hrs-12hrs by sampling the one-hour duration in 5-minute samples. The system calculates utilization for each 5 minutes as (number of calls in the 5-minute interval that used the voice-mail devices *100) / (maximum number of calls that the voice-mail devices can handle at any time). After calculating the utilization for each 5-minute sample for the entire one-hour duration, the maximum utilization value that is found for that one hour displays in the report as the utilization for the time between 11hrs-12hrs. Similarly, to get a utilization for the whole day, the whole day comprises samples of 5 minutes each, and maximum utilization is calculated. You can examine the usage based on each hour of a day or on a specified number of days for each week or month. Reports generate for each voice-mail server.
You can either view reports that have been automatically generated by the system or generate new reports. Only CAR administrators can schedule reports for automatic generation. See System Scheduler Configuration, for more information.
Note
Caution
This section describes how to generate, mail, or view voice mail utilization reports.
Procedure
Step 1
The Voice Mail Utilization window displays.
Step 2
Table 18-9 Generate Report Fields
Hour of Day
Displays the cumulative results for each hour in a 24-hour period for the period that you specify in Step 4.
Day of Week
Displays the days of the week that occur within the period that you specify in Step 4.
Day of Month
Displays the days of the month that occur within the period that you specify in Step 4.
Step 3
Step 4
Note
Step 5
You can view CSV files in CAR or save them to disk and view them by using a spreadsheet application such as Microsoft Excel; you can view PDF files in CAR by using Adobe Acrobat Reader.
Step 6
If you chose CSV, the report generates, and you are prompted to view the file or to save it to disk. If you chose PDF, the report displays.
Step 7
Related Topic