-
Cisco Nexus 6000 Troubleshooting Guide
-
Preface
-
Troubleshooting Overview
-
Troubleshooting FCoE Issues
-
Troubleshooting Layer 2 Switching Issues
-
Troubleshooting QoS Issues
-
Troubleshooting SAN Switching Issues
-
Troubleshooting Security Issues
-
Troubleshooting System Management Issues
-
Troubleshooting Virtual Port Channel Issues
-
Troubleshooting Config-Sync Issues
-
 Feedback
Table Of Contents
Troubleshooting a Switch Crash
Fabric Manager Tools and CLI Commands
Displaying what is required from the configuration
Using the pipe command to only display required keyword
Redirecting output of the show tech-support details command
Characteristics of Destination Ports
Debugs to the Direct Telnet Window
Troubleshooting Overview
This chapter introduces the basic concepts, methodology, and general troubleshooting guidelines for problems that may occur when configuring and using the Cisco Nexus 5000 Series switch.
This chapter includes the following sections:
•
Fabric Manager Tools and CLI Commands
Troubleshooting Basics
The following are the basic steps for troubleshooting:
Step 1
Step 2
Step 3
To identify the possible problems, you need to use a variety of tools and understand the overall configuration.The following chapters in this guide describe many approaches and specific solutions to potential problems.
Troubleshooting a Switch Crash
When a switch crashes, the cause might be from the failure of a process, and results in a reload of the switch.
A crash is usually recorded with a core file on the switch and includes the reason for the crash, such as a failed process. The following can help you determine the cause of the crash:
•
switch# show system reset-reasonPlease look at Note Details1) At 4054 usecs after Sat Nov 6 15:15:01 2010Reason: Reset triggered due to HA policy of ResetService: clis hap resetVersion: 4.2(1)N2(1)2) At 841383 usecs after Sat Nov 6 14:56:25 2010Reason: Reset triggered due to HA policy of ResetService: clis hap resetVersion: 4.2(1)N2(1)•
switch#show process logProcess PID Normal-exit Stack Core Log-create-time--------------- ------ ----------- ----- ----- ---------------clis 4023 N Y Y Sat Nov 6 15:14:53 2010clis 4155 N Y N Sat Nov 6 14:56:18 2010•
switch# show processes log detailsService: clisDescription: CLI ServerStarted at Sat Nov 6 14:59:10 2010 (882984 us)Stopped at Sat Nov 6 15:14:53 2010 (614588 us)Uptime: 15 minutes 43 secondsStart type: SRV_OPTION_RESTART_STATELESS (23)Death reason: SYSMGR_DEATH_REASON_FAILURE_SIGNAL (2)Last heartbeat 9.35 secs agoRLIMIT_AS: 687474867System image name: n5000-uk9.4.2.1.N2.1.binSystem image version: 4.2(1)N2(1) S0PID: 4023Exit code: signal 11 (core dumped)Threads: 4026 4024 4025•
switch#show coresModule-num Instance-num Process-name PID Core-create-time---------- ------------ ------------ --- ----------------1 1 clis 4023 Nov 6 15:20•
•
switch# show logging[snip]2010 Nov 6 08:00:50 TTPSW-5020SF1 %$ VDC-1 %$ %STP-2-BLOCK_BPDUGUARD: Received BPDU on port Ethernet103/1/1 with BPDU Guard enabled. Disabling port.2010 Nov 6 08:00:51 TTPSW-5020SF1 %$ VDC-1 %$ %ETHPORT-2-IF_DOWN_ERROR_DISABLED: Interface Ethernet103/1/1 is down (Error disabled. Reason:BPDUGuard)2010 Nov 6 14:56:18 TTPSW-5020SF1 %$ VDC-1 %$ %SYSMGR-2-SERVICE_CRASHED: Service "clis" (PID 4155) hasn't caught signal 11 (core will be saved).Best Practices
Best practices are the recommended steps you should take to ensure the proper operation of your switch.
•
•
•
•
•
Common Terms
Fabric Manager Tools and CLI Commands
This section highlights the tools and CLI commands that are commonly used to troubleshoot problems. These tools and commands are a portion of what you may use to troubleshoot your specific problem.
The following chapters in this guide may describe additional tools and commands specific to the symptoms and possible problems covered in that chapter.
NX-OS Tips
Displaying what is required from the configuration
switch# show running-config interfaceversion 4.0(1a)N2(1)interface vfc29no shutdownbind interface Ethernet1/29interface fc2/3no shutdownswitchport speed 1000switchport mode SDinterface fc2/4interface Ethernet1/1speed 1000Displaying within Config Mode
With NX-OS, you can display required data from within the configuration mode, so there is no need to back out to the switch prompt.
switch(config)# show runswitch(config)# show interface briefPipe command
switch# show logging |egrep Egrepgrep Grephead Stream Editorlast Display last linesless Stream Editorno-more Turn-off pagination for command outputsed Stream Editorwc Count words, lines, charactersbegin Begin with the line that matchescount Count number of linesexclude Exclude lines that matchinclude Include lines that matchUsing the pipe command to only display required keyword
switch# show running-config | include switchportsystem default switchportswitchport mode trunkswitchport trunk allowed vlan 1,18switchport mode fex-fabricswitchport mode fex-fabricswitchport speed 1000switchport mode SDno system default switchport shutdownCopy command
switch# copy ?bootflash: Select source filesystemcore: Select source filesystemdebug: Select source filesystemftp: Select source filesystemlicenses Backup license fileslog: Select source filesystemmodflash: Select source filesystemnvram: Select source filesystemrunning-config Copy running configuration to destinationscp: Select source filesystemsftp: Select source filesystemstartup-config Copy startup configuration to destinationsystem: Select source filesystemtftp: Select source filesystemvolatile: Select source filesystemRedirecting output
NX-OS allows you to redirect outputs to files and flash areas in the switch.
switch# show tech-support aaa > bootflash:ciscolive09switch# dir103557265 Apr 01 17:39:22 2009 .tmp-system12451 Apr 10 16:36:37 2009 ciscolive0949152 Apr 01 17:39:22 2009 lost+found/20058112 Oct 21 13:10:44 2008 n5000-uk9-kickstart.4.0.0.N1.2.bin20193280 Apr 01 17:36:37 2009 n5000-uk9-kickstart.4.0.1a.N2.1.bin76930262 Oct 21 13:11:33 2008 n5000-uk9.4.0.0.N1.2.bin103557265 Apr 01 17:37:30 2009 n5000-uk9.4.0.1a.N2.1.bin4096 Jan 01 00:03:26 2005 routing-sw/Redirecting output of the show tech-support details command
Use the tac-pac filename command to redirect the output of the show tech-support details command to a file and then gzip the file.
The file is stored on bootflash://filename provided that there is enough memory available. If you do not specify a filename, NX-OS creates the file as volatile:show_tech_out.gz. Copy the file from the device using the procedure in the copy command section.
switch# tac-pacswitch# dir volatile:374382 Aug 16 17:15:55 2010 show_tech_out.gzFrom volatile, copy the file to the bootflash, FTP, or TFTP server.
switch# copy volatile:show_tech_out.gz ?bootflash: Select destination filesystemdebug: Select destination filesystemftp: Select destination filesystemlog: Select destination filesystemmodflash: Select destination filesystemnvram: Select destination filesystemrunning-config Copy from source to running configurationscp: Select destination filesystemsftp: Select destination filesystemstartup-config Copy from source to startup configurationsystem: Select destination filesystemtftp: Select destination filesystemvolatile: Select destination filesystemNX-OS command listing
switch# show cli list | include ?-i Ignore case difference when comparing strings-x Print only lines where the match is a whole lineWORD Search for the expressionswitch# show cli list | include debug | include interfaceNarrowing scope of keywords
You can use many commands like grep and include to narrow the scope of a keyword.
switch(config-if)# show interface | grep fcfc2/1 is trunkingfc2/2 is trunkingfc2/3 is upfc2/4 is down (Administratively down)vfc29 is upLogging
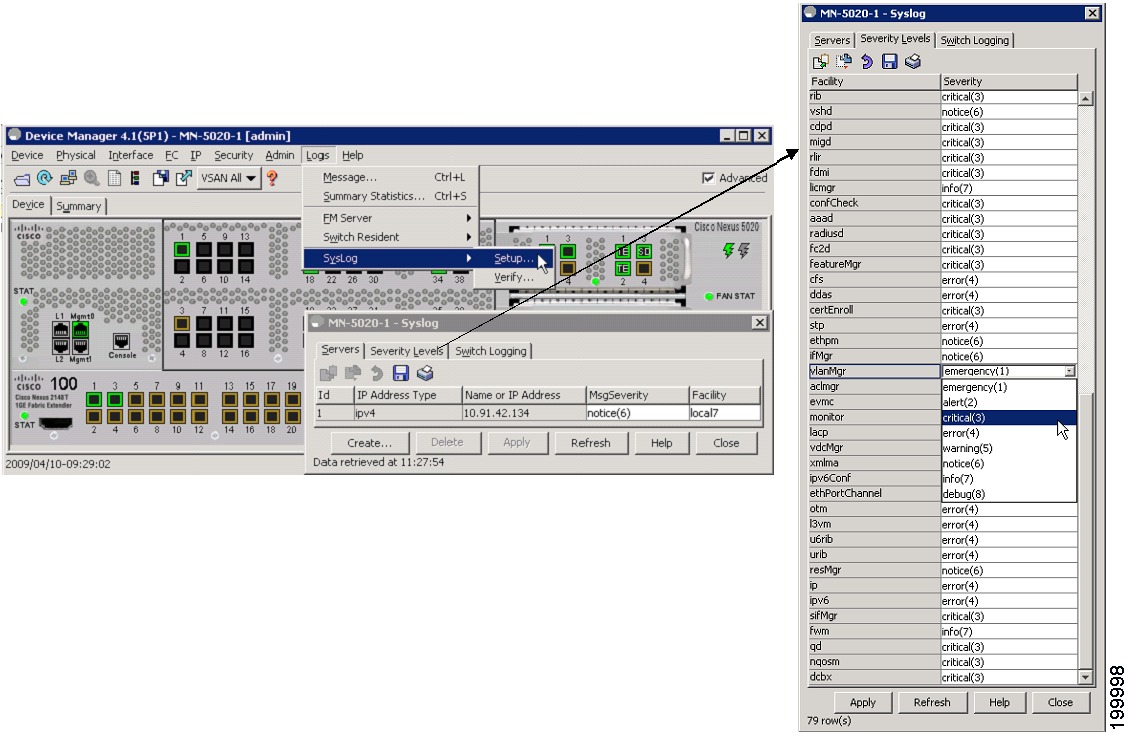
You can use logging through the CLI or Device Manager. In the following examples, the logging command and the Device Manager display severity information:
Viewing Severity Information with the CLI
switch(config)# show loggingLogging console: enabled (Severity: critical)Logging monitor: enabled (Severity: notifications)Logging linecard: enabled (Severity: notifications)Logging fex: enabled (Severity: notifications)Logging timestamp: SecondsLogging server: enabled{10.91.42.134}server severity: notificationsserver facility: local7server VRF: managementLogging logflash: disabledLogging logfile: enabledName - ciscolive09: Severity - debugging Size - 4194304Viewing Severity Levels in the Device Manager
Ethanalyzer and SPAN
Ethanalyzer is a tool that collects frames that are destined to, or originate from, the Nexus 5000 control plane. Node to switch or switch to switch traffic can be seen with this tool.
SPAN is a feature whereby frames that are transient to the switch are copied to a second port for analysis. Node to switch or node to node traffic can be seen via this method.
Ethanalyzer
Ethanalyzer is a Cisco NX-OS protocol analyzer tool based on the Wireshark open source code. This tool is a command-line version of Wireshark that captures and decodes packets. You can use Ethanalyzer to troubleshoot your network and analyze the control-plane traffic.
Examples
switch# ethanalyzer local sniff-interfaceNo matches in current mode, matching in (exec) modeinbound-hi Inbound(high priority) interfaceinbound-low Inbound(low priority) interfacemgmt Management interfaceswitch# ethanalyzer local sniff-interface mgmt briefCapturing on eth02008-08-13 01:34:23.776519 10.116.167.244 -> 172.18.217.80 TCP 1106 > telnet [ACK] Seq=0 Ack=0 Win=64040 Len=02008-08-13 01:34:23.777752 172.18.217.80 -> 10.116.167.244 TELNET Telnet Data ...2008-08-13 01:34:23.966262 00:04:dd:2f:75:10 -> 01:80:c2:00:00:00 STP Conf. Root = 32768/00:04:c1:0f:6e:c0 Cost = 57 Port = 0x801d[snip]The following example is for viewing the Spanning Tree Protocol (STP) and Fibre Channel: Using 0 in the command captures output until you press Ctrl-C. The FCID is a well-known name for switch domain controller.
switch# ethanalyzer local sniff-interface inbound-hi brief limit-captured-frames 0Capturing on eth42008-08-13 01:37:16.639896 00:0d:ec:6b:cd:41 -> 01:80:c2:00:00:00 1 0 00:0d:ec:6b:cd:41 -> 01:80:c2:00:00:00 0x0 0x0 STP RST. Root = 32769/00:0d:ec:6b:cd:41 Cost = 0 Port = 0x80932008-08-13 01:37:18.639992 00:0d:ec:6b:cd:41 -> 01:80:c2:00:00:00 1 0 00:0d:ec:6b:cd:41 -> 01:80:c2:00:00:00 0x0 0x0 STP RST. Root = 32769/00:0d:ec:6b:cd:41 Cost = 0 Port = 0x8093[snip]2008-08-13 01:37:23.220253 00:0d:ec:6b:cd:40 -> fc:fc:fc:ff:ff:fd 4 0 ff.ff.fd -> ff.ff.fd 0x5384 0xffff SW_ILS ELP2008-08-13 01:37:23.220615 00:0d:ec:6b:cd:40 -> aa:bb:cc:dd:01:04 4 0 ff.ff.fd -> ff.ff.fd 0x5384 0x2b3f FC Link Ctl, ACK12008-08-13 01:37:23.227202 00:0d:ec:6b:cd:40 -> aa:bb:cc:dd:01:04 4 0 ff.ff.fd -> ff.ff.fd 0x5384 0x2b3f SW_ILS SW_ACC (ELP)2008-08-13 01:37:23.229927 00:0d:ec:6b:cd:40 -> fc:fc:fc:ff:ff:fd 4 0 ff.ff.fd -> ff.ff.fd 0x5384 0x2b3f FC Link Ctl, ACK1Detailed BPDU
switch# ethanalyzer local sniff-interface inbound-hi limit-captured-frames 0Capturing on eth4Frame 1 (57 bytes on wire, 57 bytes captured)Arrival Time: Aug 13, 2008 01:41:32.631969000[Time delta from previous captured frame: 1218591692.631969000 seconds][Time delta from previous displayed frame: 1218591692.631969000 seconds][Time since reference or first frame: 1218591692.631969000 seconds]Frame Number: 1Frame Length: 57 bytesCapture Length: 57 bytes[Frame is marked: False][Protocols in frame: eth:vlan:llc:stp][snip]DSAP: Spanning Tree BPDU (0x42)IG Bit: IndividualSSAP: Spanning Tree BPDU (0x42)CR Bit: CommandControl field: U, func=UI (0x03)000. 00.. = Command: Unnumbered Information (0x00).... ..11 = Frame type: Unnumbered frame (0x03)[snip]SPAN
The Switched Port Analyzer (SPAN) feature—sometimes called port mirroring or port monitoring—selects network traffic for analysis by a network analyzer. The network analyzer can be a Cisco SwitchProbe, a Fibre Channel Analyzer, or other Remote Monitoring (RMON) probes.
SPAN sources refer to the interfaces from which traffic can be monitored. The Cisco Nexus 5000 Series switch supports Ethernet, virtual Ethernet, Fibre Channel, virtual Fibre Channel, port channels, SAN port channels, VLANs, and VSANs as SPAN sources. With VLANs or VSANs, all supported interfaces in the specified VLAN or VSAN are included as SPAN sources. You can choose the SPAN traffic in the ingress direction, the egress direction, or both directions for Ethernet, virtual Ethernet, Fibre Channel, and virtual Fibre Channel source interfaces:
•
•
Note
Source Ports
A source port, also called a monitored port, is a switched interface that you monitor for network traffic analysis. The switch supports any number of ingress source ports (up to the maximum number of available ports on the switch) and any number of source VLANs or VSANs.
A source port has these characteristics:
•
•
•
•
•
•
•
•
SPAN Destinations
SPAN destinations refer to the interfaces that monitors source ports. The Cisco Nexus 5000 Series switch supports Ethernet and Fibre Channel interfaces as SPAN destinations.
Characteristics of Destination Ports
Each local SPAN session must have a destination port (also called a monitoring port) that receives a copy of traffic from the source ports, VLANs, or VSANs. A destination port has these characteristics:
•
•
•
•
•
•
Monitor Caveats
Limitations of Nexus 5000 SPAN CoS values are not preserved at the monitor (span) destination.
•
•
•
Configuration limitations: VLAN or port-channel cannot be configured as egress source
•
•
•
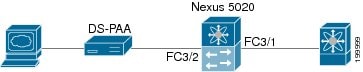
SPAN Configuration
Example:
switch(config)# interface fc3/2switch(config-if)# switchport mode sdswitch(config-if)# switchport speed 1000switch(config-if)# no shutswitch(config-if)# exitswitch(config)# monitor session 1switch(config-monitor)# source interface fc3/1 txswitch(config-monitor)# source interface fc3/1 rxswitch(config-monitor)# destination interface fc3/2
Verifying the SPAN Session
Example:
switch# show monitor sessionSESSION STATE REASON DESCRIPTION------- ----------- ---------------------- --------------------------------1 up The session is upswitch# show monitor session 1session 1---------------type : localstate : upsource intf :rx : fc3/1tx : fc3/1both : fc3/1source VLANs :rx :source VSANs :rx :destination ports : fc3/2Suspending the SPAN Session
Example:
switch(config)# monitor session 1 suspendswitch(config)# show monitor session 1session 1---------------type : localstate : down (Session suspended)source intf :rx : fc3/1tx : fc3/1both : fc3/1source VLANs :rx :source VSANs :rx :destination ports : fc3/2Debugging
Command-Line Debugging
Available debugs depend on features enabled in NX-OS. There are many different options to select when turning on debugs.
Determine the destination of the output:
•
•
You must have administrator privileges to run debugs. Debugs can only be run from the CLI.
Debug Logging
Set the log file as CiscoLive_debugs, using the debug logfile command. Then, use the show debug command to see name of the debug file.
switch# debug logfile CiscoLive_debugsswitch# show debugDisplay debugging to the screen with the following command:
switch# show debug logfile CiscoLive_debugsCopy the debug file from MDS to a server with the copy command. When you enter the VRF, if none is specified then the default is used.
switch# copy log:CiscoLive_debugs tftp:Enter vrf: managementEnter hostname for the tftp server: 10.91.42.134Trying to connect to tftp server......Connection to Server Established.|TFTP put operation was successfulTo delete the debug logfile, use one of the following commands:
switch# clear debug-logfile CiscoLive_debugsswitch# undebug allIf you do not use one of these commands, the debug logfile will be cleared and overwritten when the next debug logfile is created. The system only allows one debug logfile to exist.
Debugs to the Direct Telnet Window
•
•
•
•
Cisco Discover Protocol
Cisco Discover Protocol (CDP) version 2 is applied to the physical Ethernet interface and only works when enabled at both ends of the link. LLDP standard is derived from CDP.
CDP is used to verify proper connectivity to correct network devices, very useful at switch deployment.
The following example shows the arguments that can be used with the show CDP command:
switch# show cdpall Show interfaces that are CDP enabledentry Show CDP entries in databaseglobal Show CDP global parametersinterface Show CDP parameters for an interfaceneighbors Show CDP neighborstraffic Show CDP traffic statisticsswitch# show cdp globalGlobal CDP information:CDP enabled globallySending CDP packets every 60 secondsSending a holdtime value of 180 secondsSending CDPv2 advertisements is enabledSending DeviceID TLV in Default FormatDevice ID:TM-6506-1System Name:Interface address(es):IPv4 Address: 11.1.1.1Platform: cisco WS-C6506, Capabilities: Router Switch IGMP FilteringInterface: Ethernet1/4, Port ID (outgoing port): TenGigabitEthernet1/2 ? Verifies proper port connectionsHoldtime: 133 secVersion:Cisco Internetwork Operating System SoftwareIOS (tm) s72033_rp Software (s72033_rp-IPSERVICES_WAN-VM), Version 12.2(18)SXF11, RELEASE SOFTWARE (fc1)Technical Support: http://www.cisco.com/techsupportCopyright (c) 1986-2007 by cisco Systems, Inc.Compiled Fri 14-Sep-07 23:09 by kellythwAdvertisement Version: 2Native VLAN: 1 ? Sent on Native VLANDuplex: fullFailover
FCoE Traffic
When the Nexus 5000 experiences loss of fabric connectivity, it brings down all the affected vFC interfaces.
The following methods are used to signal the host of loss of connectivity to the FC fabric
•
•
Non-FCoE traffic
Under certain failure scenarios where the access switch has lost all uplink connectivity to the aggregation layer, the CNA needs to be signaled of the loss of LAN connectivity. This helps the CNA failover the host traffic to the standby port. Traditionally, such a failure is signaled by bringing down the host facing link. Bringing down the link achieves two purposes:
•
•
However, in the converged network, even though the LAN connectivity is lost at the access switch, the SAN connectivity might still be intact. Bringing down the entire host-facing link is not desirable. Instead, the loss of connectivity is signaled over protocols. Loss of SAN connectivity is signaled using the FIP Clear Virtual Link message. Loss of LAN connectivity is signaled using logical link status TLVs defined in DCBX and VIC protocols.
LAN Traffic
When LAN connectivity is lost for a particular VLAN on the uplinks, the VLAN is also brought down on the host-facing link.
Dedicating a VLAN solely for FCoE traffic helps with shutting down non-FCoE traffic to and from the host-facing link without disrupting FCoE traffic from the same host.