Table Of Contents
Overview of the CG-NMS North Bound API
API Overview
CG-NMS NB API Modules
Query Syntax
Property Field Names for All Devices
Property Field Names for Supported Routers
Property Field Names for Communications Modules
Metrics Field Names
Metrics for Communication Modules
Metrics for Communication Module Loopback Interface
Metrics for WPAN Module Interfaces
Metrics for PPP Interfaces
Metrics for RPL Interfaces
Metrics for Supported Connected Grid Routers
Metrics VPN Interfaces
Metrics for 3G Interfaces
Metrics for WiMAX Interfaces
Metrics for WPAN Interfaces
Metrics for Management Interfaces
Metrics for Ethernet Interfaces
Metrics for Serial Interfaces
Overview of the CG-NMS North Bound API
This chapter provides a general description of the North Bound API (NB API) supported by Cisco Connected Grid Network Management System (Cisco CG-NMS, or CG-NMS).
• API Overview
•Property Field Names for All Devices
•Metrics Field Names
API Overview
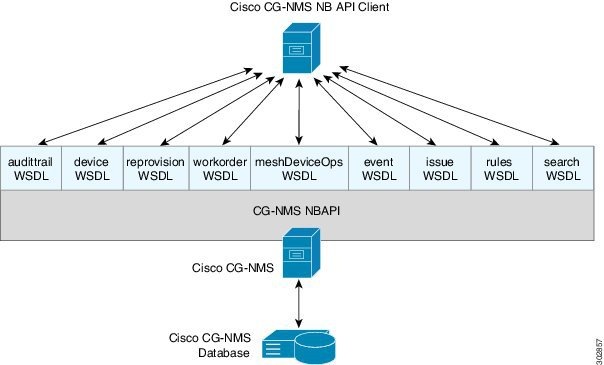
The CG-NMS maintains a database of inventory information about network devices, groups, properties, metrics, and events. You can access the database using the CG-NMS web interface. You can also access the database using the CG-NMS NB API.
The CG-NMS NB API is a Simple Object Access Protocol (SOAP) API that provides methods for:
•Read-only access to the CG-NMS database
•Push-based event reporting
Many of these API methods return lists of identifiers or objects. Because these lists could potentially be very long in a large network, every method has three optional arguments: queryId, count, and offset.
When no argument is included, the method call returns the first count list items. The maximum count is 1000 items.
To iterate through the full contents of a list, select a queryId, which is a random string. Then repeat the method call with the same queryId, and increment the offset by count for each call, starting from 0. When the method call returns an empty list, the iteration is finished, and the queryId is invalidated on the server. Reusing the queryId starts the request again from the beginning. If a particular queryId is not used for 10 minutes, it will be cleared to conserve resources.
The API uses HTTPS and HTTP Basic Authentication for username and password authorization.
CG-NMS NB API Modules
CG-NMS defines the following API modules:
API Module
|
WSDL URL
|
Methods
|
audittrail
Audit Trail API, page 2-1
|
http://<server_address>/nbapi/audittrail?wsdl
|
deleteAuditTrailsByTime
getAuditTrailsByOperation
getAuditTrailsByTime
getAuditTrailsByUser
getAuditTrailsByUserAndIp
getAuditTrailsByUserAndOperation
getAuditTrailsByUserIpAndOperation
|
device
Device Management API, page 3-1
|
http://<server_address>/nbapi/device?wsdl
|
addDevices
exportDevices
getJob
removeDevices
setDevices
updateDevices
|
event
Event API, page 4-1
|
http://<server_address>/nbapi/event?wsdl
|
searchEvents
subscribeForCgmeshOutage
subscribeForEvents
unSubscribeForCgmeshOutage
unSubscribeForEvents
|
issue
Issue API
|
http://<server_address>/nbapi/issue?wsdl
|
searchIssues
|
rules
Rules API, page 6-1
|
http://<server_address>/nbapi/rules?wsdl
|
activateRule
createRule
deactivateRule
dropRule
findRulesByName
findRulesByUsername
|
search
Search API, page 7-1
|
http://<server_address>/nbapi/search?wsdl
|
getDeviceDetails
getGroups
getMetricHistory
searchDevices
|
To view an API's WSDL from a web browser, use this URL format:
http://<server_address>/nbapi/<api>?wsdl
For example:
http://10.27.167.19/nbapi/event?wsdl
Query Syntax
The CG-NMS NB API supports the following simple query language:
Search := filter ?[filter ...]
Filter := Filter := <fieldName><operator><value>
operator := < | <= | > | >= | <> | = | :
Here are examples of search queries:
"deviceType:cgr1000 uptime>=100 uplinkTxDrops<-50"
"deviceType:cgmesh uptime>=100"
"" (search everything)
"uptime>=100 status:up"
"eid:xyz"
"xyz"
Property Field Names for All Devices
Table 1-1 describes the property field names available to all devices. The field names are case sensitive.
Table 1-1 Property Field Names for All Devices
Field Name
|
Type
|
Description
|
Example
|
eid
|
string
|
Unique identifier for the device. For routers and communication modules, this is the string representation of the X.500 distinguished name subject ID contained in the devices X.509 certificate. This field name is obtained from the notice-of-shipment file.
|
r1
|
deviceType
|
enum
|
Identifier for the device type, which indicates which CG-NMS module will be used to coordinate communications with the device. For routers, this will always be cgr1000.
For communication modules, this will always be cgmesh. Obtained from the notice-of-shipment file.
|
cgmesh
|
ip
|
string
|
Primary IP address that CG-NMS uses to contact the device. Can be IPv4 or IPv6. Obtained when the device registers with the CG-NMS.
|
1.1.1.1
|
lat
|
decimal
|
Latitude of the device, obtained from manual CSV import.
|
10
|
lng
|
decimal
|
Longitude of the device, obtained from manual CSV import.
|
-11.1
|
alt
|
decimal
|
Altitude of the device, obtained from manual CSV import.
|
10
|
mapLevel
|
decimal integer
|
Minimum map zoom level at which the device is displayed on the map, which is useful for visualization of larger networks. Obtained from manual CSV import. Optional field.
|
16
|
geoHash
|
string
|
String hash of the device's latitude and longitude values used for automatic hierarchical grid-based clustering of the devices.
|
|
lastHeard
|
timestamp
|
Time at which the device was last heard from or contacted. This is used as the primary determiner of device activity level and status.
Automatically set whenever the device reports to the CG-NMS or the CG-NMS contacts the device.
|
2011-05-02 00:00:00
|
status
|
enum
|
Current status of the device, which is automatically set by CG-NMS. Values are limited to up, down, and unheard.
|
up
|
certC
|
string
|
X.500 country name from the certificate subject, if one exists. Obtained from the notice-of-shipment file, as are the rest of the "cert" properties.
|
|
certST
|
string
|
X.500 state or province name, if one exists.
|
|
certL
|
string
|
X.500 locality name, if one exists.
|
|
certO
|
string
|
X.500 organization name, if one exists.
|
|
certOU
|
string
|
X.500 organizational unit name, if one exists.
|
|
certCN
|
string
|
X.500 common name, if one exists.
|
|
certSN
|
string
|
X.500 serial number, if one exists.
|
|
pid
|
string
|
Product ID for the device. For routers and communication modules, this is the Cisco Secure Unique Device Identifier (SUDI) product ID from the certificate.
|
|
vid
|
string
|
Version ID for the device. For routers and communication modules, this is obtained from the SUDI.
|
|
sn
|
string
|
Serial number for the device.
|
|
Property Field Names for Supported Routers
Table 1-2 describes the property field names available to supported Connected Grid routers. The field names are case sensitive.
Table 1-2 Property Field Names for Supported Routers
Field Name
|
Type
|
Description
|
meshAddress
|
string
|
IP address of the mesh link, which is assigned automatically by the CG-NMS during registration.
|
meshLocalAddress
|
string
|
Local WPAN address of the mesh link, which is assigned automatically by the CG-NMS during registration.
|
meshPrefix
|
string
|
Subnet prefix address.
|
meshPrefixLength
|
string
|
Subnet prefix address length.
|
meshPanid
|
string
|
Subnet Private Area Network (PAN) ID.
|
Property Field Names for Communications Modules
Table 1-3 describes the property field names available to communications modules. The field names are case sensitive.
Table 1-3 Property Field Names for Communications Modules
Field Name
|
Type
|
Description
|
meshAddress
|
string
|
IP address of the mesh link, which is assigned automatically by the CG-NMS during registration.
|
meshLocalAddress
|
string
|
Local WPAN address of the mesh link, which is assigned automatically by the CG-NMS during registration.
|
meshPrefix
|
string
|
Subnet prefix address.
|
meshPrefixLength
|
string
|
Subnet prefix address length.
|
meshPanid
|
string
|
Subnet PAN ID.
|
Metrics Field Names
Metrics collected by CG-NMS are defined per device type, and maintained in a XML file specific to each device type. CG-NMS locates the XML files after it loads the boot strap image.
Note Metrics defined for interfaces should not be used for search.
Metrics for Communication Modules
Table 1-4 describes the metrics for communication modules.
Table 1-4 Metrics for Communication Modules
Metric Name
|
Unit
|
Min.
|
Max
|
Description
|
uptime
|
sec.
|
0
|
31536000
|
Amount of time in seconds that the element has been running since last boot.
|
meshTxSpeed
|
bits/sec.
|
0
|
76800
|
Current speed of data transmission over the uplink network interface, measured in bits per second, averaged over a short element-specific time period.
|
meshTxDrops
|
drops/sec.
|
0
|
1
|
Rate of packets that were dropped while trying to transmit on the uplink interface because the outbound queue was full.
|
meshRxSpeed
|
bits/sec.
|
0
|
76800
|
Rate of data that has been received by the uplink network interface, measured in bits per second, averaged over a short element-specific time period.
|
meshRxReassemblyDrops
|
drops/sec.
|
0
|
1
|
Rate of incoming packet fragments that were dropped because there was no space in the reassembly buffer.
|
meshHops
|
hops
|
1
|
8
|
Number of hops that the element is from the root of its RPL routing tree.
|
meshLinkCost
|
|
1
|
3
|
RPL cost value for the link between the element and its uplink neighbor.
|
meshPathCost
|
|
1
|
24
|
RPL path cost value between the element and the root of the routing tree.
|
meshRssi
|
dBm
|
-80
|
20
|
Measured RSSI value of the primary mesh RF uplink.
|
meshReverseRssi
|
dBm
|
-80
|
20
|
RSSI value measured by the element's mesh uplink neighbor.
|
Metrics for Communication Module Loopback Interface
Table 1-5 describes the metrics for communication modules loopback interface.
Table 1-5 Metrics for Communication Modules Loopback Interface
Metric Name
|
Unit
|
Min.
|
Max
|
Description
|
txSpeed
|
bit/sec
|
0
|
76800
|
Current speed of data transmission over the interface, measured in bits per second, averaged over a short element-specific time period (e.g. an hour).
|
txDrops
|
drops/sec
|
0
|
1
|
Rate of packets that were dropped while trying to transmit on the interface because the outbound queue was full.
|
rxSpeed
|
bits/sec
|
0
|
76800
|
Rate of data that has been received by the network interface, measured in bits per second, averaged over a short element-specific time period (e.g. an hour).
|
txUnicastPackets
|
packets/sec
|
0
|
76800
|
Current packet receive rate over the interface, measured in packets per second, averaged over a short element-specific time period (e.g. an hour).
|
Metrics for WPAN Module Interfaces
Table 1-6 describes the metrics for WPAN module interfaces.
Table 1-6 Metrics for the WPAN Module Interfaces
Metric Name
|
Unit
|
Min
|
Max
|
Description
|
txSpeed
|
bits/sec
|
0
|
76800
|
Current speed of data transmission over the interface, measured in bits per second, averaged over a short element-specific time period (e.g. an hour).
|
txDrops
|
drops/sec
|
0
|
1
|
Rate of packets that were dropped while trying to transmit on the interface because the outbound queue was full.
|
txSpeed
|
bits/sec
|
0
|
76800
|
Rate of data that has been received by the network interface, measured in bits per second, averaged over a short element-specific time period (e.g. an hour).
|
txUnicastPackets
|
packets/sec
|
0
|
76800
|
Current packet send rate over the interface, measured in packets per second, averaged over a short element-specific time period (e.g. an hour).
|
rxUnicastPackets
|
packets/sec
|
0
|
76800
|
Current packet receive rate over the interface, measured in packets per second, averaged over a short element-specific time period (e.g. an hour).
|
Metrics for PPP Interfaces
Table 1-7 describes the metrics for PPP interfaces.
Table 1-7 Metrics for PPP Interfaces
Metric Name
|
Unit
|
Min
|
Max
|
Description
|
txSpeed
|
bits/sec
|
0
|
76800
|
Current speed of data transmission over the interface, measured in bits per second, averaged over a short element-specific time period.
|
txDrops
|
drops/sec
|
0
|
1
|
Rate of packets that were dropped while trying to transmit on the interface because the outbound queue was full.
|
rxSpeed
|
bits/sec
|
0
|
76800
|
Rate of data that has been received by the network interface, measured in bits per second, averaged over a short element-specific time period.
|
txUnicastPackets
|
packets/sec
|
0
|
76800
|
Current packet send rate over the interface, measured in packets per second, averaged over a short element-specific time period.
|
rxUnicastPackets
|
packets/sec
|
0
|
76800
|
Current packet receive rate over the interface, measured in packets per second, averaged over a short element-specific time period.
|
Metrics for RPL Interfaces
Table 1-8 describes the metrics for Routing Protocol for Low Power and Lossy Networks (RPL) interfaces.
Table 1-8 Metrics for RPL Interfaces
Metric Name
|
Unit
|
Min
|
Max
|
Description
|
hops
|
hops
|
1
|
8
|
Number of hops that the element is from the root of it's RPL tree.
|
linkCost
|
|
1
|
3
|
RPL cost value for the link between the element and it's uplink neighbor.
|
pathCost
|
|
1
|
24
|
RPL path cost value between the element and the root of the routing tree.
|
rssi
|
dBm
|
-80
|
20
|
Measured RSSI value of the primary mesh RF uplink.
|
reverseRSSI
|
dBm
|
-80
|
20
|
RSSI value measured by the element's mesh uplink neighbor.
|
.
Metrics for Supported Connected Grid Routers
Table 1-9 describes the metrics for supported routers.
Table 1-9 Metrics for Supported Routers
Metric Name
|
Unit
|
Min
|
Max
|
Description
|
uptime
|
sec
|
0
|
31536000
|
Amount of time, in seconds, that the element has been running since last boot.
|
batteryLevel
|
%
|
0
|
100
|
Percentage of charge remaining in the first battery.
|
batteryLevel2
|
%
|
0
|
100
|
Percentage of charge remaining in the second battery.
|
batteryRuntime
|
minutes
|
0
|
65535
|
Runtime remaining on the first battery.
|
batteryRuntime2
|
minutes
|
0
|
65535
|
Runtime remaining on the second battery.
|
chassisTemp
|
celsius
|
0
|
100
|
Internal temperature of the device.
|
cellRSSI
|
dBm
|
-100
|
0
|
Cell received Signal Strength Indicator (RSSI).
|
meshEndpointCount
|
devices
|
0
|
10000
|
Number of active mesh endpoints connected to this element.
|
uplinkTxSpeed
|
bits/sec
|
0
|
500000
|
Current speed of data transmission over the uplink network interface, measured in bits per second, averaged over a short element-specific time period.
|
uplinkTxDrops
|
drops/sec
|
0
|
1
|
Rate of packets that were dropped while trying to transmit on the uplink interface because the outbound queue was full.
|
uplinkRxSpeed
|
bits/sec
|
0
|
3000000
|
Rate of data that has been received by the uplink network interface, measured in bits per second, averaged over a short element-specific time period.
|
uplinkRxDrops
|
drops/sec
|
0
|
1
|
Rate of packets that were received on the uplink interface, but then dropped because the inbound queue was full.
|
uplinkRssi
|
dBm
|
-100
|
-50
|
Measured RSSI value of the primary RF uplink used for all RF uplinks.
|
meshTxSpeed
|
bits/sec
|
0
|
7600
|
Current speed of data transmission over the uplink network interface, measured in bits per second, averaged over a short element-specific time period.
|
meshTxDrops
|
drops/sec
|
0
|
1
|
Rate of packets that were dropped while trying to transmit on the uplink interface because the outbound queue was full.
|
meshRxSpeed
|
bits/sec
|
0
|
76800
|
Rate of data that has been received by the uplink network interface, measured in bits per second, averaged over a short element-specific time period.
|
meshRxReassemblyDrops
|
drops/sec
|
0
|
1
|
Rate of incoming packet fragments that were dropped because there was no space in the reassembly buffer.
|
meshRoutes
|
entries
|
0
|
1000
|
Number of entries that a given router has in its source-route table. This is a method to measure the number of elements in a given Private Area Network (PAN).
|
Metrics VPN Interfaces
Table 1-10 describes the metrics for the VPN interfaces.
Table 1-10 Metrics for VPN Interfaces
Metric Name
|
Unit
|
Min
|
Max
|
Description
|
txSpeed
|
bits/sec
|
0
|
76800
|
Current speed of data transmission over the interface, measured in bits per second, averaged over a short element-specific time period.
|
txDrops
|
drops/sec
|
0
|
1
|
Rate of packets that were dropped while trying to transmit on the interface because the outbound queue was full.
|
txSpeed
|
bits/sec
|
0
|
76800
|
Rate of data that has been received by the network interface, measured in bits per second, averaged over a short element-specific time period.
|
Metrics for 3G Interfaces
Table 1-11 describes the metrics for 3G interfaces.
Table 1-11 Metrics for 3G Interfaces
Metric Name
|
Unit
|
Min
|
Max
|
Description
|
txSpeed
|
bits/sec
|
0
|
76800
|
Current speed of data transmission over the interface, measured in bits per second, averaged over a short element-specific time period.
|
txDrops
|
drops/sec
|
0
|
1
|
Rate of packets that were dropped while trying to transmit on the interface because the outbound queue was full.
|
txSpeed
|
bits/sec
|
0
|
76800
|
Rate of data that has been received by the network interface, measured in bits per second, averaged over a short element-specific time period.
|
Metrics for WiMAX Interfaces
Table 1-12 describes the metrics for WiMAX interfaces.
Table 1-12 Metrics for WiMAX Module Interfaces
Metric Name
|
Unit
|
Min
|
Max
|
Description
|
txSpeed
|
bits/sec
|
0
|
76800
|
Current speed of data transmission over the interface, measured in bits per second, averaged over a short element-specific time period.
|
txDrops
|
drops/sec
|
0
|
1
|
Rate of packets that were dropped while trying to transmit on the interface because the outbound queue was full.
|
txSpeed
|
bits/sec
|
0
|
76800
|
Rate of data that has been received by the network interface, measured in bits per second, averaged over a short element-specific time period.
|
Metrics for WPAN Interfaces
Table 1-13 describes the metrics for the WPAN interfaces.
Table 1-13 Metrics for WPAN Interfaces
Metric Name
|
Unit
|
Min
|
Max
|
Description
|
txSpeed
|
bits/sec
|
0
|
76800
|
Current speed of data transmission over the interface, measured in bits per second, averaged over a short element-specific time period.
|
txDrops
|
drops/sec
|
0
|
1
|
Rate of packets that were dropped while trying to transmit on the interface because the outbound queue was full.
|
txSpeed
|
bits/sec
|
0
|
76800
|
Rate of data that has been received by the network interface, measured in bits per second, averaged over a short element-specific time period.
|
Metrics for Management Interfaces
Table 1-14 describes the metrics for management interfaces.
Table 1-14 Metrics for Management Interfaces
Metric Name
|
Unit
|
Min
|
Max
|
Description
|
txSpeed
|
bits/sec
|
0
|
76800
|
Current speed of data transmission over the interface, measured in bits per second, averaged over a short element-specific time period.
|
txDrops
|
drops/sec
|
0
|
1
|
Rate of packets that were dropped while trying to transmit on the interface because the outbound queue was full.
|
txSpeed
|
bits/sec
|
0
|
76800
|
Rate of data that has been received by the network interface, measured in bits per second, averaged over a short element-specific time period.
|
Metrics for Ethernet Interfaces
Table 1-15 describes the metrics for Ethernet interfaces.
Table 1-15 Metrics for Ethernet Interfaces
Metric Name
|
Unit
|
Min
|
Max
|
Description
|
txSpeed
|
bits/sec
|
0
|
76800
|
Current speed of data transmission over the interface, measured in bits per second, averaged over a short element-specific time period.
|
txDrops
|
drops/sec
|
0
|
1
|
Rate of packets that were dropped while trying to transmit on the interface because the outbound queue was full.
|
txSpeed
|
bits/sec
|
0
|
76800
|
Rate of data that has been received by the network interface, measured in bits per second, averaged over a short element-specific time period.
|
Metrics for Serial Interfaces
Table 1-16 describes the metrics for the serial interfaces.
Table 1-16 Metrics for Serial Interfaces
Metric Name
|
Unit
|
Min
|
Max
|
Description
|
txSpeed
|
bits/sec
|
0
|
76800
|
Current speed of data transmission over the interface, measured in bits per second, averaged over a short element-specific time period.
|
txDrops
|
drops/sec
|
0
|
1
|
Rate of packets that were dropped while trying to transmit on the interface because the outbound queue was full.
|
txSpeed
|
bits/sec
|
0
|
76800
|
Rate of data that has been received by the network interface, measured in bits per second, averaged over a short element-specific time period.
|
 Feedback