Feedback
Table Of Contents
Diagnostics for Video Endpoints
Features of the Troubleshooting Workflow
Features of the Troubleshooting Workflow for Sessions
Features of the Troubleshooting Workflow for Endpoints
Support Matrix for Troubleshooting Source and Destination Endpoints
Starting a Troubleshooting Workflow
Troubleshooting for an MSI-enabled Device
Analyzing Troubleshooting Data
Video IP Bit Rate and Packet Loss
Video Interarrival Jitter and Packet Loss
Exporting Troubleshooting Data
Understanding the Export Troubleshooting Report
Diagnostics for Video Endpoints
You must understand the Prime Collaboration discovery workflow before reviewing this section. For information on the device discovery process, see Discovering Devices.
During the troubleshooting workflow, the devices are polled, based on the values defined for the System Status Polling Interval, Interface Statistics Polling Interval, and Flow Statistics Polling Interval in the Device Monitoring Configuration page.
During the troubleshooting workflow, the endpoints and conference devices are polled every minute to check the status.
For Cisco 500, 1000, and 3000 Series TelePresence Systems, Cisco Unified IP Phone 8900 and 9900 Series, and Cisco Cius, the Prime Collaboration discovery ends after discovering the Layer 2 devices for an endpoint. That is, Prime Collaboration discovers the switches and first hop router to which an endpoint is connected.
The Layer 3 devices between the endpoints are discovered during the troubleshooting workflow. The newly discovered devices are added to the Prime Collaboration inventory. The network topology is discovered using CDP, and the links between devices are persisted in the Prime Collaboration database.
For Cisco C and Ex series TelePresence Systems, Cisco MXP series TelePresence System, Polycom, and Cisco Jabber, the Layer 3 devices between the endpoints are discovered during the troubleshooting workflow. The Layer 2 devices to which an endpoint is connected are not discovered during the Prime Collaboration discovery.
You can view details, such as CPU utilization, memory utilization, interface, and so forth for a network device. In addition to the system details, the fault information is also displayed for a device.
Note
The troubleshooting workflow impacts the Prime Collaboration system performance. Add a session or an endpoint to the watch list only if it is required.
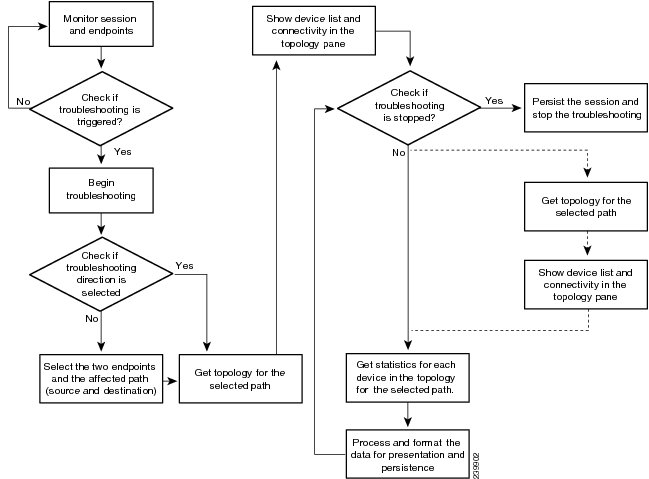
Figure 22-1 shows the flow diagram for the troubleshooting workflow for a session.
Figure 22-1 Prime Collaboration Troubleshooting Workflow for a Session
Features of the Troubleshooting Workflow
The following are the key features of the troubleshooting workflow:
•
–
–
–
Automatic troubleshooting is not triggered when the packet loss, jitter, or latency alarm occurs in a multipoint session.
–
See Starting a Troubleshooting Workflow for details on how to start a troubleshooting workflow for sessions and endpoints.
•
•
•
•
–
–
•
•
•
•
For Polycom endpoints, troubleshooting data is collected only when the first hop router is a Cisco device and it is in the Managed state. The router must be configured with read and write CLI access.
•
•
•
If this limit is exceeded, an error message is displayed in the troubleshooting log file.
Features of the Troubleshooting Workflow for Sessions
The following are the key behaviors of the troubleshooting workflow, when scheduled sessions are added to the watch list:
•
•
•
•
•
–
–
•
–
–
–
•
•
Features of the Troubleshooting Workflow for Endpoints
You can start a troubleshooting workflow only if the endpoints are in the Managed state. The following are the key behaviors of the troubleshooting workflow, when an endpoint is added to the watch list:
•
•
•
•
•
If CDP cannot be enabled on any of the devices, you can use Cisco Mediatrace to check whether the adjacent Layer 3 nodes on the media path are directly connected and what ingress and egress interfaces are used.
•
•
Support Matrix for Troubleshooting Source and Destination Endpoints
The following table shows the details of troubleshooting support between source and destination endpoints:
Traceroute Command
Endpoints with the traceroute or traceroute equivalent command enabled show the path or direction of troubleshooting. While most endpoints have this command enabled, few endpoints such as Cisco Jabber and Polycom do not support this.
For the endpoints that do not support the traceroute or traceroute equivalent command, the First Hop Router (FHR) is determined first. Pathtrace is performed from the first hop router to the destination endpoint. After this is complete, the source endpoint to the first hop router is stitched, and the complete path from source endpoint to destination endpoint is shown in the path topology. The first hop router information is available for endpoints such as Cisco Cius, IP Phones, and so on using the HTTP interface of the device.
For certain endpoints, such as the Cisco Jabber and Polycom, Prime Collaboration cannot get the First Hop Router information from the endpoint itself. For these endpoints, Prime Collaboration initiates the traceroute command from the linux virtual machine appliance to the source endpoint. The result of the traceroute command is processed and the last hop router before the endpoint in Prime Collaboration's traceroute is considered as first hop router for the endpoint.
Cisco Performance Monitor
Cisco Performance Monitor enables you to monitor the flow of packets in your network and become aware of any issues that might impact the flow before it starts to significantly impact the performance of the application. Performance monitoring is especially important for video traffic because high quality interactive video traffic is highly sensitive to network issues. Even minor issues that may not affect other applications can have dramatic effects on video quality.
You can verify whether the Cisco IOS Performance Monitor is configured on the device using Prime Collaboration Inventory.
SNMP access is required for performance monitoring (CLI access is not required).
Table 22-1 lists resources for additional information.
Table 22-1 Additional Information Resources
Cisco Medianet features
Cisco Enterprise Medianet home page
Specific Cisco Medianet features utilized by Collaboration Manager
Cisco IOS feature pages
Performance Monitor
Cisco Enterprise Medianet white papers
Starting a Troubleshooting Workflow
You can start the troubleshooting workflow for a session from the 360° Session View in the Session Monitoring page.
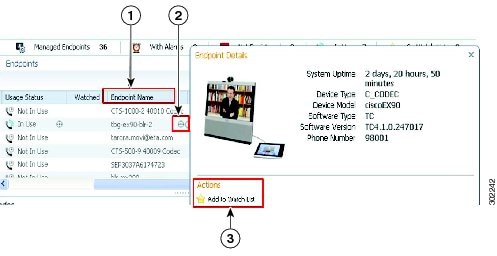
You can start the troubleshooting workflow for an endpoint from the quick view window (see Table 22-2) in the Endpoint Monitoring page.
Figure 22-2 Starting Troubleshooting from the Endpoint Monitoring Page
The Endpoint Name column
Rest your mouse pointer over the endpoint for which you want to start the troubleshooting and click the quick view icon.
Add to Watch List link.
Troubleshooting for an MSI-enabled Device
Cisco Mediatrace enables you to isolate and troubleshoot network degradation problems for data streams. When Mediatrace-capable devices are deployed in the network, Prime Collaboration provides network path visibility, down to the granularity of video flow statistics.
If an endpoint supports Media Services Interface (MSI) for Mediatrace, Prime Collaboration will use this interface to obtain Mediatrace information, discover media path, and collect statistics for the various midpoints.
If MSI is not enabled on an endpoint, Prime Collaboration will log into the endpoint, obtain 5 tuple information, and use that information to start Mediatrace from a nearby router or switch.
When you start troubleshooting from a MSI-enabled endpoint, Mediatrace will start from MSI-enabled endpoint itself (not from the nearest Medianet enabled router).
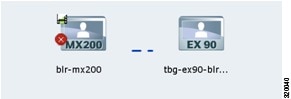
MSI-enabled endpoints are displayed with Medianet badge (see Figure 22-3) in the troubleshooting path topology.
Note
Figure 22-3 Troubleshooting for MSI-enabled Endpoint
Analyzing Troubleshooting Data
During the troubleshooting job, the path between the endpoints is discovered. After the path is discovered, the network device details are collected. The inventory is updated with the discovered network devices details.
After the troubleshooting job is completed the following data is displayed:
•
Troubleshooting
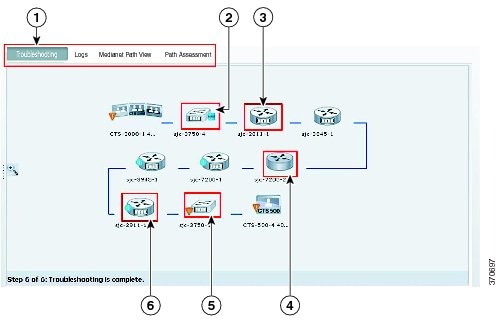
You can view the topology (Layer 2 and Layer 3) for the selected direction between endpoints in the Troubleshooting tab (see Figure 22-4).
•
•
Figure 22-4 Troubleshooting Result
If the devices are accessible, you can rest your mouse pointer over the device and click the quick view icon, to view the system, interface, and mediatrace flow details.
Note
Table 22-3 lists the system, interface, and flow details that are listed in the quick view.
Prime Collaboration inventory uses the DNS name (or the IP address if the DNS name is unavailable) for all devices. But the sysname is displayed for all midpoints in the troubleshooting path topology. The DNS name or IP address of the midpoint is displayed in the quick view.
During troubleshooting, if a device is inaccessible, the troubleshooting workflow skips that device. You must update the credentials, rediscover the device, and continue troubleshooting.
Logs
You can view the detailed troubleshooting workflow status using the Log tab. The log file contains the following information:
•
•
•
•
•
•
•
Medianet Path View
The Medianet Path View contains output from each mediatrace-enabled device. Prime Collaboration analyzes and shows hop and statistics information for Mediatrace sessions (video flows).
The following graphs are displayed in the Medianet Path View:
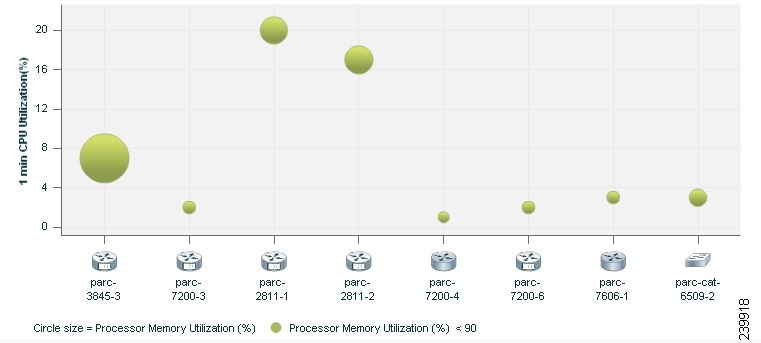
CPU and Memory
This graph is displayed for all devices and includes the following information (see Figure 22-5):
•
•
•
•
Figure 22-5 CPU and Memory Graph
Click on the sphere (red icon) to view the system, interface, and mediatrace flow details.
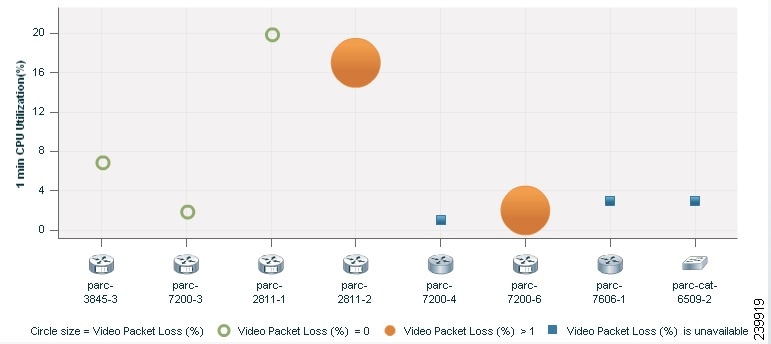
CPU and Packet Loss
This graph is displayed only for Cisco Mediatrace-configured devices. It displays the following information (see Figure 22-6):
•
•
•
–
–
You can click on the sphere to further analyze the packet loss at the interface-level.
–
Figure 22-6 CPU and Packet Loss Graph
Click on the sphere or square box (red icon) to view the system, interface, and mediatrace flow details.
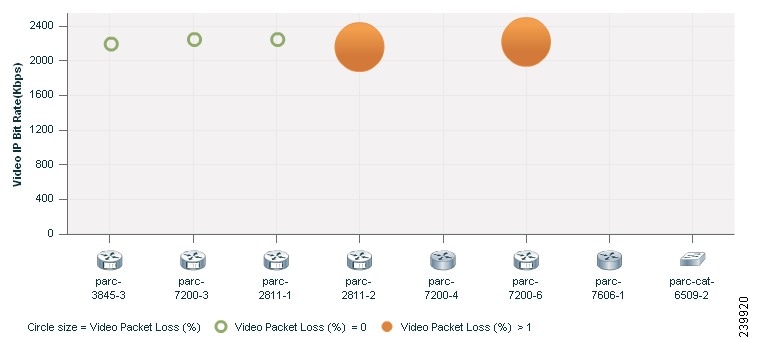
Video IP Bit Rate and Packet Loss
This graph is displayed only for Cisco Mediatrace-configured devices. It displays the following information (see Figure 22-7):
•
•
•
–
–
You can click on the sphere to further analyze the packet loss at the interface-level.
–
Figure 22-7 Video IP Bit Rate and Packet Loss Graph
Click on the sphere (red icon) to view the system, interface, and mediatrace flow details.
Video Interarrival Jitter and Packet Loss
This graph is displayed only for Cisco Mediatrace-configured devices. It displays the following information (see Figure 22-8):
•
•
•
–
–
–
Figure 22-8 Video Interarrival Jitter and Packet Loss Graph
Click on the sphere (red icon) to view the system, interface, and mediatrace flow details.
IP DSCP and Packet Loss
This graph is displayed only for Cisco Mediatrace-configured devices. It displays the following information:
•
•
•
–
–
–
Figure 22-9 IP DSCP and Packet Loss Graph
Click on the sphere (red icon) to view the system, interface, and mediatrace flow details.
Medianet Enabled Network
Medianet enhances visibility into the network to simplify and accelerate troubleshooting. In Prime Collaboration, the following are the key differences between a medianet-enabled network and a nonmedianet-enabled network.
Mediatrace Diagnostics
This information is displayed only if you have enabled Mediatrace on the device. See Cisco Mediatracefor further details. If the mediatrace statistics is not available, that is, mediatrace flow information does not appear in the quick view, Prime Collaboration supports application diagnostics to understand why it is not displayed.
You must click Run Diagnostics from the quick view, to see the root cause and recommendation.
Prime Collaboration checks the following:
•
•
•
•
•
•
•
•
Cisco Mediatrace 2.0 is not supported in this release. If you are using a device with an IOS image that supports Mediatrace 2.0, note the following points while you are troubleshooting using Cisco Mediatrace:
•
•
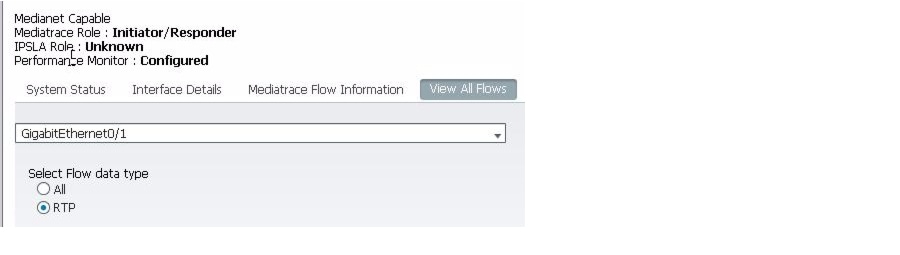
View All Flows
This information is displayed only if you have configured Cisco IOS Performance Monitor on the device.
To view the flow of the packets in your network:
Step 1
Ensure that the Performance Monitor field shows Configured (see Figure 22-10).
Step 2
Step 3
Step 4
Step 5
Figure 22-10 Performance Monitor Configured State
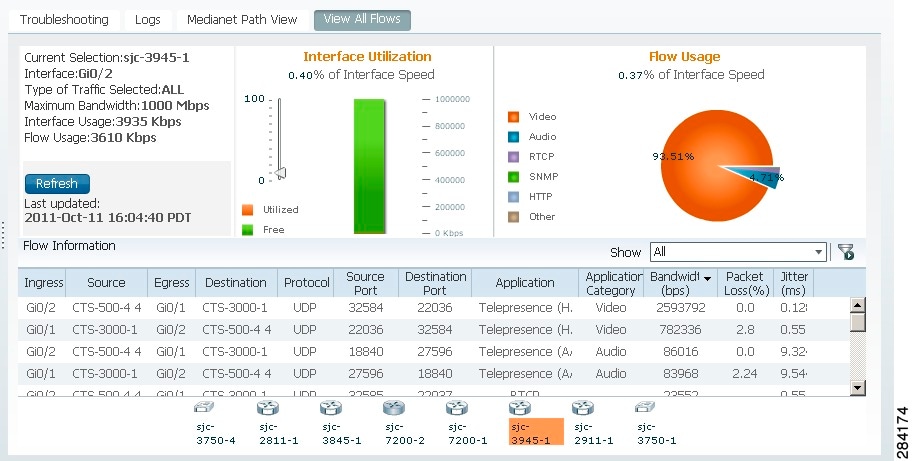
Figure 22-11 Performance Monitor
The interface that you have selected is displayed either as ingress or egress. Prime Collaboration displays all the flow details for the selected interface.
Table 22-4 Flow Details for the Interface
Current Selection
Selected device details.
Interface
Selected interface on the device.
Type of Traffic Selected
Whether the selected traffic is All or RTP.
Maximum Bandwidth
Maximum available bandwidth for the interface in Mbps.
Interface Usage / Interface Utilization Bar Chart
Utilization of the selected interface in Kbps.
Flow Usage / Flow Usage Pie Chart
This value is the sum of the bandwidth utilized by the individual flows for the selected interface (see Table 22-5).
Path Assessment
You can view the troubleshooting summary information for testable devices, nontestable device, mediatrace-enabled devices, devices with packet loss threshold violation, devices with jitter threshold violation, and devices with DSCP violation.
A set of tests are run for the devices determined during troubleshooting. To start the Path Assessment test, click Path Assessment Tests, after the troubleshooting is complete for the session.
Note
The following table lists the types of path assessment tests.
Test Result
Test result is displayed as follows:
If the test has failed (shown by
icon), click the quick view icon on the Result Field, to see the root cause and recommendation for the test.
You can select devices you are interested in, and click the arrow next to the IP address of the device to see the details of the test performed for the device.
To further troubleshoot a single device, rest your mouse pointer over the result column for the failed/unknown test result and click the quick view to see the root cause and recommendation. There is no quick view available for the passed tests.
Note
Exporting Troubleshooting Data
You can export the data only after the session ends. After the troubleshooting job is completed, the troubleshooting job status is displayed in the Session Monitoring page.
To export the troubleshooting data:
Step 1
Step 2
Step 3
Step 4
in the 360° Session view window.
Understanding the Export Troubleshooting Report
The export troubleshooting report contains the following details: