Feedback
Table Of Contents
Application Performance Analysis
WAAS Traffic
This chapter contains the following sections:
•
Application Performance Analysis
It describes how to collect information that will assist in WAAS planning and configuration, while you are in the process of deploying WAAS devices. For information about setting up WAN traffic, see Configuring WAAS Data Source in NAM, page 4-2.
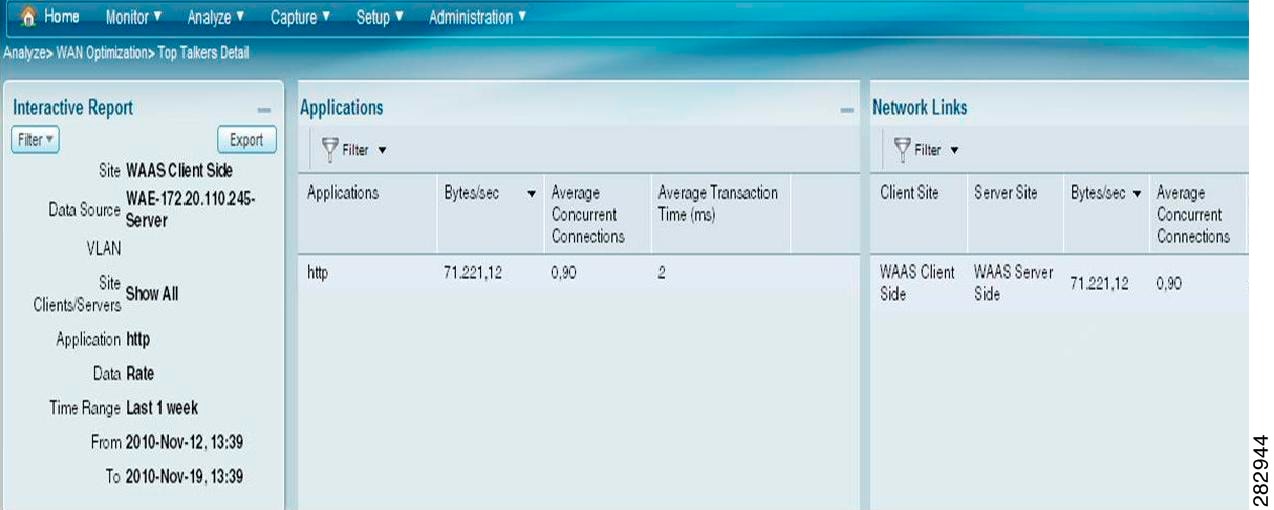
Top Talkers Detail
You can use the Top Talkers Detail window to analyze the WAAS traffic for optimization. This dashboard will show you the Top Applications, Top Network Links, Top Clients, and Top Servers. It will not be available for the NetFlow (NDE) data sources.
Note
When you go to Monitor > WAN Optimization > Top Talkers Detail, you will see the window that assists you in the predeployment process. Use the Interactive Report window to select the traffic you want to analyze for optimization. Based on the results, you can then configure the WAAS products to optimize your network.
Figure 5-1 shows an example of the Top Talker Detail Window.
Figure 5-1 Top Talker Detail Window
Application Performance Analysis
To analyze the WAAS traffic, go to Analyze > WAN Optimization > Application Performance Analysis.
Note
Following are the options available for the application performance analysis:
•
•
•
•
Transaction Time (Client Experience)
You can see the average client transaction time. One line represents pass-through traffic (in which optimization is turned off), and the second represents optimized traffic. After setting up optimization for a certain period, you can compare the two lines and see where the vertical drop in the chart occurs. The data is shown in milliseconds. For more details, see User Guide for Cisco Prime Network Analysis Module.
Traffic Volume and Compression Ratio
You can see the bandwidth reduction ratio between the number of bytes before compression and the number of bytes after compression. For more details, see User Guide for Cisco Prime Network Analysis Module.
Average Concurrent Connections (Optimized vs. Passthru)
You can see the number of concurrent connections during a specified time and can the data be used for capacity planning. For more details, see User Guide for Cisco Prime Network Analysis Module.
Multi-Segment Network Time (Client LAN - WAN - Server LAN)
You can see the network time between the multiple segments. The data is shown in milliseconds. For more details, see User Guide for Cisco Prime Network Analysis Module.
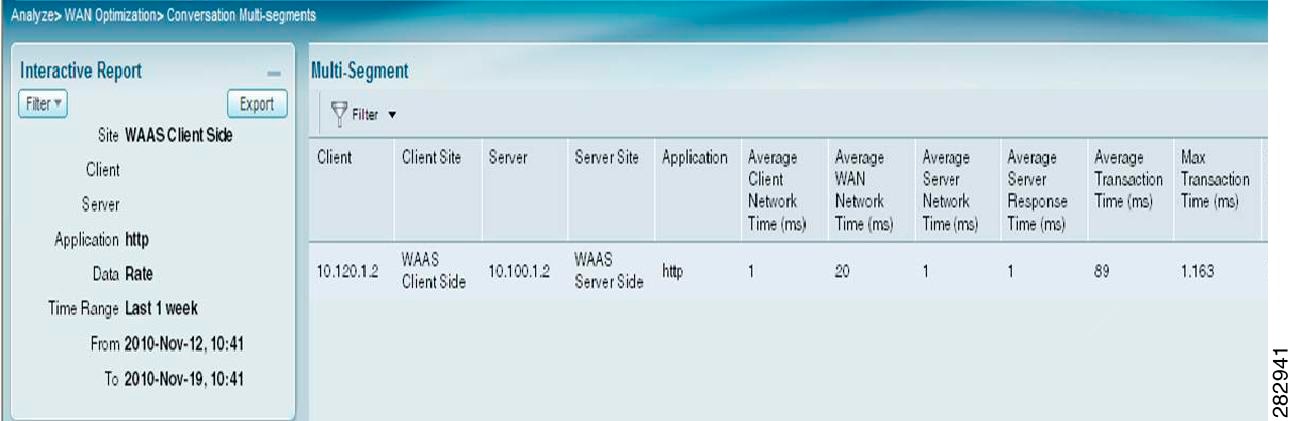
Conversation Multi-Segments
Use the Conversation Multiple Segments window, to monitor WAAS traffic. This window provides a correlation of data from different data sources, and allows you to view and compare response time metrics from multiple WAAS segments (data sources). You can access this window from Analyze > WAN Optimization > Conversation Multi-segments.
The Response Time Across Multiple Segments window shows response time metrics of the selected server or client-server pair from applicable data sources.
Figure 5-2 shows an example of the Conversation Multi-Segments window.
Figure 5-2 Conversation Multi-Segments
Passthru Information
The traffic which overflows and is beyond the capability of WAAS to handle is called the passthru information. This data will not be optimised by WAAS.
To obtain passthru information, follow these steps::
Step 1
Step 2
config t
no tfo optimize
Step 3
Figure 5-3 shows an example of the details of Response Time Distribution for the Passthru Data Source.
Figure 5-3 Response Time for Passthru Data Source