Downloads |
 Feedback Feedback
|
Table Of Contents
Using IPM to Measure Network Performance
Measuring Network Performance for DHCP
Measuring Network Performance for DLSw
Measuring Network Performance for DNS
Measuring Network Performance for HTTP
Measuring Network Performance for IP
Measuring End-to-End Performance for IP
Viewing End-to-End Statistics for IP
Measuring Hop-by-Hop Performance for IP
Defining an IP Path Echo Operation
Viewing Hop-by-Hop Statistics for IP
Measuring Network Performance for SNA
Defining an SNA Echo Operation
Measuring Network Performance for TCP
Measuring Network Performance for UDP
Measuring Network Performance for Voice Over IP
Defining an Enhanced UDP Operation
Viewing Statistics for Enhanced UDP
Using IPM to Measure Network Performance
This chapter provides details on using IPM to measure latency, jitter, availability, packet loss, and errors. It includes the following sections:
•
Measuring Network Performance for DHCP
•
•
•
•
•
•
•
•
Tips
Measuring Network Performance for DHCP
The DHCP operation measures the round-trip latency time taken to discover a DHCP server and obtain a lease from it. After obtaining an IP address, SA Agent releases the IP address that was leased by the server. By default, the DHCP operation sends discovery packets on every available IP interface on the source router. However, if a specific DHCP server is configured on the router, then discovery packets are sent to only that DHCP server. The DHCP operation also measures availability and errors for DHCP services.
To measure end-to-end performance for DHCP:
Step 1
Step 2
Step 3
Step 4
Step 5
Defining a DHCP Operation
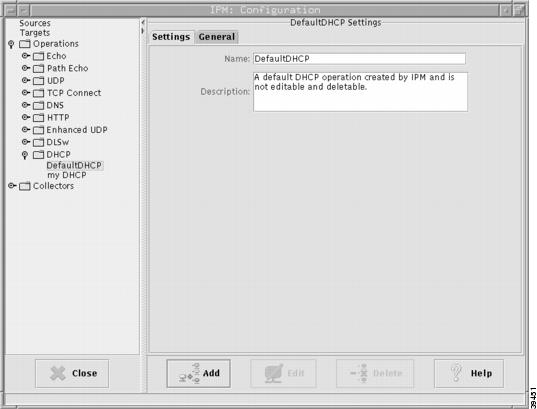
IPM provides a default DHCP operation for measuring performance in leasing an IP address from a DHCP server. In addition, IPM provides the option to create, modify, or delete your own DHCP operations from the DHCP Operation Configuration window.
To define a DHCP operation:
Step 1
Step 2
Step 3
Figure 3-1 DHCP Operation Configuration Window
Step 4
Step 5
Step 6
Step 7
For more detailed information about the options available from the DHCP Operation Configuration window, see the "DHCP Operation Configuration Window" topic in the online help.
Viewing Statistics for DHCP
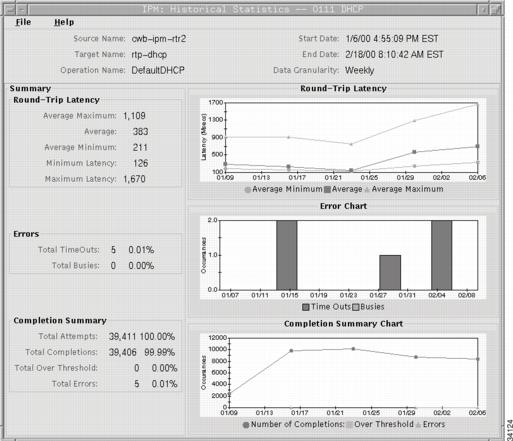
The DHCP Historical Statistics window displays statistical and graphical information gathered over the monitoring period for the selected DHCP collector.
To view end-to-end statistics for DHCP:
Step 1
Step 2
Figure 3-2 DHCP Historical Statistics Window
If you selected more than one collector, their statistics are displayed in a single graph in the Historical Statistics—Multi-Collector Graph window (see Figure 2-14 for an example).
For more detailed information about the statistics displayed in the DHCP Historical Statistics window, see the "DHCP Historical Statistics Window" topic in the online help.
Measuring Network Performance for DLSw
DLSw+ is the enhanced Cisco version of RFC 1795. DLSw+ tunnels SNA traffic over IP backbones via TCP. The routers performing the tunneling of SNA traffic onto TCP/IP are referred to as DLSw peers.
The DLSw operation measures the DLSw+ protocol stack and round-trip latency between DLSw peers. Normally DLSw peers communicate through TCP port 2065. A prerequisite to successfully running the DLSw operation is having a connected DLSw+ peer between the source and destination Cisco devices. On the source DLSw+ device, an operation can be defined for a DLSw+ partner peer. The peer, target router, does not have to be running version 12.1 or later of the Cisco IOS software. The DLSw operation also measures availability and errors for DLSw services.
Note
To measure end-to-end performance for DLSw:
Step 1
Step 2
Step 3
Step 4
Step 5
Step 6
Defining a DLSw Operation
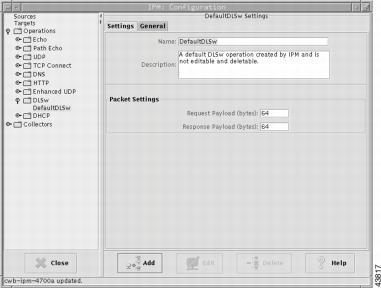
IPM provides a default DLSw operation for measuring performance between a source and target. In addition, IPM provides the option to create, modify, or delete your own DLSw operations from the DLSw Operation Configuration window.
To define a DLSw operation:
Step 1
Step 2
Step 3
Figure 3-3 DLSw Operation Configuration Window
Step 4
Step 5
Step 6
Step 7
Step 8
Step 9
For more detailed information about the options available from the DLSw Operation Configuration window, see the "DLSw Operation Configuration Window" topic in the online help.
Viewing Statistics for DLSw
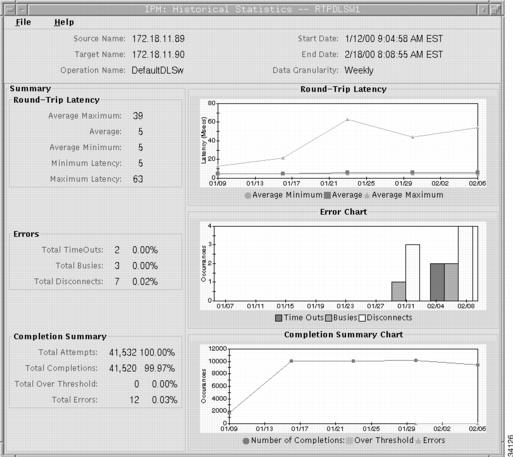
The DLSw Historical Statistics window displays statistical and graphical information gathered over the monitoring period for the selected DLSw collector.
To view end-to-end statistics for DLSw:
Step 1
Step 2
Figure 3-4 DLSw Historical Statistics Window
If you selected more than one collector, their statistics are displayed in a single graph in the Historical Statistics—Multi-Collector Graph window (see Figure 2-14 for an example).
For more detailed information about the statistics displayed in the DLSw Historical Statistics window, see the "DLSw Historical Statistics Window" topic in the online help.
Measuring Network Performance for DNS
DNS operation latency is computed by measuring the time between sending a DNS request and receiving a reply. The operation queries for an IP address if you specify a host name, or queries for a host name if you specify an IP address. The DNS operation also measures availability and errors for DNS services.
To measure end-to-end performance for DNS:
Step 1
Step 2
Step 3
Step 4
Step 5
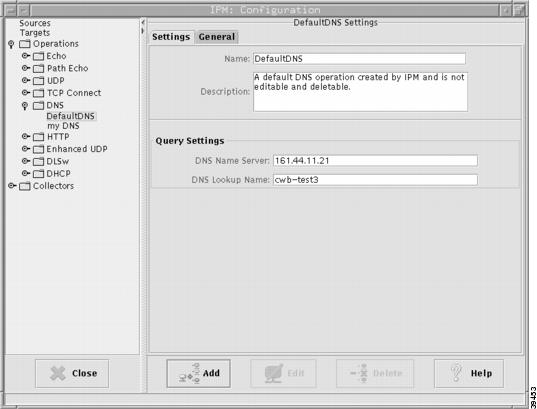
Defining a DNS Operation
IPM provides a default DNS operation for measuring performance between a source and a DNS server. In addition, IPM provides the option to create, modify, or delete your own DNS operations from the DNS Operation Configuration window.
To define a DNS operation:
Step 1
Step 2
Step 3
Figure 3-5 DNS Operation Configuration Window
Step 4
Step 5
Step 6
Step 7
Step 8
Step 9
For more detailed information about the options available from the DNS Operation Configuration window, see the "DNS Operation Configuration Window" topic in the online help.
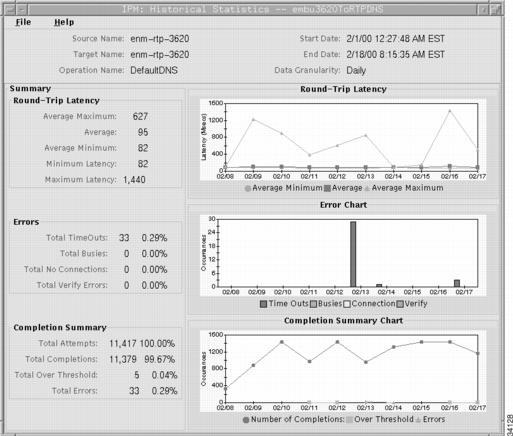
Viewing Statistics for DNS
The DNS Historical Statistics window displays statistical and graphical information gathered over the monitoring period for the selected DNS collector.
To view end-to-end statistics for DNS:
Step 1
Step 2
Figure 3-6 DNS Historical Statistics Window
If you selected more than one collector, their statistics are displayed in a single graph in the Historical Statistics—Multi-Collector Graph window (see Figure 2-14 for an example).
For more detailed information about the statistics displayed in the DNS Historical Statistics window, see the "DNS Historical Statistics Window" section in the online help.
Measuring Network Performance for HTTP
The HTTP operation measures the round-trip latency time required to connect to and access data from an HTTP server. Three HTTP server response time measurements are made:
•
•
•
The HTTP operation also measures availability and errors for HTTP services.
To measure end-to-end performance for HTTP:
Step 1
Step 2
Step 3
Step 4
Step 5
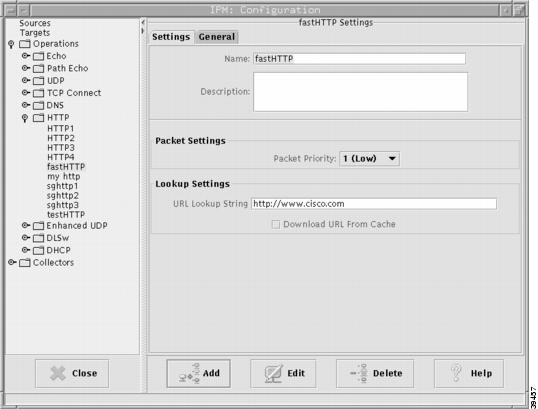
Defining an HTTP Operation
Use the HTTP Operation Configuration window to create, modify, or delete your own HTTP operations for measuring performance in connecting and accessing data from an HTTP server. IPM does not provide a default HTTP operation.
To define an HTTP operation:
Step 1
Step 2
Step 3
Figure 3-7 HTTP Operation Configuration Window
Step 4
Step 5
Step 6
Step 7
Step 8
Step 9
Step 10
For more detailed information about the options available from the HTTP Operation Configuration window, see the "HTTP Operation Configuration Window" topic in the online help.
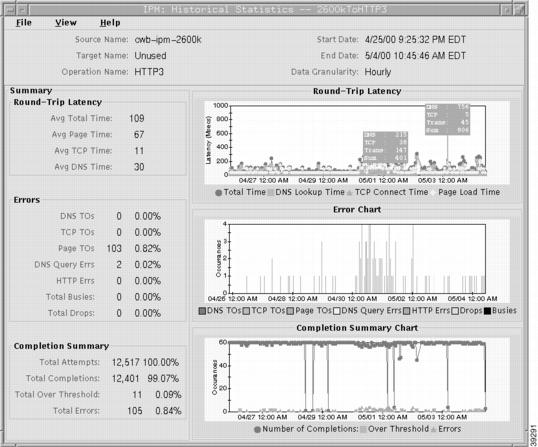
Viewing Statistics for HTTP
The HTTP Historical Statistics window displays statistical and graphical information gathered over the monitoring period for the selected HTTP collector.
To view end-to-end statistics for HTTP:
Step 1
Step 2
Figure 3-8 HTTP Historical Statistics Window
For more detailed information about the statistics displayed in the HTTP Historical Statistics window, see the "HTTP Historical Statistics Window" topic in the online help.
Measuring Network Performance for IP
In an IP network there are two types of measurements you can take:
•
See "Measuring End-to-End Performance for IP" section for more information.
•
See "Measuring Hop-by-Hop Performance for IP" section for more information.
Measuring End-to-End Performance for IP
IPM's Echo operations measure end-to-end performance between a Cisco router and any IP-enabled device. Latency is computed by measuring the time taken between sending an ICMP echo request message to the destination and receiving an ICMP echo reply. The IP Echo operation also measures availability and errors for IP services.
With an IP Echo operation, you can determine performance on a specific path by using Loose Source Routing. Additionally, IPM provides an option for measuring quality of service (QoS) between endpoints by setting the type of service (ToS) bits on the IP packet.
To measure end-to-end performance for IP:
Step 1
Step 2
Step 3
Step 4
Step 5
Step 6
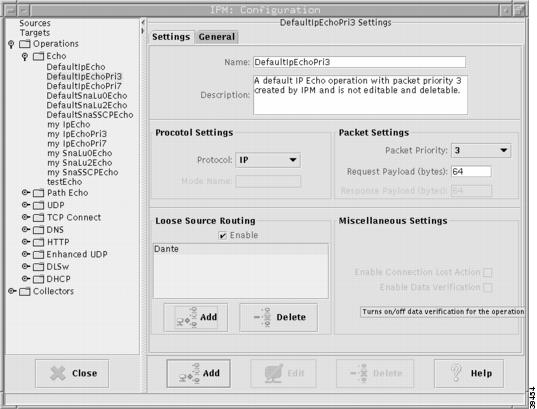
Defining an IP Echo Operation
IPM provides a default IP Echo operation for measuring performance between a source and target. In addition, IPM provides the option to create, modify, or delete your own IP Echo operations from the Echo Operation Configuration window.
To define an IP Echo operation:
Step 1
Step 2
Step 3
Figure 3-9 IP Echo Operation Configuration Window
Step 4
Step 5
Step 6
Step 7
Step 8
Step 9
Step 10
Step 11
For more detailed information about the options available from the Echo Operation Configuration window, see the "Echo Operation Configuration Window" topic in the online help.
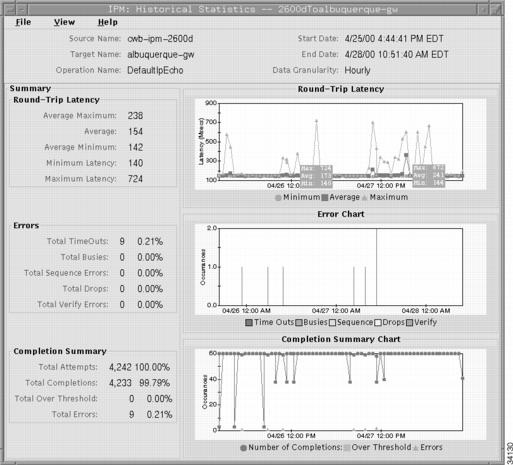
Viewing End-to-End Statistics for IP
The IP Echo Historical Statistics window displays statistical and graphical information gathered over the monitoring period for the selected Echo collector.
To view end-to-end statistics for IP:
Step 1
Step 2
Figure 3-10 IP Echo Historical Statistics Window
If you selected more than one collector, their statistics are displayed in a single graph in the Historical Statistics—Multi-Collector Graph window (see Figure 2-14 for an example).
For more detailed information about the statistics displayed in the Echo Historical Statistics window, see the "Echo Historical Statistics Window" topic in the online help.
Measuring Hop-by-Hop Performance for IP
IPM's IP Path Echo operation determines hop-by-hop performance between a Cisco router and any IP device on the network, by discovering the path. It uses traceroute and then measures performance between the source router and each intermittent hop in the path. If there are multiple equal cost routes between the source router and the target, the Path Echo operation can identify the correct path by using Loose Source Routing, if this option is enabled on the intermediate hop devices. This feature enables SA Agent to discover paths more accurately compared to a regular traceroute. The IP Path Echo operation also measures availability and errors for IP services.
To measure hop-by-hop performance for IP:
Step 1
Step 2
Step 3
Step 4
Step 5
Step 6
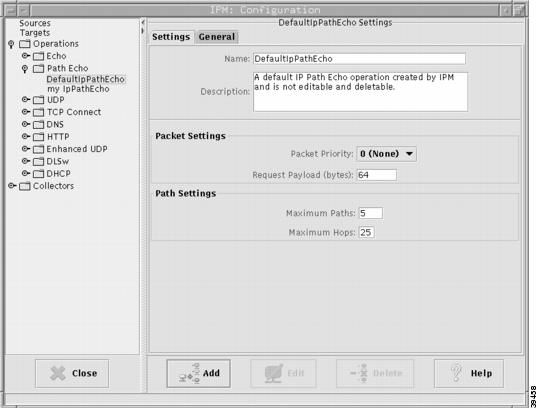
Defining an IP Path Echo Operation
IPM provides a default IP Path Echo operation for measuring performance between a source and target. In addition, IPM provides the option to create, modify, or delete your own IP Path Echo operations from the Path Echo Operation Configuration window.
To define an IP Path Echo operation:
Step 1
Step 2
Step 3
Figure 3-11 IP Path Echo Operation Configuration Window
Step 4
Step 5
Step 6
Step 7
Step 8
Step 9
Step 10
Step 11
Note
For more detailed information about the options available from the Path Echo Operation Configuration window, see the "Path Echo Operation Configuration Window" topic in the online help.
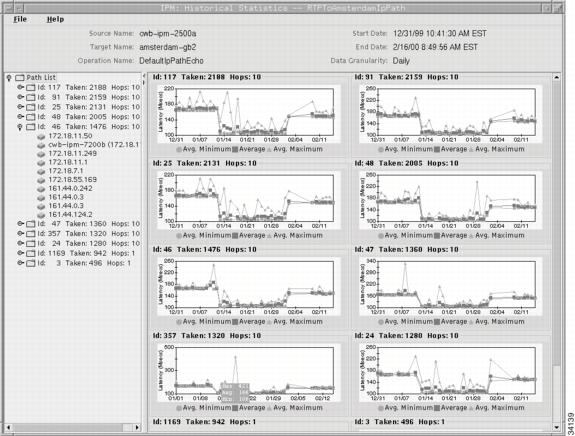
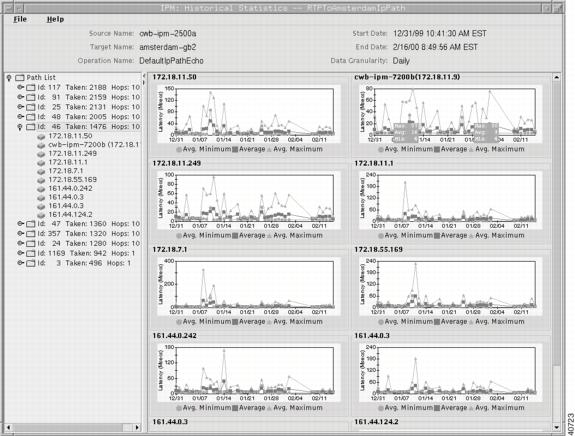
Viewing Hop-by-Hop Statistics for IP
The IP Path Echo Historical Statistics window displays statistical and graphical information gathered over the monitoring period for the selected Path Echo collector.
To view hop-by-hop statistics for IP:
Step 1
Step 2
Figure 3-12 IP Path Echo Historical Statistics Window—All Paths
By default, IPM displays graphs for all paths in the path list. To view the list of hops for a single path, and their graphs, click on the path folder. The Path Echo Historical Statistics window for all hops in a single path (Figure 3-13) is displayed.
Figure 3-13 IP Path Echo Historical Statistics Window—All Hops in a Path
To view the graphs for a specific hop, click on the hop. The Path Echo Historical Statistics window for a single hop (Figure 3-14) is displayed.
Figure 3-14 IP Path Echo Historical Statistics Window—One Hop
Step 3
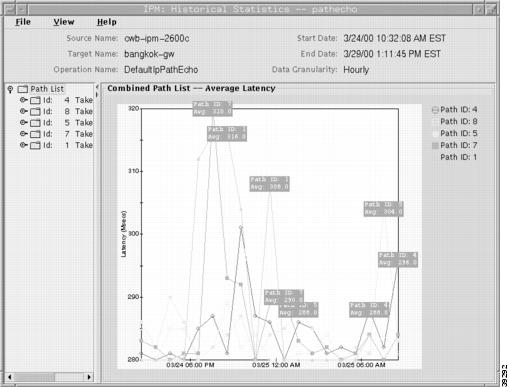
Figure 3-15 shows a sample Combined Path List window.
Figure 3-15 IP Path Echo Combined Path List Window
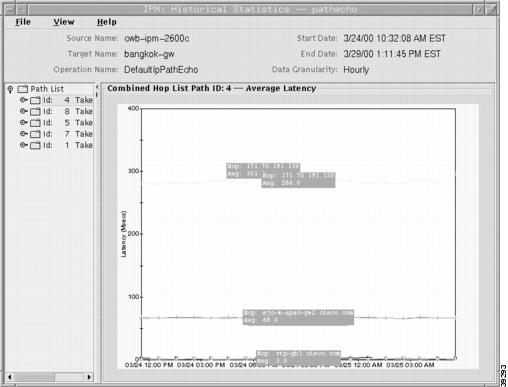
Figure 3-16 shows a sample Combined Hop List window.
Figure 3-16 IP Path Echo Combined Hop List Window
It is easier to compare different paths and hops when viewing combined statistics.
To return to separate graphs for each path or hop, select View > Show Separate.
For more detailed information about the statistics displayed in the Path Echo Historical Statistics window, see the "Path Echo Historical Statistics Window" topic in the online help.
Measuring Network Performance for SNA
For SNA environments, IPM allows you to measure the round-trip latency to an MVS mainframe using the following types of SNA sessions:
•
•
•
Because SNA is a connection-oriented protocol, the only type of measurement you can request is Echo.
When measuring latency to an SNA mainframe, IPM measures round-trip latency between a source router and an echo response program running on an SNA mainframe. You can install NSPECHO, a program provided by IPM, on an MVS mainframe to provide the echo back to the router. You can customize both the request and response payload sizes to model traffic flow for various applications. The SNA operations also measure availability and errors for SNA services.
To measure end-to-end performance for SNA:
Step 1
Step 2
Step 3
Step 4
Step 5
Step 6
Defining an SNA Echo Operation
The SNA Echo Operation Configuration window allows you to create, modify, or delete an SNA Echo operation.
To define an SNA Echo operation:
Step 1
Step 2
Step 3
Step 4
Step 5
Step 6
•
•
•
Step 7
Step 8
Step 9
Step 10
Step 11
Step 12
For more detailed information about the options available from the Echo Operation Configuration window, see the "Echo Operation Configuration Window" topic in the online help.
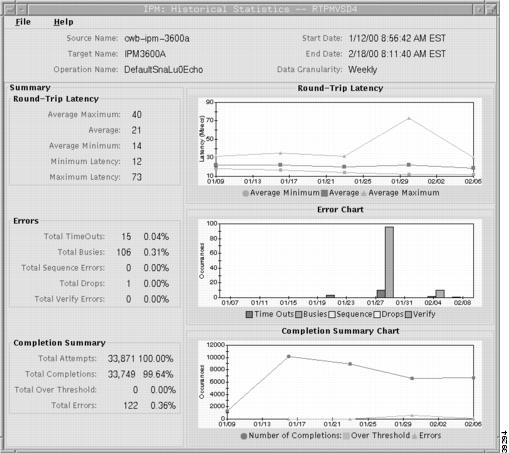
Viewing Statistics for SNA
The SNA Echo Historical Statistics window displays statistical and graphical information gathered over the monitoring period for the selected Echo collector.
To view end-to-end statistics for SNA:
Step 1
Step 2
Figure 3-17 SNA Echo Historical Statistics Window
If you selected more than one collector, their statistics are displayed in a single graph in the Historical Statistics—Multi-Collector Graph window (see Figure 2-14 for an example).
For more detailed information about the statistics displayed in the Echo Historical Statistics window, see the "Echo Historical Statistics Window" topic in the online help.
Measuring Network Performance for TCP
IPM's TCP Connect operation measures round-trip latency between a Cisco router and any IP-enabled device running TCP services. Latency is computed by measuring the time taken by the source to perform a TCP connect operation to the target device. This operation is useful for simulating Telnet or HTTP connection times. The TCP operation also measures availability and errors for TCP services.
You can specify any port number, well known or otherwise, on any IP host, Cisco or non-Cisco, as long as someone is listening on that port on the target. A well known port is a port number less than or equal to 1024 (for example, 21 for FTP, 23 for Telnet, and 80 for HTTP). IPM provides default TCP Connection operations for several of these common TCP services.
To measure end-to-end latency for TCP:
Step 1
Step 2
Step 3
Step 4
Step 5
Step 6
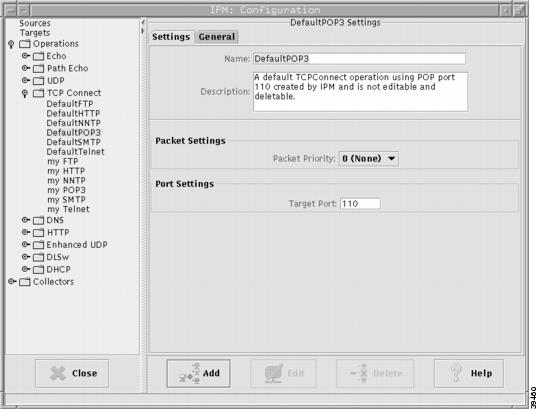
Defining a TCP Operation
IPM provides several default TCP operations for measuring performance between a source and target. In addition, IPM provides the option to create, modify, or delete your own TCP operations from the TCP Operation Configuration window.
To define a TCP operation:
Step 1
Step 2
Step 3
Figure 3-18 TCP Operation Configuration Window
Step 4
Step 5
Step 6
Step 7
You can specify any port number, well known or otherwise, on any IP host, Cisco or non-Cisco, as long as someone is listening on that port on the target.
If this target uses the SA Agent, make sure you configured it as a Cisco SAA Responder target on the Target Configuration window. If you mistakenly configured it as an IP target, and you specify a Target Port that is not well known (that is if you specify a port number greater than 1024), IPM considers the target an IP device rather than an SA Agent device and does not enable the SA Agent Control protocol. As a result, the collector cannot connect to the target and no data is collected.
Step 8
Step 9
For more detailed information about the options available from the TCP Operation Configuration window, see the "TCP Operation Configuration Window" topic in the online help.
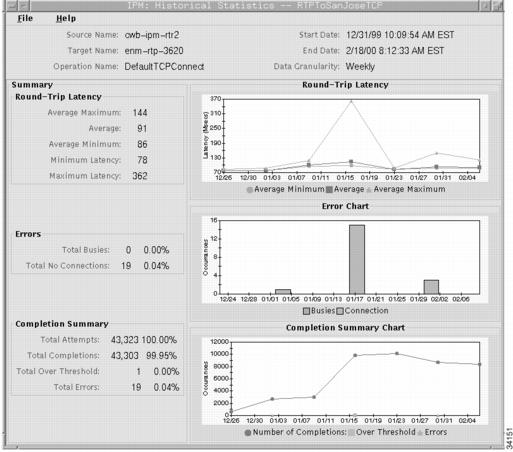
Viewing Statistics for TCP
The TCP Historical Statistics window displays statistical and graphical information gathered over the monitoring period for the selected TCP collector.
To view end-to-end statistics for TCP:
Step 1
Step 2
Figure 3-19 TCP Historical Statistics Window
If you selected more than one collector, their statistics are displayed in a single graph in the Historical Statistics—Multi-Collector Graph window (see Figure 2-14 for an example).
For more detailed information about the statistics displayed in the TCP Historical Statistics window, see the "TCP Historical Statistics Window" topic in the online help.
Measuring Network Performance for UDP
IPM's UDP operation measures round-trip latency between a Cisco router and any IP-enabled device running UDP services. Latency is computed by measuring the time taken to send a datagram and receive a response from the target device. The UDP operation also measures availability and errors for UDP services.
To measure end-to-end performance for UDP:
Step 1
Step 2
Step 3
Step 4
Step 5
Step 6
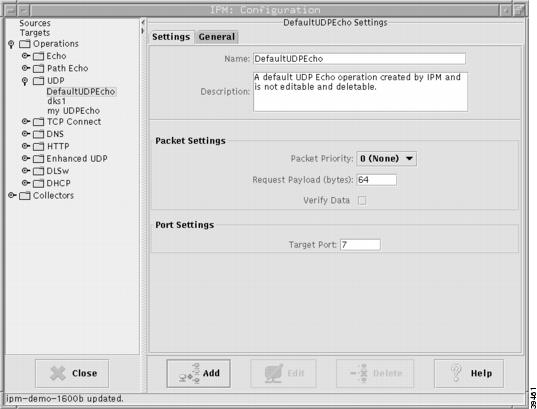
Defining a UDP Operation
IPM provides a default UDP operation for measuring performance between a source and target. In addition, IPM provides the option to create, modify, or delete your own UDP operations from the UDP Operation Configuration window.
To define a UDP operation:
Step 1
Step 2
Step 3
Figure 3-20 UDP Operation Configuration Window
Step 4
Step 5
Step 6
Step 7
Step 8
Step 9
•
•
Step 10
Step 11
For more detailed information about the options available from the UDP Operation Configuration window, see the "UDP Operation Configuration Window" topic in the online help.
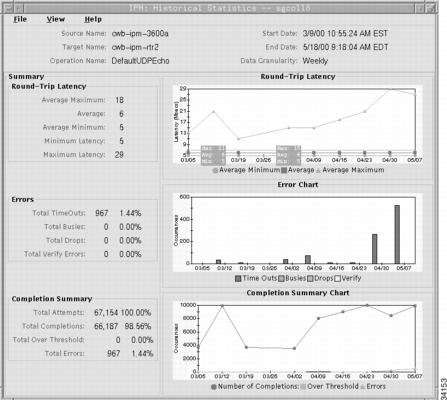
Viewing Statistics for UDP
The UDP Historical Statistics window displays statistical and graphical information gathered over the monitoring period for the selected UDP collector.
To view end-to-end statistics for UDP:
Step 1
Step 2
Figure 3-21 UDP Historical Statistics Window
If you selected more than one collector, their statistics are displayed in a single graph in the Historical Statistics—Multi-Collector Graph window (see Figure 2-14 for an example).
For more detailed information about the statistics displayed in the UDP Historical Statistics window, see the "UDP Historical Statistics Window" topic in the online help.
Measuring Network Performance for Voice Over IP
The Enhanced UDP operation for Voice over IP measures round-trip latency, packet loss, and jitter in IP networks by generating synthetic UDP traffic. The Enhanced UDP operation sends a defined number of packets of a defined size from the source router to a target router with a defined interpacket delay. Both the source router and the target must be running version 12.1 or later of the Cisco IOS software, and the SA Agent Responder must be enabled on the target. To enable the SA Agent Responder on the target, use the rtr responder IOS configuration command. The packets sent out to measure jitter contain packet sequence information, as well as sending and receiving timestamps from the source and the Responder.
The Enhanced UDP operation measures the following network performance statistics:
•
•
•
•
To measure end-to-end performance for Enhanced UDP:
Step 1
Step 2
Step 3
Step 4
Step 5
Step 6
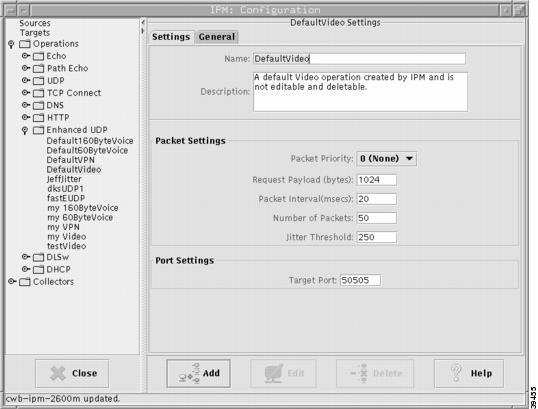
Defining an Enhanced UDP Operation
IPM provides several default Enhanced UDP operations for measuring performance between a source and target. In addition, IPM provides the option to create, modify, or delete your own Enhanced UDP operations from the Enhanced UDP Operation Configuration window.
To define an Enhanced UDP operation:
Step 1
Step 2
Step 3
Figure 3-22 Enhanced UDP Operation Configuration Window
Step 4
Step 5
Step 6
Step 7
•
•
•
Step 8
Step 9
Step 10
Step 11
Step 12
Step 13
For more detailed information about the options available from the Enhanced UDP Operation Configuration window, see the "Enhanced UDP Operation Configuration Window" topic in the online help.
Setting the Baseline
You can increase, by a specified percentage (the baseline), the latency threshold for all statistical collectors in Running state that have collected at least one hour of data. Editing the baseline does not affect monitored collectors.
Note
To edit the baseline:
Step 1
Figure 3-23 Edit Baseline Window
Step 2
For example, if the current average latency is 100 milliseconds and you specify a baseline of 50, the new latency threshold is 150 milliseconds (50% above the current average latency).
Step 3
On IPM servers with a large number of collectors, the IPM client can seem unresponsive while the baseline is being updated. This is due to the high volume of messages being received by the client during this time.
IPM does not automatically refresh open statistics windows to reflect the new baseline. To display the new baseline, close the statistics window and open it again.
For more detailed information about the Edit Baseline window, see the "Edit Baseline Window" topic in the online help.
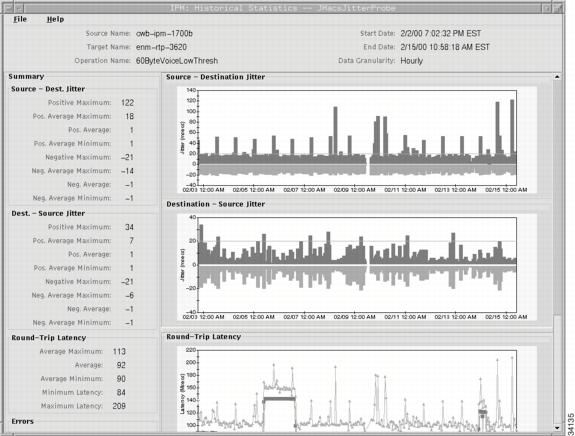
Viewing Statistics for Enhanced UDP
The Enhanced UDP Historical Statistics window displays statistical and graphical information gathered over the monitoring period for the selected Enhanced UDP collector.
To view statistics for Enhanced UDP:
Step 1
Step 2
Figure 3-24 Enhanced UDP Historical Statistics Window—Part 1
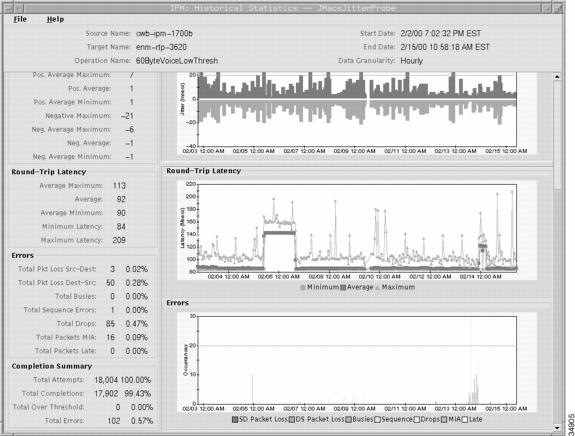
Figure 3-25 Enhanced UDP Historical Statistics Window—Part 2
For more detailed information about the statistics displayed in the Enhanced UDP Historical Statistics window, see the "Enhanced UDP Historical Statistics Window" topic in the online help.