Downloads |
 Feedback Feedback
|
Table Of Contents
Running Simultaneous IPM Sessions
Configuring the IPM Components
Viewing Response Time Data in Real Time
Viewing Response Time Statistics
Getting Started with IPM
The chapter provides information on starting the IPM application and configuring a collector to gather response time data. It includes the following major sections:
•
Running Simultaneous IPM Sessions
•
Starting IPM
Because the IPM application is comprised of a server component and a client component, you must start both components to run the application. If you have installed the IPM server and client on the same workstation, then you can start the IPM database server, IPM server, and IPM client using a single command. You can also start the IPM client server and client separately.
To start the IPM server, database server, and client, enter the following commands:
# cd /opt/CSCOipm/bin# ./ipmTo start just the IPM server and database, enter the following commands:
# cd /opt/CSCOipm/bin# ./ipm startTo start just the IPM client on a Solaris workstation, enter the following commands:
# cd /opt/CSCOipm/bin# ./ipm start clientIf you installed the IPM client on a different Solaris workstation from the IPM server, you must issue the ipm start command from the /opt/CSCOipmClient/bin directory. To start the IPM client on a different Solaris workstation from the IPM server, enter the following commands:
# cd /opt/CSCOipmClient/bin# ./ipm start clientTo start the IPM client on a Windows NT workstation, follow these steps:
Step 1
Step 2
Step 3
Tips
When the IPM client starts, it displays the IPM Main window ().
Figure 2-1 IPM Main Window
When you start IPM for the first time, the IPM Main window contains no collectors. As you configure collectors, they are displayed in this window. Each collector is a combination of a configured source, a target, and an operation. For each collector, you specify parameters for gathering statistics, generating event notifications, and scheduling.
Running Simultaneous IPM Sessions
IPM software release 2.0 uses a client/server architecture that allows you to run multiple sessions of the IPM client simultaneously. This release provides central services and database functions on an IPM server that communicates to multiple IPM clients. You can install the IPM client software on the same workstation as the IPM server or on a workstation that is on the same network as the IPM server.
Configuring the IPM Components
To collect response-time data using IPM, you must define a collector in a source router. A collector is a definition of a source router, a target device, an operation, and a collector schedule.
To monitor response time data with IPM, you must complete the following tasks:
•
Define a Source Router
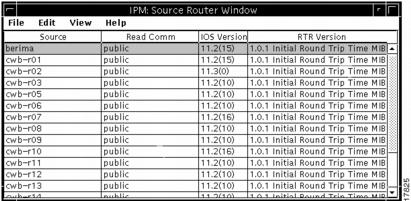
IPM source routers are the routers from which packets are sent to measure and store response-time data. Each source router must contain the Cisco IOS software RTR feature.
To define a new source router, follow these steps:
Step 1
Step 2
Figure 2-2 Source Router Window
Step 3
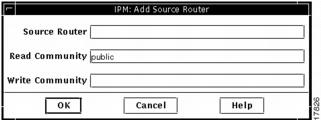
Figure 2-3 Add Source Router Window
Step 4
Step 5
Step 6
Step 7
Note
For information on using a seed file to add source routers to IPM, see the "Adding Source Routers Using a Seed File" section in the "" chapter. For information on modifying or deleting source routers, see the "Working with Source Routers" section in the "" chapter.
Define a Target
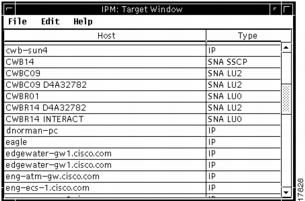
IPM targets are destination devices for which you want to gather response-time data. A target can be an SNA host or any IP-addressable device.
To define a device as a target, follow these steps:
Step 1
Figure 2-4 Target Window
Step 2
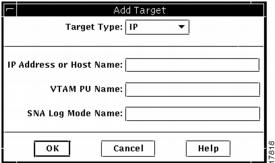
Figure 2-5 Add Target Window
Step 3
•
•
•
•
Step 4
Step 5
Step 6
The SNA host uses this name to find the log mode table entry that defines session parameters. If you omit this name, the SNMP agent in the source router sends a name of all blanks to the SNA host, which then uses a set of default session parameters for the echo session.
Step 7
Note
For information on using a seed file to add targets to IPM, see the "Adding Targets Using a Seed File" section in the "" chapter. For information on modifying or deleting targets, see the "Working with Target Devices" section in the "" chapter.
Select a Predefined Operation
When you install IPM, a group of predefined operations are provided. Use one of these operations when you define a collector. You can also define one or more new operations to fit your needs. For information on defining a new operation, see the "Adding a New Operation" section in the "" chapter.
The predefined operations are described in .
For information on defining, modifying, or deleting operations, see the "Working with Operations" section in the "" chapter.
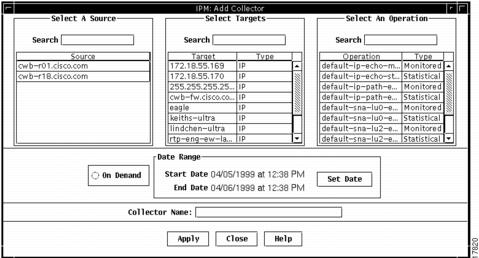
Define a Collector
Defining a collector involves selecting a source router, a target, an operation, and a collector schedule.
Note
To define a new collector, follow these steps:
Step 1
Figure 2-6 Add Collector Window
Step 2
Step 3
Step 4
Step 5
Step 6
•
•
Step 7
•
•
Step 8
For information on using a seed file to add collectors to IPM, see the "Adding Collectors Using a Seed File" section in the "" chapter. For information on viewing or deleting collectors, see the "Working with Collectors" section in the "" chapter.
Viewing IPM Results
As your collectors begin to collect response time information and the information is stored in the IPM database, you are able to view the resulting statistical data. You view the response-time results from any of the collectors listed on the IPM Main window and see whether or not that collector is active or inactive.
IPM provides two methods for reviewing response-time data:
•
•
Viewing Response Time Data in Real Time
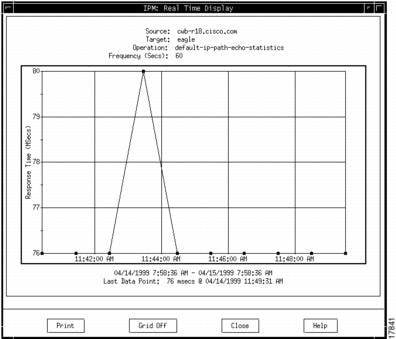
The Real Time Display window allows you to view response time data for an active collector as the data is being collected. This data is only displayed in real time, it is not stored in the IPM database.
To view response-time data in real time, follow these steps:
Step 1
Step 2
Figure 2-7 Real Time Display Window
Response-time data is displayed as soon as the frequency interval elapses. Data points will be added to the graph for each interval that the response time is measured for the selected collector.
Viewing Response Time Statistics
To view response time statistics, follow these steps:
Step 1
Step 2
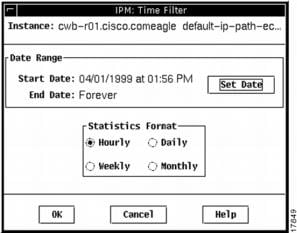
Figure 2-8 Time Filter Window
In this window, you select the starting and ending time for the statistics that you want to view. These times relate to when the statistics are gathered by the collector, not when you want to view them. When this window is displayed, it already contains the starting and ending times for the collector, so you can press Enter to view statistics for that time period.
Step 3
You can specify the Start Time in one of these ways:
•
•
You can enter a starting time earlier than the time when the selected collector started gathering statistics, but the displayed statistics start when the collector starts. For example, if you enter a starting time of 10/24/96:12:00:00, but the collector started collecting data at 10/24/96:13:00:00, the displayed statistics will begin with data starting at 10/24/96:13:00:00.
Step 4
You can specify the end time in one of the following ways:
•
•
Step 5
Step 6
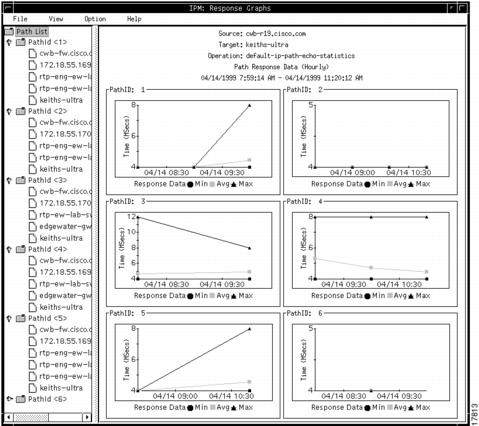
Step 7
Figure 2-9 Response Graphs Window
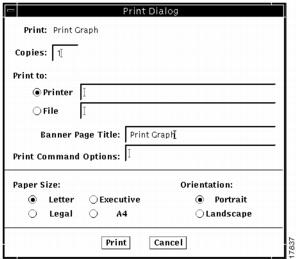
Printing IPM Data
You can print the data for each of the graphs in the Response Graphs window.
To print the data of an a IPM graph, follow these steps:
Step 1
Figure 2-10 Print Dialog Window
Step 2
•
•
•
•
Step 3
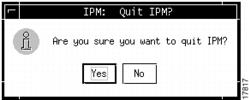
Exiting the IPM Client
When you have finished configuring collectors or viewing response-time statistics, exit the IPM client by completing the following steps:
Step 1
Figure 2-11 Confirmation Window for Exiting IPM
Step 2
Note