在FMC管理的FTD上使用IP SLA配置ECMP
下載選項
無偏見用語
本產品的文件集力求使用無偏見用語。針對本文件集的目的,無偏見係定義為未根據年齡、身心障礙、性別、種族身分、民族身分、性別傾向、社會經濟地位及交織性表示歧視的用語。由於本產品軟體使用者介面中硬式編碼的語言、根據 RFP 文件使用的語言,或引用第三方產品的語言,因此本文件中可能會出現例外狀況。深入瞭解思科如何使用包容性用語。
關於此翻譯
思科已使用電腦和人工技術翻譯本文件,讓全世界的使用者能夠以自己的語言理解支援內容。請注意,即使是最佳機器翻譯,也不如專業譯者翻譯的內容準確。Cisco Systems, Inc. 對這些翻譯的準確度概不負責,並建議一律查看原始英文文件(提供連結)。
簡介
本檔案介紹如何在由FMC管理的FTD上設定ECMP以及IP SLA。
必要條件
需求
思科建議您瞭解以下主題:
- 思科安全防火牆威脅防禦(FTD)上的ECMP配置
- 思科安全防火牆威脅防禦(FTD)上的IP SLA配置
- 思科安全防火牆管理中心(FMC)
採用元件
本檔案中的資訊是根據以下軟體和硬體版本:
-
Cisco FTD版本7.4.1
-
Cisco FMC版本7.4.1
本文中的資訊是根據特定實驗室環境內的裝置所建立。文中使用到的所有裝置皆從已清除(預設)的組態來啟動。如果您的網路運作中,請確保您瞭解任何指令可能造成的影響。
背景資訊
本檔案介紹如何在由Cisco FMC管理的思科FTD上設定等價多重路徑(ECMP)和網際網路通訊協定服務層級協定(IP SLA)。ECMP允許您在FTD上將介面組合在一起,並在多個介面上負載平衡流量。IP SLA是一種機制,可透過交換定期封包來監控端對端連線。IP SLA可以與ECMP一起實施,以確保下一跳的可用性。在本示例中,ECMP用於通過兩個Internet服務提供商(ISP)電路平均分配資料包。同時,IP SLA會跟蹤連線情況,確保在發生故障時無縫過渡至任何可用電路。
本文檔的具體要求包括:
- 使用具有管理員許可權的使用者帳戶訪問裝置
- 思科安全防火牆威脅防禦7.1版或更高版本
- Cisco Secure Firewall Management Center 7.1或更高版本
設定
網路圖表
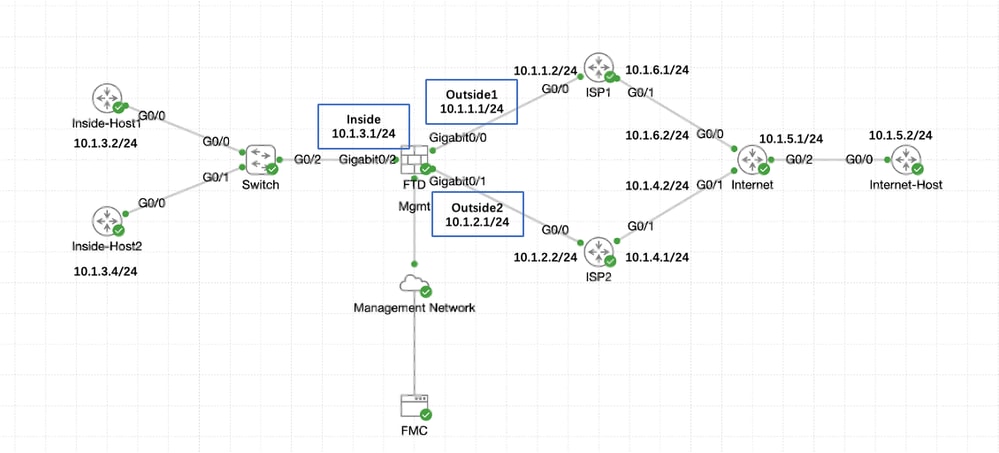
在本範例中,Cisco FTD有兩個外部介面:outside1和outside2。每個連線至ISP網關,outside1和outside2屬於名為outside的同一ECMP區域。
來自內部網路的流量會透過FTD路由,並透過兩個ISP取得網際網路的負載平衡。
同時,FTD使用IP SLA來監控與每個ISP閘道的連線。在任何ISP電路發生故障時,FTD會故障切換到另一個ISP網關,以保持業務連續性。
 網路圖表
網路圖表
組態
步驟0.預配置介面/網路對象
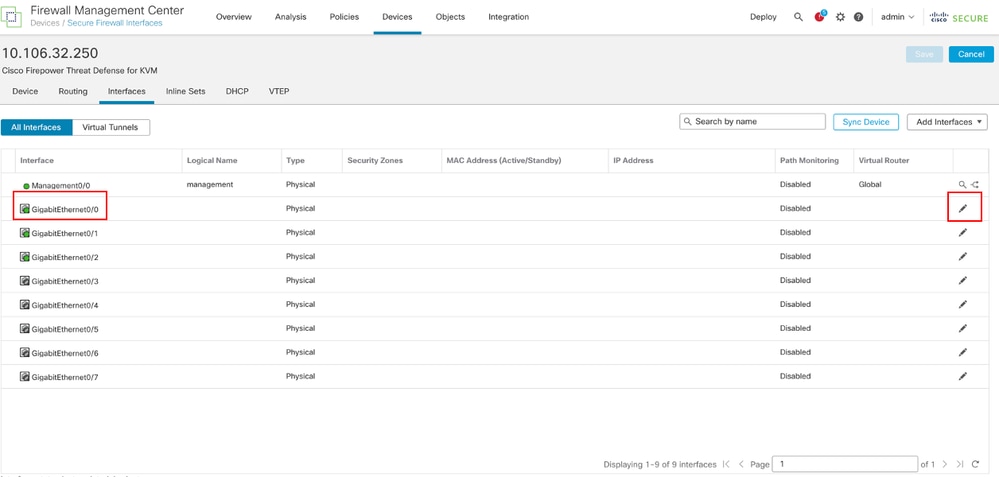
登入FMC Web GUI,選擇Devices>Device Management,然後按一下threat defense裝置的Edit按鈕。預設情況下會選擇Interfaces頁。按一下要編輯的介面的Edit按鈕(在本例中為GigabitEthernet0/0)。
 編輯介面Gi0/0
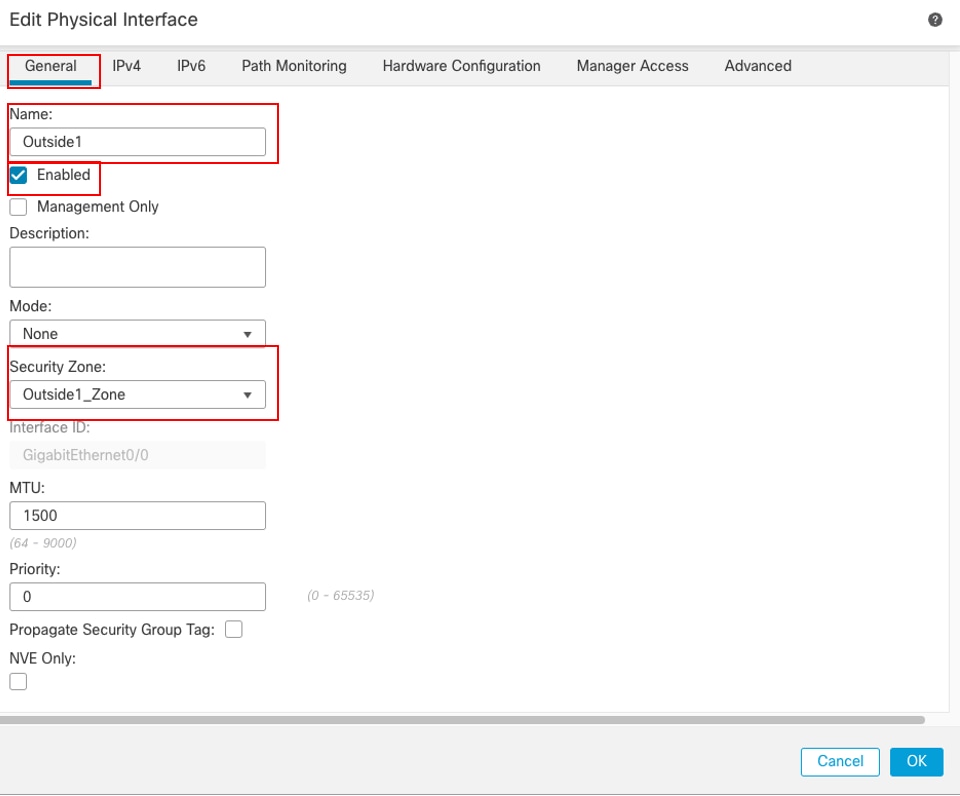
在Edit Physical Interface視窗的General頁籤下:
- 設定Name,本例中為Outside1。
- 選中Enabled覈取方塊以啟用介面。
- 在「Security Zone」下拉選單中,選擇一個現有的安全區域或建立一個新的安全區域,在本例中為Outside1_Zone。
 介面Gi0/0常規
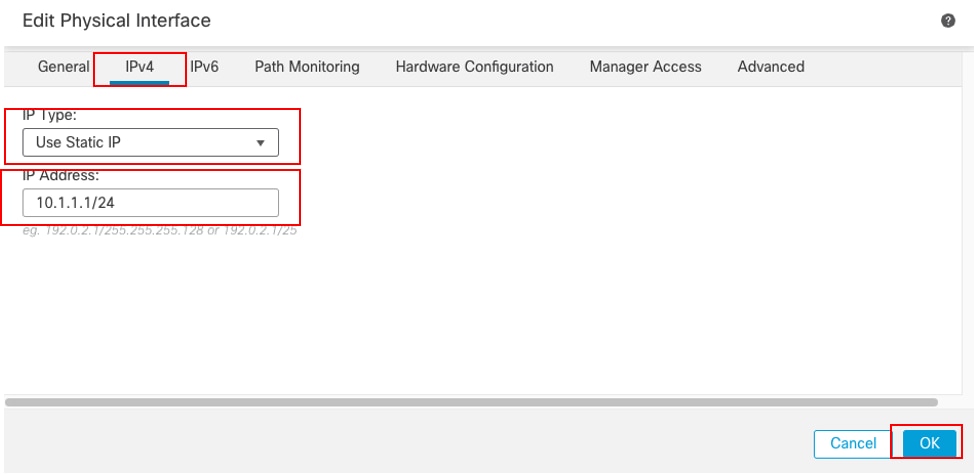
在IPv4頁籤下:
- 從IP Type下拉式清單中選擇其中一個選項,在本範例中,為Use Static IP。
- 設定IP位址,在本範例中為10.1.1.1/24。
- 按一下「OK」(確定)。
 介面Gi0/0 IPv4
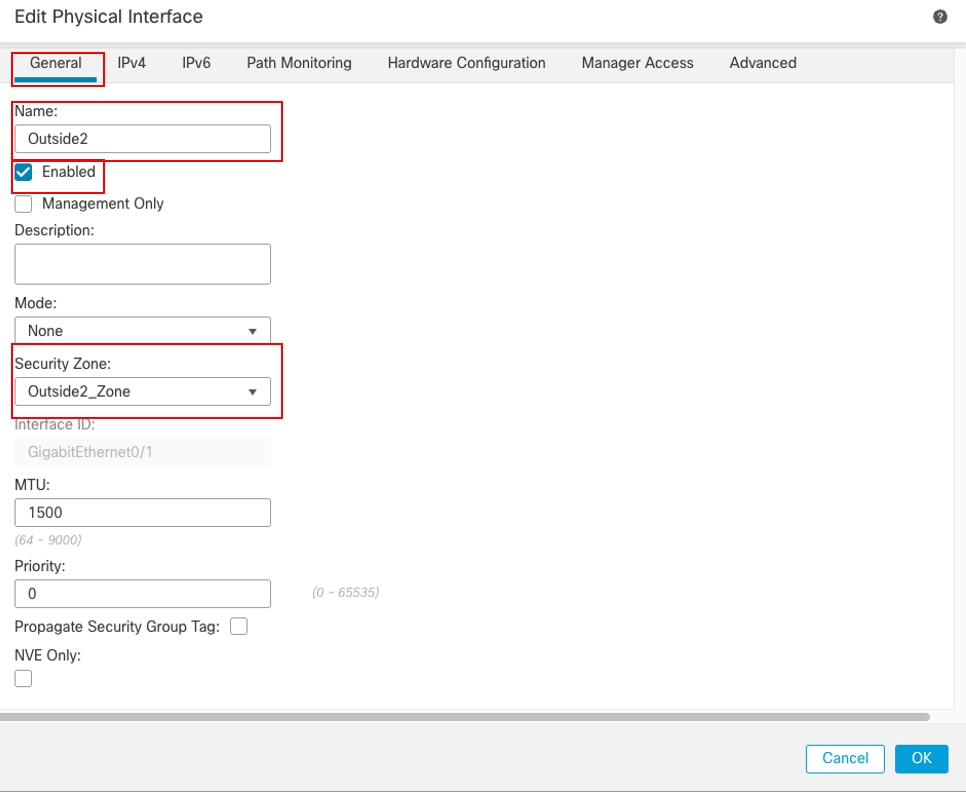
在Edit Physical Interface視窗的General頁籤下重複類似步驟配置介面GigabitEthernet0/1:
- 設定Name,本例中為Outside2。
- 選中Enabled覈取方塊以啟用介面。
- 在「Security Zone」下拉選單中,選擇一個現有的安全區域或建立一個新的安全區域,在本例中為Outside2_Zone。
 介面Gi0/1常規
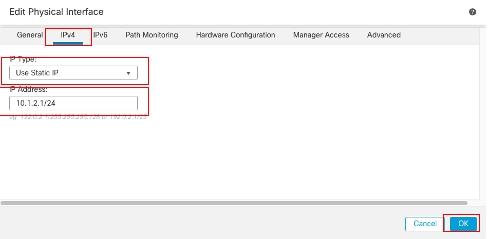
在IPv4頁籤下:
- 從IP Type下拉式清單中選擇其中一個選項,在本範例中,為Use Static IP。
- 設定IP位址,在本範例中為10.1.2.1/24。
- 按一下「OK」(確定)。
 介面Gi0/1 IPv4
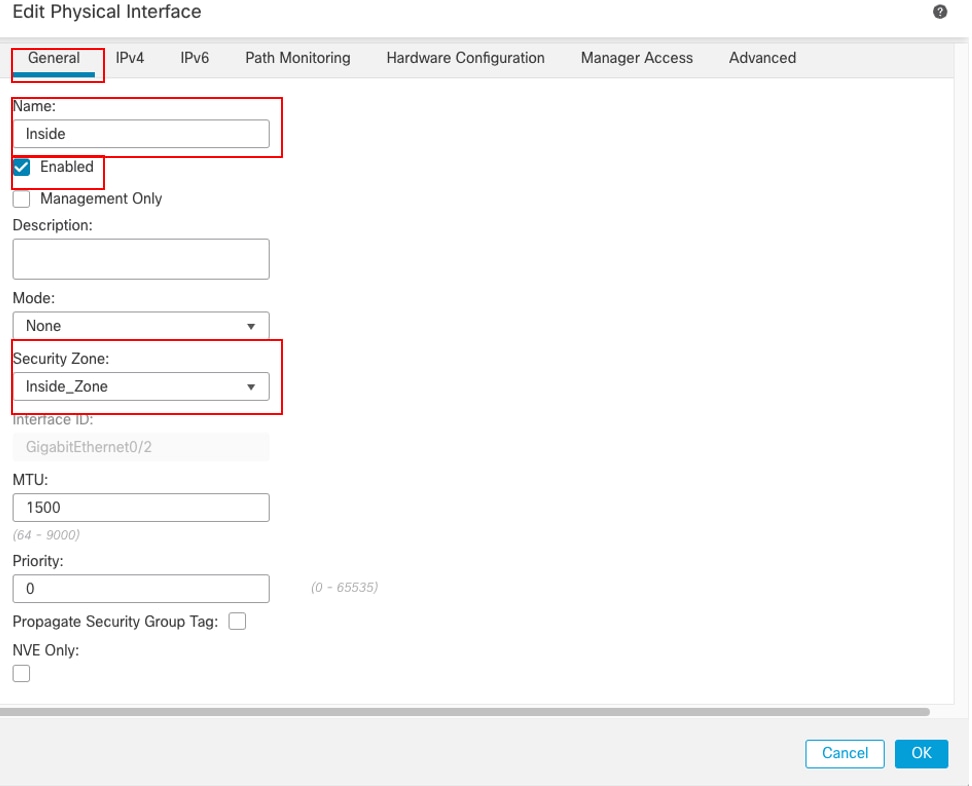
在Edit Physical Interface視窗的General頁籤下重複類似步驟配置介面GigabitEthernet0/2:
- 設定Name,本例中為Inside。
- 選中Enabled覈取方塊以啟用介面。
- 在「Security Zone」下拉選單中,選擇一個現有的安全區域或建立一個新的安全區域,在本例中為Inside_Zone。
 介面Gi0/2常規
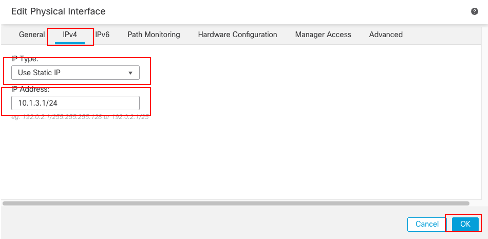
在IPv4頁籤下:
- 從IP Type下拉式清單中選擇其中一個選項,在本範例中,為Use Static IP。
- 設定IP位址,在本範例中為10.1.3.1/24。
- 按一下「OK」(確定)。
 介面Gi0/2 IPv4
按一下「Save」和「Deploy」組態。
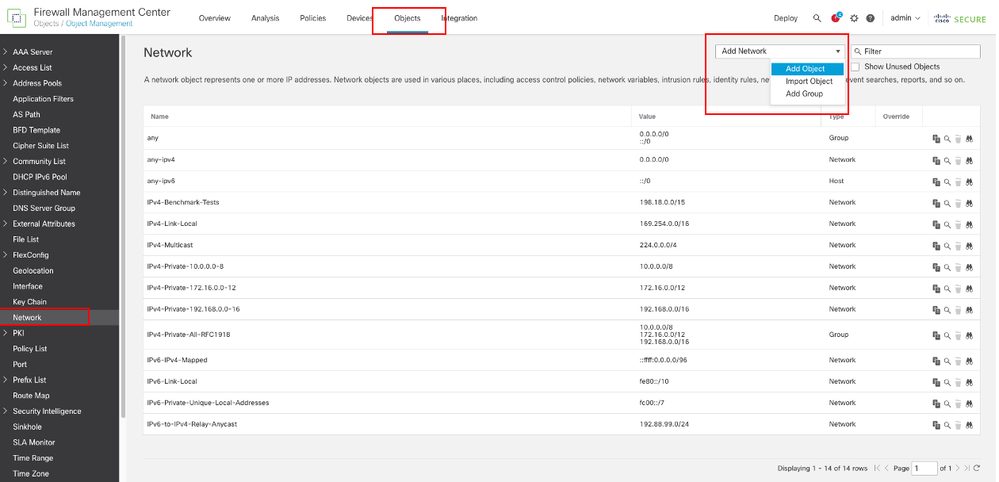
導航到Objects > Object Management,從對象型別清單中選擇Network,從Add Network下拉選單中選擇Add Object,為第一個ISP網關建立對象。
 網路對象
網路對象
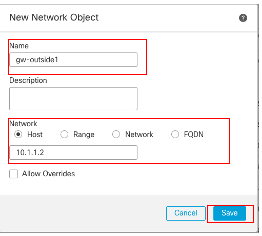
在New Network Object視窗中:
- 設定Name,在本例中為gw-outside1。
- 在「Network」欄位中,選擇所需的選項,並輸入適當的值,在本範例中為Host和10.1.1.2。
- 按一下「Save」。
 對象Gw-outside1
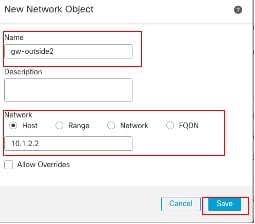
重複類似步驟,為第二個ISP網關建立另一個對象。在New Network Object視窗中:
- 設定Name,在本例中為gw-outside2。
- 在「Network」欄位中,選擇所需的選項,並輸入適當的值,在本範例中為Host和10.1.2.2。
- 按一下「Save」。
 對象Gw-outside2
步驟1.配置ECMP區域
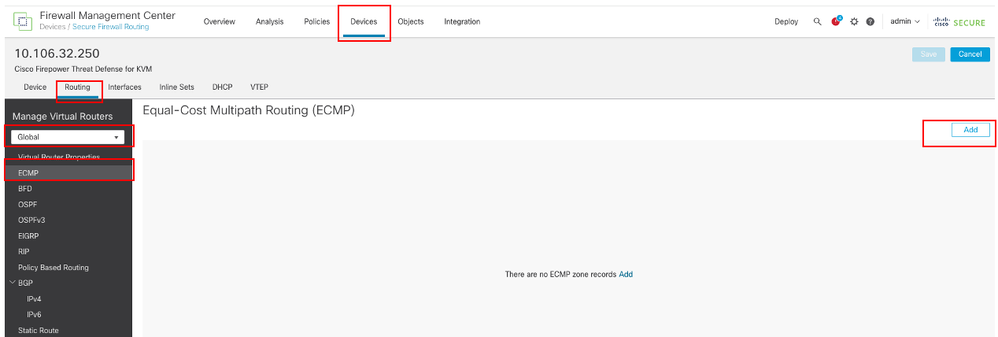
導覽至Devices > Device Management,然後編輯威脅防禦裝置,然後按一下Routing。從virtual router下拉選單中,選擇要在其中建立ECMP區域的虛擬路由器。您可以在全域性虛擬路由器和使用者定義的虛擬路由器中建立ECMP區域。在本例中,選擇Global。
按一下ECMP,然後按一下Add。
 配置ECMP區域
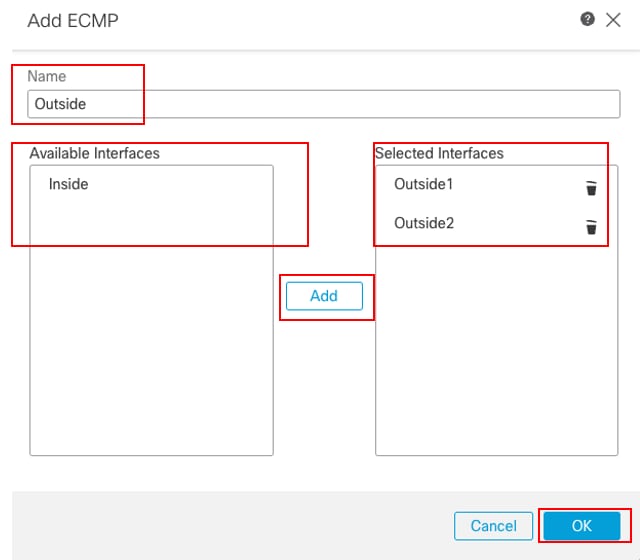
在Add ECMP視窗中:
- 設定ECMP區域的名稱,在本例中為Outside。
- 要關聯介面,請在Available Interfaces框中選擇介面,然後按一下Add。在本例中, Outside1和Outside2。
- 按一下「OK」(確定)。
 在外部配置ECMP區域
按一下「Save」和「Deploy」組態。
步驟2.配置IP SLA對象
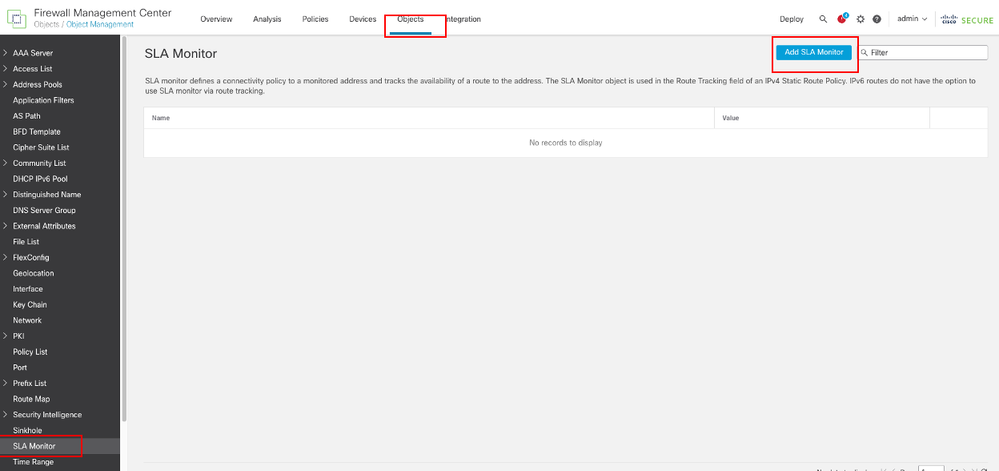
導航到Objects > Object Management,從對象型別清單中選擇SLA Monitor,按一下Add SLA Monitor為第一個ISP網關新增新的SLA監視器。
 建立SLA監控器
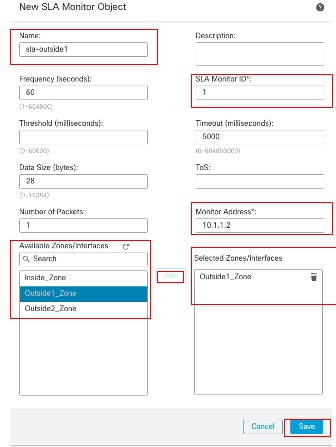
在「新建SLA監控對象」窗口中:
- 設定SLA監控器對象的Name,本例中為sla-outside1。
- 在SLA Monitor ID欄位中輸入SLA操作的ID號。值範圍為1到2147483647。您最多可以在裝置上建立2000個SLA操作。每個ID號對策略和裝置配置必須是唯一的。在此範例1中。
- 在Monitored Address欄位中輸入由SLA操作監控的IP地址。在本例中為10.1.1.2。
- Available Zones/Interfaces清單顯示區域和介面組。在Zones/Interfaces清單中,新增包含裝置通過哪些介面與管理站進行通訊的區域或介面組。要指定單個介面,您需要為該介面建立一個區域或介面組。在本例中,Outside1_Zone。
- 按一下「Save」。
 SLA對象Sla-outside1
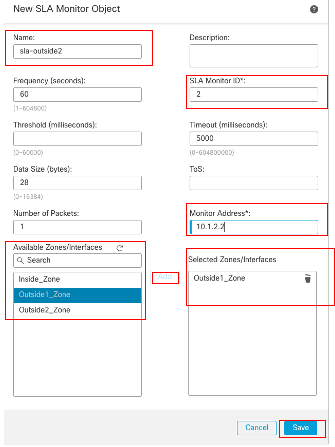
重複類似步驟,為第二個ISP網關建立另一個SLA監控器。
在「新建SLA監控對象」窗口中:
- 設定SLA監控器對象的Name,本例中為sla-outside2。
- 在SLA Monitor ID欄位中輸入SLA操作的ID號。值範圍為1到2147483647。您最多可以在裝置上建立2000個SLA操作。每個ID號對策略和裝置配置必須是唯一的。在本範例2中。
- 在Monitored Address欄位中輸入由SLA操作監控的IP地址。在本例中為10.1.2.2。
- Available Zones/Interfaces清單顯示區域和介面組。在Zones/Interfaces清單中,新增包含裝置通過哪些介面與管理站進行通訊的區域或介面組。要指定單個介面,您需要為該介面建立一個區域或介面組。在本例中,Outside2_Zone。
- 按一下「Save」。
 SLA對象Sla-outside2
步驟3.使用路由跟蹤配置靜態路由
導覽至Devices > Device Management,然後編輯威脅防禦裝置,按一下Routing,從virtual routers下拉選單中,選擇為其配置靜態路由的虛擬路由器。在本例中, Global。
選擇Static Route,按一下Add Route,將預設路由新增到第一個ISP網關。
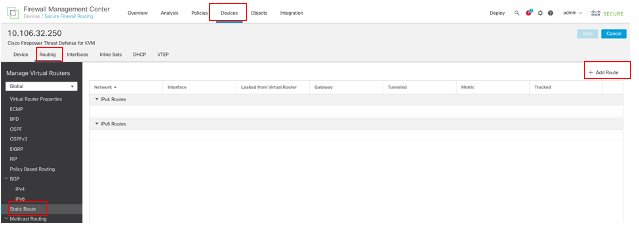 配置靜態路由
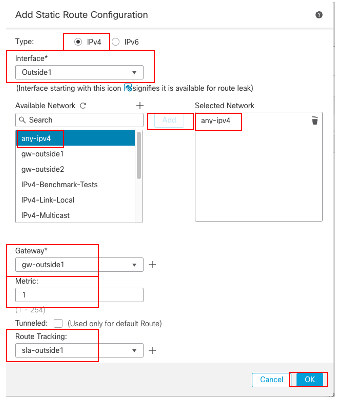
在Add Static Route Configuration視窗中:
- 根據所新增的靜態路由型別,按一下IPv4或IPv6。在本例中IPv4。
- 選擇應用此靜態路由的介面。在本例中, Outside1。
- 在「Available Network」清單中,選擇目標網路。在本例中any-ipv4。
- 在「Gateway or IPv6 Gateway」欄位中,輸入或選擇作為此路由的下一跳的網關路由器。可以提供IP地址或網路/主機對象。在本例中,gw-outside1。
- 在Metric欄位中,輸入到達目的地網路的跳數。有效值範圍為1到255;預設值為1。在本範例1中。
- 要監控路由可用性,請在Route Tracking欄位中輸入或選擇定義監控策略的SLA監控對象的名稱。在本例中,sla-outside1。
- 按一下「OK」(確定)。
 新增靜態路由第一個ISP
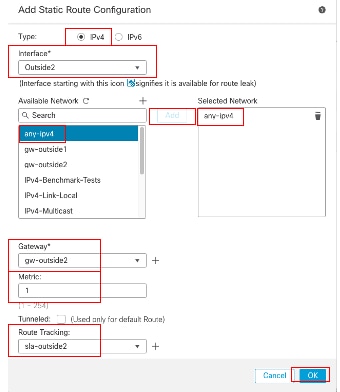
重複類似步驟,將預設路由新增到第二個ISP網關。在Add Static Route Configuration視窗中:
- 根據要新增的靜態路由的型別,按一下IPv4或IPv6。在本例中IPv4。
- 選擇應用此靜態路由的介面。在本例中,Outside2。
- 在「Available Network」清單中,選擇目標網路。在本例中any-ipv4。
- 在「Gateway or IPv6 Gateway」欄位中,輸入或選擇作為此路由的下一跳的網關路由器。可以提供IP地址或網路/主機對象。在本例中,gw-outside2。
- 在Metric欄位中,輸入到達目的地網路的跳數。有效值範圍為1到255;預設值為1。請確保指定與第一個路由相同的度量,在本例中為1。
- 要監控路由可用性,請在Route Tracking欄位中輸入或選擇定義監控策略的SLA監控對象的名稱。在本例中,sla-outside2。
- 按一下「OK」(確定)。
 新增靜態路由第二個ISP
按一下「Save」和「Deploy」組態。
驗證
登入FTD的CLI,執行命令以檢查ECMP流量區域的資訊,包括每個區域部分的介show zone 面。
> show zone
Zone: Outside ecmp
Security-level: 0
Zone member(s): 2
Outside2 GigabitEthernet0/1
Outside1 GigabitEthernet0/0
運行命令show running-config route,檢查路由配置的運行配置,在這種情況下,有兩條具有路由跟蹤的靜態路由。
> show running-config route
route Outside1 0.0.0.0 0.0.0.0 10.1.1.2 1 track 1
route Outside2 0.0.0.0 0.0.0.0 10.1.2.2 1 track 2
運行命令show route,檢查路由表,如果有兩個預設路由通過介面outside1和outside2,開銷相等,流量可以在兩個ISP電路之間分配。
> show route

Codes: L - local, C - connected, S - static, R - RIP, M - mobile, B - BGP
D - EIGRP, EX - EIGRP external, O - OSPF, IA - OSPF inter area
N1 - OSPF NSSA external type 1, N2 - OSPF NSSA external type 2
E1 - OSPF external type 1, E2 - OSPF external type 2, V - VPN
i - IS-IS, su - IS-IS summary, L1 - IS-IS level-1, L2 - IS-IS level-2
ia - IS-IS inter area, * - candidate default, U - per-user static route
o - ODR, P - periodic downloaded static route, + - replicated route
SI - Static InterVRF, BI - BGP InterVRF
Gateway of last resort is 10.1.2.2 to network 0.0.0.0

S* 0.0.0.0 0.0.0.0 [1/0] via 10.1.2.2, Outside2
                   [1/0] via 10.1.1.2, Outside1
C 10.1.1.0 255.255.255.0 is directly connected, Outside1
L 10.1.1.1 255.255.255.255 is directly connected, Outside1
C 10.1.2.0 255.255.255.0 is directly connected, Outside2
L 10.1.2.1 255.255.255.255 is directly connected, Outside2
C 10.1.3.0 255.255.255.0 is directly connected, Inside
L 10.1.3.1 255.255.255.255 is directly connected, Inside
運行命令show sla monitor configuration以檢查SLA監控器的配置。
> show sla monitor configuration
SA Agent, Infrastructure Engine-II
Entry number: 1
Owner:
Tag:
Type of operation to perform: echo
Target address: 10.1.1.2
Interface: Outside1
Number of packets: 1
Request size (ARR data portion): 28
Operation timeout (milliseconds): 5000
Type Of Service parameters: 0x0
Verify data: No
Operation frequency (seconds): 60
Next Scheduled Start Time: Start Time already passed
Group Scheduled : FALSE
Life (seconds): Forever
Entry Ageout (seconds): never
Recurring (Starting Everyday): FALSE
Status of entry (SNMP RowStatus): Active
Enhanced History:

Entry number: 2
Owner:
Tag:
Type of operation to perform: echo
Target address: 10.1.2.2
Interface: Outside2
Number of packets: 1
Request size (ARR data portion): 28
Operation timeout (milliseconds): 5000
Type Of Service parameters: 0x0
Verify data: No
Operation frequency (seconds): 60
Next Scheduled Start Time: Start Time already passed
Group Scheduled : FALSE
Life (seconds): Forever
Entry Ageout (seconds): never
Recurring (Starting Everyday): FALSE
Status of entry (SNMP RowStatus): Active
Enhanced History:
運行命令show sla monitor operational-state,確認SLA監控器的狀態。在這種情況下,您可以找到「Timeout occurred:FALSE",表示到閘道的ICMP回應正在應答,因此透過目標介面的預設路由處於作用中並已安裝在路由表中。
> show sla monitor operational-state
Entry number: 1
Modification time: 09:31:28.785 UTC Thu Feb 15 2024
Number of Octets Used by this Entry: 2056
Number of operations attempted: 82
Number of operations skipped: 0
Current seconds left in Life: Forever
Operational state of entry: Active
Last time this entry was reset: Never
Connection loss occurred: FALSE
Timeout occurred: FALSE
Over thresholds occurred: FALSE
Latest RTT (milliseconds): 1
Latest operation start time: 10:52:28.785 UTC Thu Feb 15 2024
Latest operation return code: OK
RTT Values:
RTTAvg: 1 RTTMin: 1 RTTMax: 1
NumOfRTT: 1 RTTSum: 1 RTTSum2: 1

Entry number: 2
Modification time: 09:31:28.785 UTC Thu Feb 15 2024
Number of Octets Used by this Entry: 2056
Number of operations attempted: 82
Number of operations skipped: 0
Current seconds left in Life: Forever
Operational state of entry: Active
Last time this entry was reset: Never
Connection loss occurred: FALSE
Timeout occurred: FALSE
Over thresholds occurred: FALSE
Latest RTT (milliseconds): 1
Latest operation start time: 10:52:28.785 UTC Thu Feb 15 2024
Latest operation return code: OK
RTT Values:
RTTAvg: 1 RTTMin: 1 RTTMax: 1
NumOfRTT: 1 RTTSum: 1 RTTSum2: 1
負載平衡
通過FTD的初始流量,以驗證ECMP是否在ECMP區域中的網關之間平衡流量。show conn在這種情況下,從Inside-Host1(10.1.3.2)和Inside-Host2(10.1.3.4)向Internet-Host(10.1.5.2)發起telnet連線,運行命令以確認流量在兩個ISP鏈路之間實現了負載均衡,Inside-Host1(10.1.3.2)通過interface outside1,Inside-Host2(10.1.3.4)通過interface outside2。
> show conn
2 in use, 3 most used
Inspect Snort:
preserve-connection: 2 enabled, 0 in effect, 2 most enabled, 0 most in effect

TCP Inside 10.1.3.2:46069 Outside1 10.1.5.2:23, idle 0:00:24, bytes 1329, flags UIO N1
TCP Inside 10.1.3.4:61915 Outside2 10.1.5.2:23, idle 0:00:04, bytes 1329, flags UIO N1

附註:根據雜湊源和目標IP地址、傳入介面、協定、源和目標埠的演算法,在指定網關之間對流量進行負載均衡。當您運行測試時,由於雜湊演算法,您模擬的流量可以路由到同一網關,這是預期的,它會更改6個元組(源IP、目標IP、傳入介面、協定、源埠、目標埠)中的任何值以對雜湊結果進行更改。
丟失路由
如果到第一個ISP網關的鏈路關閉(在本例中),請關閉第一個網關路由器進行模擬。如果FTD在SLA Monitor對象中指定的閾值計時器內沒有收到來自第一個ISP網關的回應應答,則認為主機無法連線且標籤為關閉。指向第一個網關的跟蹤路由也會從路由表中刪除。
運行命令show sla monitor operational-state,確認SLA監控器的當前狀態。在這種情況下,您可以找到「超時:True在命令輸出中,表示到第一個ISP網關的ICMP響應沒有響應。
> show sla monitor operational-state
Entry number: 1
Modification time: 09:31:28.783 UTC Thu Feb 15 2024
Number of Octets Used by this Entry: 2056
Number of operations attempted: 104
Number of operations skipped: 0
Current seconds left in Life: Forever
Operational state of entry: Active
Last time this entry was reset: Never
Connection loss occurred: FALSE
Timeout occurred: TRUE
Over thresholds occurred: FALSE
Latest RTT (milliseconds): NoConnection/Busy/Timeout
Latest operation start time: 11:14:28.813 UTC Thu Feb 15 2024
Latest operation return code: Timeout
RTT Values:
RTTAvg: 0 RTTMin: 0 RTTMax: 0
NumOfRTT: 0 RTTSum: 0 RTTSum2: 0

Entry number: 2
Modification time: 09:31:28.783 UTC Thu Feb 15 2024
Number of Octets Used by this Entry: 2056
Number of operations attempted: 104
Number of operations skipped: 0
Current seconds left in Life: Forever
Operational state of entry: Active
Last time this entry was reset: Never
Connection loss occurred: FALSE
Timeout occurred: FALSE
Over thresholds occurred: FALSE
Latest RTT (milliseconds): 1
Latest operation start time: 11:14:28.813 UTC Thu Feb 15 2024
Latest operation return code: OK
RTT Values:
RTTAvg: 1 RTTMin: 1 RTTMax: 1
NumOfRTT: 1 RTTSum: 1 RTTSum2: 1
運行命令檢查當前路由表,刪除通過介面outside1到第一個ISP網關的路由,只有一條通過介面outside2到第二個ISP網關的活動預設路由show route。
> show route

Codes: L - local, C - connected, S - static, R - RIP, M - mobile, B - BGP
D - EIGRP, EX - EIGRP external, O - OSPF, IA - OSPF inter area
N1 - OSPF NSSA external type 1, N2 - OSPF NSSA external type 2
E1 - OSPF external type 1, E2 - OSPF external type 2, V - VPN
i - IS-IS, su - IS-IS summary, L1 - IS-IS level-1, L2 - IS-IS level-2
ia - IS-IS inter area, * - candidate default, U - per-user static route
o - ODR, P - periodic downloaded static route, + - replicated route
SI - Static InterVRF, BI - BGP InterVRF
Gateway of last resort is 10.1.2.2 to network 0.0.0.0

S* 0.0.0.0 0.0.0.0 [1/0] via 10.1.2.2, Outside2
C 10.1.1.0 255.255.255.0 is directly connected, Outside1
L 10.1.1.1 255.255.255.255 is directly connected, Outside1
C 10.1.2.0 255.255.255.0 is directly connected, Outside2
L 10.1.2.1 255.255.255.255 is directly connected, Outside2
C 10.1.3.0 255.255.255.0 is directly connected, Inside
L 10.1.3.1 255.255.255.255 is directly connected, Inside
運行命令show conn,您可以發現兩個連線仍處於運行狀態。Inside-Host1(10.1.3.2)和Inside-Host2(10.1.3.4)上的Telnet會話也處於活動狀態,不會有任何中斷。
> show conn
2 in use, 3 most used
Inspect Snort:
preserve-connection: 2 enabled, 0 in effect, 2 most enabled, 0 most in effect

TCP Inside 10.1.3.2:46069 Outside1 10.1.5.2:23, idle 0:00:22, bytes 1329, flags UIO N1
TCP Inside 10.1.3.4:61915 Outside2 10.1.5.2:23, idle 0:00:02, bytes 1329, flags UIO N1
附註:您可以在的輸出中注意到,show conn,雖然通過介面outside1的預設路由已從路由表中刪除,但來自Inside-Host1(10.1.3.2)的telnet會話仍通過介面outside1。這是預期結果,並且根據設計,實際流量流經介面outside2。如果您啟動從Inside-Host1(10.1.3.2)到Internet-Host(10.1.5.2)的新連線,則可以查詢所有流量都通過interface outside2。
疑難排解
要驗證路由表更改,請運行命令debug ip routing。
在本示例中,當通向第一個ISP網關的鏈路斷開時,通過介面outside1的路由將從路由表中刪除。
> debug ip routing
IP routing debugging is on

RT: ip_route_delete 0.0.0.0 0.0.0.0 via 10.1.1.2, Outside1
ha_cluster_synced 0 routetype 0

RT: del 0.0.0.0 via 10.1.1.2, static metric [1/0]NP-route: Delete-Output 0.0.0.0/0 hop_count:1 , via 0.0.0.0, Outside1

RT(mgmt-only): NP-route: Update-Output 0.0.0.0/0 hop_count:1 , via 10.1.2.2, Outside2

NP-route: Update-Input 0.0.0.0/0 hop_count:1 Distance:1 Flags:0X0 , via 10.1.2.2, Outside2
運行命令show route,確認當前路由表。
> show route

Codes: L - local, C - connected, S - static, R - RIP, M - mobile, B - BGP
D - EIGRP, EX - EIGRP external, O - OSPF, IA - OSPF inter area
N1 - OSPF NSSA external type 1, N2 - OSPF NSSA external type 2
E1 - OSPF external type 1, E2 - OSPF external type 2, V - VPN
i - IS-IS, su - IS-IS summary, L1 - IS-IS level-1, L2 - IS-IS level-2
ia - IS-IS inter area, * - candidate default, U - per-user static route
o - ODR, P - periodic downloaded static route, + - replicated route
SI - Static InterVRF, BI - BGP InterVRF
Gateway of last resort is 10.1.2.2 to network 0.0.0.0

S* 0.0.0.0 0.0.0.0 [1/0] via 10.1.2.2, Outside2
C 10.1.1.0 255.255.255.0 is directly connected, Outside1
L 10.1.1.1 255.255.255.255 is directly connected, Outside1
C 10.1.2.0 255.255.255.0 is directly connected, Outside2
L 10.1.2.1 255.255.255.255 is directly connected, Outside2
C 10.1.3.0 255.255.255.0 is directly connected, Inside
L 10.1.3.1 255.255.255.255 is directly connected, Inside
當通向第一個ISP網關的鏈路再次開啟時,通過介面outside1的路由將重新新增到路由表中。
> debug ip routing
IP routing debugging is on
NP-route: Update-Output 0.0.0.0/0 hop_count:1 , via 10.1.2.2, Outside2
NP-route: Update-Output 0.0.0.0/0 hop_count:1 , via 10.1.1.2, Outside2
NP-route: Update-Input 0.0.0.0/0 hop_count:2 Distance:1 Flags:0X0 , via 10.1.2.2, Outside2
 via 10.1.1.2, Outside1
運行命令show route,確認當前路由表。
> show route

Codes: L - local, C - connected, S - static, R - RIP, M - mobile, B - BGP
D - EIGRP, EX - EIGRP external, O - OSPF, IA - OSPF inter area
N1 - OSPF NSSA external type 1, N2 - OSPF NSSA external type 2
E1 - OSPF external type 1, E2 - OSPF external type 2, V - VPN
i - IS-IS, su - IS-IS summary, L1 - IS-IS level-1, L2 - IS-IS level-2
ia - IS-IS inter area, * - candidate default, U - per-user static route
o - ODR, P - periodic downloaded static route, + - replicated route
SI - Static InterVRF, BI - BGP InterVRF
Gateway of last resort is 10.1.2.2 to network 0.0.0.0

S* 0.0.0.0 0.0.0.0 [1/0] via 10.1.2.2, Outside2
                   [1/0] via 10.1.1.2, Outside1
C 10.1.1.0 255.255.255.0 is directly connected, Outside1
L 10.1.1.1 255.255.255.255 is directly connected, Outside1
C 10.1.2.0 255.255.255.0 is directly connected, Outside2
L 10.1.2.1 255.255.255.255 is directly connected, Outside2
C 10.1.3.0 255.255.255.0 is directly connected, Inside
L 10.1.3.1 255.255.255.255 is directly connected, Inside
修訂記錄
| 修訂 | 發佈日期 | 意見 |
|---|---|---|
1.0 |
16-Feb-2024
|
初始版本 |
由思科工程師貢獻
- Chao Feng
 意見
意見