Cisco ONS 15454 ML卡故障排除
目录
简介
本文档使用简单的测试拓扑来描述如何对Cisco ONS 15454上的多层(ML)卡进行故障排除。附录部分提供了一些基本配置命令和详细的拓扑信息。
该测试使用经验方法来了解与ML卡相关的网络故障。测试会注入已知故障或配置,以捕获和分析预期结果。故障隔离案例研究提供了这些发现。
本文档遵循典型的故障排除方法。本文档提供了症状,并讨论了相关故障隔离步骤,还提供了一般的故障排除步骤。
先决条件
要求
Cisco 建议您了解以下主题:
-
Cisco ONS 15454
-
Cisco ONS 15454 ML-Series以太网卡
-
Cisco IOS
-
桥接和IP路由
使用的组件
本文档中的信息基于以下软件和硬件版本:
-
运行Cisco IOS®软件版本12.1(13)E13的思科路由器7603
-
运行Cisco ONS版本4.1.3的Cisco ONS 15454
-
运行Cisco IOS软件版本12.1(19)EO1的ML(作为ONS 4.1.3版本的一部分捆绑)
本文档中的信息都是基于特定实验室环境中的设备编写的。本文档中使用的所有设备最初均采用原始(默认)配置。如果您使用的是真实网络,请确保您已经了解所有命令的潜在影响。
规则
有关文档规则的详细信息,请参阅 Cisco 技术提示规则。
基本ML架构
ONS 15454平台的Cisco ML系列卡在第2层和第3层提供10/100/1000 Mbps SONET/SDH以太网连接。机箱中的每个ML卡运行一个独立的IOS映像。在思科传输控制器(CTC)中在ML端口之间创建交叉连接电路可创建虚拟后端SONET分组(POS)端口。在软件版本4.6及更高版本中,POS端口始终会创建,但只有在CTC中创建交叉连接电路时,端口才会启动。
ML1000-2卡有两个POS端口(0和1)。 每个端口最多具有同步传输信号(STS)-24c带宽,每张卡总有STS-48c。每个POS端口都支持子接口以允许VLAN中继。POS端口到光端口的物理映射在电路创建阶段发生,并且在光跨度变化期间可能改变。因此,电路两端的两个POS端口是对等体,其配置需要匹配。
以太网端口和POS端口之间的映射取决于拓扑要求。第2层交换拓扑将这两种类型的端口与相同的网桥组编号绑定在一起。第3层拓扑在这些接口之间路由数据包。
基本测试拓扑
图1表示测试拓扑:
图1 — 测试拓扑 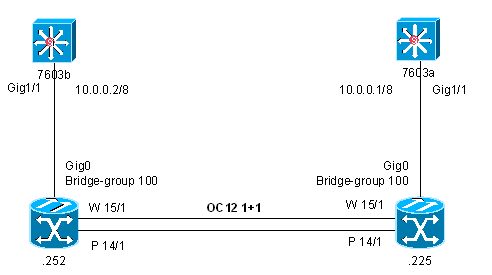
要设置测试拓扑:
-
将两台Cisco 7603路由器通过千兆以太网连接到ONS节点,并确保两台路由器上的两个端口位于同一IP子网。在此,每个ONS节点在插槽12中有一个ML1000-2卡。
-
在两个ONS节点上为Gig0和POS0配置网桥组100。
注意:在本测试中,您无需使用POS1。
两个ML POS0端口之间的电路是STS-12c。
-
禁用ML卡上的IP路由。
-
在两个ONS节点之间调配OC12 1+1保护。有关信息,请参阅图1。
注意:两个ONS节点都运行Cisco ONS版本4.1.3。
故障插入案例研究
本部分检查各种已知故障和一些常见操作的结果。每个案例都描述了ML和ONS的操作和结果。
一般信息
排除ML IOS问题的一些相关命令
show ons alarm
show ip interface brief
clear counters
show interface summary
show interface


        show controller pos show cdp neighbor show bridge verbose show vlans

         show sdm l2-switching forwarding show ons provisioning-agent message ports show running show log show tech-support
确保使用正确的时间戳记录缓冲区,并检查定时通信和控制(TCC)是否设置了正确的日期和时间。以下是ML上的配置输出示例:
service timestamps debug uptime
 service timestamps log datetime msec localtime
 logging buffered 4096 debugging
这些警报会自动触发POS链路状态更改:
PAIS
PLOP
PTIM
PUNEQ
PRDI
PPLM
PPDI
BER_SF_B3
注意:ONS 15454平台使用两种格式报告警报。例如,PAIS出现在IOS(ML)中,而AIS-P出现在CTC中。PAIS和AIS-P代表相同类型的警报。
CTC中的常见验证
Alarms
Conditions
History
Circuit
Inventory
Port PM counters
Diagnostics file
Audit trail
-
在ML卡上:
-
维护/性能以太网端口:检查错误。
-
维护/性能POS端口:检查错误。
-
-
在OC12工作卡上:
-
在调配/SONET STS上启用IPPM。
-
性能:检查错误。
-
案例分析
本节介绍各种潜在故障点,并说明如何捕获正确的信息以解决问题。
以太网断开
拉出以太网电缆时,.225上会出现此警报:
.225ML12#show ons alarm
Equipment Alarms
Active: None
Port Alarms
  POS0  Active: None
  POS1  Active: None
  GigabitEthernet0  Active: CARLOSS
  GigabitEthernet1  Active: None

POS0
Active Alarms : None
Demoted Alarms: None

POS1 Interface not provisioned
注意:如果强制启用ML GigE接口,ML不会注意到链路已关闭。
CTC中显示的。225(参见图2)相同。
图2 - CTC中的警报 
丢失与7603a相邻的思科发现协议(CDP)确认了问题。
注意:GigE 0的状态不影响POS 0接口(接口仍为Up/Up)。
OC12保护交换机
OC12保护交换机不会创建任何警报或错误。
两个OC12停用(OOS)
当。252节点上的两个OC12端口都变为OOS时,.225报告AIS-P,这会导致POS 0接口关闭,并导致TPTFAIL。
.225ML12#show ons alarm
Equipment Alarms
Active: RUNCFG-SAVENEED

Port Alarms
  POS0  Active: TPTFAIL
  POS1  Active: None
  GigabitEthernet0  Active: None
  GigabitEthernet1  Active: None

POS0
Active Alarms : PAIS
Demoted Alarms: None

POS1
Interface not provisioned
XC侧交换机
此日志条目显示在交换XC的节点的ML上。请注意,XCON B是插槽10 XC。
May 24 09:55:27.402: %CARDWARE-5-XCON_SWITCH: Switched XCON to B
May 24 09:55:27.406: %CARDWARE-6-BTC_DRV: Init BTC, BTC Rev = 2, Backplane = 0,
Port = 0
TCC侧交换机
图3显示已注册的警报。
图3 - TCC侧交换机警报 
注意:如果使用CTC或反向telnet连接到ML卡,则会失去与ML卡的连接。
几分钟后,警报必须清除。这些日志条目以ML显示:
May 24 10:29:09.258: %CARDWARE-5-SOCKET_INFO: closed socket to TCC:
changed active TCC
May 24 10:29:09.766: %ONS-6-VTY: All Vty lines cleared
May 24 10:29:14.762: %CARDWARE-5-SOCKET_INFO: cannot connect socket to TCC: B
May 24 10:29:20.270: %CARDWARE-5-SOCKET_INFO: cannot connect socket to TCC: B
May 24 10:29:25.770: %CARDWARE-5-SOCKET_INFO: cannot connect socket to TCC: B
May 24 10:29:31.270: %CARDWARE-5-SOCKET_INFO: cannot connect socket to TCC: B
May 24 10:29:36.370: %CARDWARE-5-SOCKET_INFO: open socket to TCC: B
May 24 10:29:41.166: %CARDWARE-6-BTC_DRV: Init BTC, BTC Rev = 2, Backplane = 0,
Port = 0.
此输出中也显示当前活动TCC。插槽11 TCC为TCC B,插槽7为TCC A。
.252ML12#show ons equipment-agent status
EQA ---- phySlot: 12, eqptType: EQPT_L2SC, eqptID: 0x2403 ----
     curTCC: Tcc B
linkStatus:    Full    dbReq/Recv: 7  /  7   msgVerToEQM: 2
   socketFd:       0    pipeMsgAct:   No     hdrSizeToEQM: 28
  connTries:       0 connTimerFast:   No   hdrSizeFromEQM: 28
timingProv:   No
clock auto 1
电路移除和创建
删除交叉连接电路会创建以下日志条目:
May 27 17:40:48.459: %VIRTUAL_PA-6-PAREMOVED:
POS interface [0] has been removed due to circuit deletion
May 27 17:40:48.511: %CARDWARE-6-BTC_DRV: Init BTC, BTC Rev = 2,
Backplane = 0, Port = 0.
端口配置在您从ML查看时更改。
.225ML12#show ons provisioning-agent m ports all
  ----- Backend Port (00) Data -----
  prov:  no   sts: xx   vt: xx   type: xxx   name: xxxxx
  ----- Backend Port (01) Data -----
  prov:  no   sts: xx   vt: xx   type: xxx   name: xxxxx
创建STS3c电路会更新ML上的端口信息。POS 0控制器输出中也显示电路大小。
.225ML12#show ons provisioning-agent m ports all
  ----- Backend Port (00) Data -----
  prov: yes   sts: 00   vt: 255   type: DOS   name:
  ----- STS (00) Term Strip -----
  Admin State: IS        Direction: TX_RX_EQPT
  Type: 3 Sf: 1E-4 Sd: 1E-7 C2 tx/exp: 0x01 / 0x01
  PathTrace Format: 64Byte  Mode: OFF
   expected: (not valid)
   send: valid: "\000\000\000\000"
  ----- VT (255) Term Strip not provisioned -----
  ----- STS (00) Xc Strip -----
  rate: 3  Admin: IS
  Src  Port/STS: 0x09/0x00  STS Eqpt: 0x01
  Dest Port/STS: 0x06/0x00  UPSR STS Cont Dest: 0x00
  Prev STS Stich Dest Port/STS: 0xFF/0x00
  Next STS Stich Dest Port/STS: 0xFF/0x00

  ----- Backend Port (01) Data -----
  prov:  no   sts: xx   vt: xx   type: xxx   name: xxxxx
系统将显示以下日志条目:
May 27 17:47:08.711: %VIRTUAL_PA-6-PAPLUGGEDIN:
POS interface [0] has been created due to circuit creation
May 27 17:47:08.715: %CARDWARE-6-BTC_DRV: Init BTC, BTC Rev = 2,
Backplane = 0, Port = 0.
May 27 17:47:08.915: %LINK-3-UPDOWN:
Interface POS0, changed state to up
May 27 17:47:09.927: %LINEPROTO-5-UPDOWN:
Line protocol on Interface POS0, changed state to up
环回
在。225上将设施环路应用到活动OC12端口会导致。225 ML报告TPTFAIL警报。此警报也显示在ML警报列表上。
注意:如果在活动路径上启用环回,则会发生流量丢失。
.225ML12#show ons alarm
Equipment Alarms
Active: None
Port Alarms
  POS0  Active: TPTFAIL
  POS1  Active: None
  GigabitEthernet0  Active: None
  GigabitEthernet1  Active: None
POS0
Active Alarms : PAIS
Demoted Alarms: None

POS1
Interface not provisioned
注意:如本测试所示,当您使用弹性数据包环(RPR)而不是1+1 OC-12时,请在启用环回之前关闭POS接口。RPR上的这种环回会导致流量丢失,因为保护路径不会重新路由流量。
日期和时间更改
TCC上的日期和时间设置不正确,请在日志中创建此条目:
2d23h: %CARDWARE-5-CLOCK_ERR: cannot set time-of-day,
(invalid IOS time set on TCC)
当您更改日期和时间时,此条目将显示在ML日志中。
2d23h: %CARDWARE-5-CLOCK_INFO: system clock, timezone,
and summertime configured
根据TCC的时钟,IOS系统时钟上会发生自动更新。您可以通过show clock命令验证此更新。
注意:您可以使用service timestamps命令配置调试和日志时间戳,以使用新的时钟信息。
关闭一个POS接口
当。225 ML上的POS 0接口关闭时,会出现一些警报和情况(见图4)。
图4 — 当POS 0接口关闭时发生的警报和条件 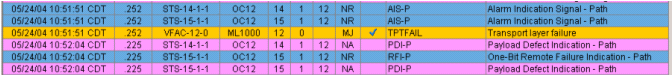
AIS-P对。252上的OC12端口进行。然后对。252上的ML进行TPTFAIL。在返回路径上,.225报告OC-12端口和RFI — 的路径负载缺陷指示(PPDI,也称为PDI-P)工作OC-12端口的P。
在。225 ML上,出现以下警报:
.225ML12#show ons alarm
Equipment Alarms
Active: RUNCFG-SAVENEED

Port Alarms
  POS0  Active: None
  POS1  Active: None
  GigabitEthernet0  Active: None
  GigabitEthernet1  Active: None

POS0
Active Alarms : PRDI PPDI
Demoted Alarms: None

POS1
Interface not provisioned
.225上还显示以下日志条目:
May 24 10:52:01.802: %LINK-5-CHANGED: Interface POS0,
changed state to administratively down
May 24 10:52:02.801: %LINEPROTO-5-UPDOWN: Line protocol on Interface POS0,
changed state to down
May 24 10:52:04.021: %SONET-4-ALARM:  POS0: PRDI
May 24 10:52:04.269: %SONET-4-ALARM:  POS0: PPDI
在。252上,出现以下警报:
.252ML12#show ons alarm
Equipment Alarms
Active: None

Port Alarms
  POS0  Active: TPTFAIL
  POS1  Active: None
  GigabitEthernet0  Active: None
  GigabitEthernet1  Active: None

POS0
Active Alarms : PAIS
Demoted Alarms: None

POS1
Interface not provisioned
同样,.252上的日志条目指示POS 0关闭事件的原因是PAIS。这与CTC报告的警报或条件一致。
May 24 10:51:48.969: %VIRTUAL_PA-6-UPDOWN:
POS0 changed to down due to PAIS defect trigger changing state
May 24 10:51:49.169: %LINK-3-UPDOWN:
Interface POS0, changed state to down
May 24 10:51:50.169: %LINEPROTO-5-UPDOWN:
Line protocol on Interface POS0, changed state to down
May 24 10:51:51.169: %SONET-4-ALARM:  POS0: PAIS
您可以通过以下输出确认这一事实:
.252ML12#show contro pos 0 | inc Active
Active Alarms : PAIS
Active Defects: PAIS
当您打开POS 0接口时,这些日志条目显示在。252 ML上:
May 24 11:16:17.509: %VIRTUAL_PA-6-UPDOWN:
 POS0 changed to up due to PAIS defect trigger changing state
 May 24 11:16:17.709: %LINK-3-UPDOWN:
 Interface POS0, changed state to up
 May 24 11:16:18.709: %LINEPROTO-5-UPDOWN:
 Line protocol on Interface POS0, changed state to up
 May 24 11:16:27.309: %SONET-4-ALARM:
 POS0: PAIS  cleared
以下是。225 ML上的日志条目:
May 24 11:16:30.607: %VIRTUAL_PA-6-UPDOWN:
POS0 changed to up due to PPDI defect trigger changing state
May 24 11:16:30.807: %LINK-3-UPDOWN:
Interface POS0, changed state to up
May 24 11:16:31.555: %SYS-5-CONFIG_I:
Configured from console by vty0 (127.0.0.100)
May 24 11:16:31.807: %LINEPROTO-5-UPDOWN:
Line protocol on Interface POS0, changed state to up
May 24 11:16:40.175: %SONET-4-ALARM:  POS0: PRDI  cleared
May 24 11:16:40.415: %SONET-4-ALARM:  POS0: PPDI  cleared
现在流量恢复正常。
POS CRC不匹配
当同一电路的两个POS端口(例如,一端为16位,另一端为32位)上的CRC不匹配时,TCC和ML上都不会出现警报。两个POS端口仍处于启用状态,但流量不会流动。以下是一些症状:
-
由于CRC,两个POS接口输入错误计数器的增量均为100%。在本例中,CRC在。225 ML上更改为16位,而。252 ML仍具有默认的32位CRC。.252 ML上的POS0接口显示类似的输入和CRC错误计数。
.225ML12#show int pos 0 POS0 is up, line protocol is up Hardware is Packet/Ethernet over Sonet, address is 000f.2475.8c00 (bia 000f.2475.8c00) MTU 1500 bytes, BW 622080 Kbit, DLY 100 usec, reliability 149/255, txload 1/255, rxload 1/255 Encapsulation ONS15454-G1000, crc 16, loopback not set Keepalive set (10 sec) Scramble enabled ARP type: ARPA, ARP Timeout 04:00:00 Last input 00:06:57, output never, output hang never Last clearing of "show interface" counters 00:04:28 Input queue: 0/75/0/0 (size/max/drops/flushes); Total output drops: 0 Queueing strategy: fifo Output queue: 0/40 (size/max) 5 minute input rate 0 bits/sec, 0 packets/sec 5 minute output rate 0 bits/sec, 0 packets/sec 0 packets input, 11190 bytes Received 0 broadcasts (0 IP multicast) 0 runts, 0 giants, 0 throttles 0 parity 138 input errors, 138 CRC, 0 frame, 0 overrun, 0 ignored 0 input packets with dribble condition detected 178 packets output, 15001 bytes, 0 underruns 0 output errors, 0 applique, 0 interface resets 0 babbles, 0 late collision, 0 deferred 0 lost carrier, 0 no carrier 0 output buffer failures, 0 output buffers swapped out 0 carrier transitions -
POS控制器输入CRC错误计数增量。
.225ML12#show contro pos 0 | inc input
8841 total input packets,  46840204 post-HDLC bytes
0 input short packets,  46840993 pre-HDLC bytes
0  input long packets , 3893  input runt packets
2165  input CRCerror packets , 0  input drop packets
0 input abort packets
0 input packets dropped by ucode
-
光路中的CDP邻居丢弃。即使POS0已启用,CDP也能正常工作,但POS0上的邻居也不会显示。
225ML12#show cdp neighbor
Capability Codes: R - Router, T - Trans Bridge, B - Source Route Bridge
                  S - Switch, H - Host, I - IGMP, r - Repeater, P - Phone
Device ID        Local Intrfce     Holdtme    Capability  Platform  Port ID
7603a            Gig 0              170         R S I     Cat 6000  Gig 1/1

.225ML12#show cdp int | be POS0
POS0 is up, line protocol is up
  Encapsulation
  Sending CDP packets every 60 seconds
  Holdtime is 180 seconds
POS扰码不匹配
使用PPP封装,可以启用SPE扰码(默认情况下,SPE扰码被禁用)。 在本例中,.225ML POS0已启用扰码,而。252ML POS0具有默认设置。
.225ML12#show int pos 0 | in Scramble
   Scramble enabled
加扰不匹配会更改C2值。如果启用扰码,则POS接口使用C2值0x16。如果禁用扰码,则POS接口使用C2值0xCF。当您在。252 POS 0端口上启用加扰时,结果如下(.225 POS 0配置不会更改):
.252ML12#show contr pos 0 | in C2
C2 (tx / rx)           : 0x16 / 0xCF
在。252节点上,PLM-P针对CTC中的活动OC12端口,然后针对POS0端口发生。这会触发POS0端口关闭,从而引发TPTFAIL警报。
.252ML12#show ons alarm
Equipment Alarms
Active: RUNCFG-SAVENEED

Port Alarms
  POS0  Active: TPTFAIL
  POS1  Active: None
  GigabitEthernet0  Active: None
  GigabitEthernet1  Active: None
POS0
Active Alarms : PPLM
Demoted Alarms: None

POS1
Interface not provisioned
在。225节点上,CTC中的两个OC12端口都会发生PDI-P。此警报是。252中POS0关闭的结果。POS0也出现同一警报(在IOS中称为路径负载缺陷指示[PPDI]),这是因为接口接收C2值0xFC(本文档后面部分有关此的详细信息)。
.225ML12#show control pos 0 | inc C2
C2 (tx / rx)           : 0xCF / 0xFC
PPDI警报关闭POS0接口。关闭的POS0接口会引发TPTFAIL。
.225ML12#show ons alarm
Equipment Alarms
Active: RUNCFG-SAVENEED
Port Alarms
  POS0  Active: TPTFAIL
  POS1  Active: None
  GigabitEthernet0  Active: None
  GigabitEthernet1  Active: None

POS0
Active Alarms : PPDI
Demoted Alarms: None

POS1
Interface not provisioned
POS C2字节更改
LEX封装的默认C2值为0x01(POS的默认封装),PPP/HDLC封装的默认C2值为0xCF。如果将此值更改为不一致的任何其他值,则可能会发生PLM-P和TPTFAIL警报,这会影响服务。同一电路上的两个POS端口可以使用相同的C2值。例外是0xFC。值0xFC表示路径负载缺陷。因此,即使C2值匹配(0xFC/0xFC),也会发生PDI-P。
您可以使用以下命令更改POS C2值:
pos c2 flag <value in decimal>
您可以表示如下所示的实际C2值(它们采用十六进制格式):
.225ML12#show contro pos 0 | inc C2
C2 (tx / rx)           : 0x16 / 0x16
在这种情况下,两个C2值都匹配。因此,不会发生警报。
将电路状态更改为OOS
当您将OC-12电路更改为OOS时,TCC或ML上不会立即出现警报。电路状态在CTC的电路窗口上显示OOS。日志条目插入到ML:
.225ML12#show log …
May 27 14:22:15.114: %CARDWARE-6-CIRCUIT_STATE:
Circuit state on POS 0 change from IS to OOS_AS
May 27 14:22:15.114: %CARDWARE-6-BTC_DRV:
Init BTC, BTC Rev = 2, Backplane = 0, Port = 0.
POS端口可更改为Up/Down状态。因此,TPTFAIL警报在两端发生。流量不会像您预期的那样流动。
卡住PDI-P警报
有时,警报会卡住,并且不会自动清除,即使导致警报的条件已清除。PPDI(或PDI-P)示例如下所示:
May 27 18:41:15.339: %CARDWARE-6-CIRCUIT_STATE:
Circuit state on POS 0 change from IS to OOS_AS
May 27 18:42:11.871: %LINEPROTO-5-UPDOWN:
Line protocol on Interface POS0, changed state to down
May 27 19:17:48.507: %SYS-5-CONFIG_I:
Configured from console by vty2 (127.0.0.100)
May 28 11:57:33.387: %CARDWARE-6-CIRCUIT_STATE:
Circuit state on POS 0 change from OOS_AS to IS
May 28 11:57:33.391: %CARDWARE-6-BTC_DRV:
Init BTC, BTC Rev = 2, Backplane = 0, Port = 0.
May 28 11:57:35.879: %VIRTUAL_PA-6-UPDOWN:
POS0 changed to down due to PPDI defect trigger changing state
May 28 11:57:36.079: %LINK-3-UPDOWN:
Interface POS0, changed state to down
May 28 11:57:36.279: %SONET-4-ALARM:
POS0: PPDI
当之前的电路状态变为OOS时,.225 POS报告PPDI,即使电路返回到服务中(IS)状态。因此POS0接口保持关闭。CTC还报告。225节点上的PDI-P。.225上OC12接口的PM计数器显示无错误,并指示OC-12路径是干净的。
此输出报告PPDI停滞:
.225ML12#show contro pos 0
Interface POS0
Hardware is Packet/Ethernet over Sonet
PATH
  PAIS      = 0         PLOP      = 0         PRDI    = 0         PTIM = 0
  PPLM      = 0         PUNEQ     = 0         PPDI    = 0
  BER_SF_B3 = 0         BER_SD_B3 = 0         BIP(B3) = 0          REI = 0
  NEWPTR    = 0         PSE       = 0         NSE     = 0
Active Alarms : PPDI
Demoted Alarms: None
Active Defects: PPDI
Alarms reportable to CLI:
PAIS PRDI PLOP PUNEQ PPLM PTIM PPDI BER_SF_B3 BER_SD_B3
Link state change defects:
PAIS PLOP PTIM PUNEQ PRDI PPLM PPDI BER_SF_B3

Link state change time   : 200 (msec)

DOS FPGA channel number  : 0
Starting STS (0 based)   : 0
VT ID (if any) (0 based) : 255
Circuit size           : STS-3c
RDI Mode               : 1 bit
C2 (tx / rx)           : 0xCF / 0xFC
Framing                : SONET
从本文档前面的部分中,C2值0xFC会导致POS报告PPDI。
注意:当。252节点没有警报和错误,并且POS0的匹配C2值为0xCF/0xCF时,您必须考虑卡住的警报问题。如果重置。225节点上的POS0接口,则警报会清除,包括CTC中报告的PDI-P。此异常情况应在后续版本中修复。
May 28 14:34:16.967: %LINK-5-CHANGED:
Interface POS0, changed state to administratively down
May 28 14:34:18.675: %LINK-3-UPDOWN:
Interface POS0, changed state to down
May 28 14:34:18.939: %VIRTUAL_PA-6-UPDOWN:
POS0 changed to up due to PPDI defect trigger changing state
May 28 14:34:19.139: %LINK-3-UPDOWN:
Interface POS0, changed state to up
May 28 14:34:20.127: %SYS-5-CONFIG_I:
Configured from console by vty2 (127.0.0.100)
May 28 14:34:20.147: %LINEPROTO-5-UPDOWN:
Line protocol on Interface POS0, changed state to up
May 28 14:34:28.739: %SONET-4-ALARM:
POS0: PPDI  cleared
现在C2值匹配,节点无警报。
.225ML12#show control pos 0
Interface POS0
Hardware is Packet/Ethernet over Sonet
PATH
  PAIS      = 0         PLOP      = 0         PRDI    = 1         PTIM = 0
  PPLM      = 0         PUNEQ     = 0         PPDI    = 0
  BER_SF_B3 = 0         BER_SD_B3 = 0         BIP(B3) = 0          REI = 16
  NEWPTR    = 0         PSE       = 0         NSE     = 0
Active Alarms : None
Demoted Alarms: None
Active Defects: None
Alarms reportable to CLI:
PAIS PRDI PLOP PUNEQ PPLM PTIM PPDI BER_SF_B3 BER_SD_B3
Link state change defects:
PAIS PLOP PTIM PUNEQ PRDI PPLM PPDI BER_SF_B3
Link state change time: 200 (msec)

DOS FPGA channel number  : 0
Starting STS (0 based)   : 0
VT ID (if any) (0 based) : 255
Circuit size           : STS-3c
RDI Mode               : 1 bit
C2 (tx / rx)           : 0xCF / 0xCF
Framing                : SONET
注:有时,光纤卡上也可能有一个或多个警报。您需要重置活动TCC以清除这些卡住的警报。因此,备用TCC变为活动状态,并且操作是无中断的(即不影响流量),但您可能会丢失管理流量(例如CTC会话)几分钟。
网桥组编号不匹配
此测试在两个ONS ML卡上使用相同的100网桥组。但是,只要POS 0和GigE 0位于同一ML或位于同一网桥组,网桥组就不必相同。例如,在。252 ML上更改网桥组101不会影响流量。
.252ML12#show bridge ver
Total of 300 station blocks, 298 free
Codes: P - permanent, S - self

Maximum dynamic entries allowed: 1000
Current dynamic entry count: 0

Flood ports

Maximum dynamic entries allowed: 1000
Current dynamic entry count: 2
BG Hash      Address      Action  Interface    VC    Age   RX count   TX count
101 02/0   000b.45b0.484a forward  Gi0                  -
101 BC/0   0009.b7f4.76ca forward  POS0
                -
Flood ports
GigabitEthernet0
POS0
未解决机器学习错误的部分列表
以下是适用于本文档中配置的部分错误列表:
注意:这些错误记录为cisco.com版本说明的一部分。
| DDTS ID | 状态 | 已找到版本 | 版本固定 | *********************版本*注释********************* |
|---|---|---|---|---|
| CSCeb56287 | V | 4.1 | 4.6 | 当您将ML系列电路的状态从服务中(IS)调配到服务外(OOS),然后再调配回IS时,数据流量不会恢复。为避免此问题,在将状态从IS更改之前,请在CLI上将POS端口设置为关闭。将状态从OOS改回IS后,将POS端口设置为no shutdown。 |
| CSCeb24757 | V | 4.1 | 4.6 | 如果在ML1000端口上断开传输光纤,则仅相邻端口会断开链路。理想情况下,两个端口必须确定链路已断开,以便上层协议可以将流量重新路由到不同的端口。要解决此情况,请对传输光纤断开或故障的端口发出shutdown和no shutdown命令。 |
| CSCdy31775 | V | 4 | 4.6 | 没有丢弃计数包括因输出队列拥塞而丢弃的数据包。在以下任一情况下会发生此问题:
|
| CSCdz49700 | C | 4 | - | ML系列卡始终在相连设备之间转发动态中继协议(DTP)数据包。如果在连接的设备上启用DTP(可以是默认设置),DTP可能会协商ML系列卡不支持的参数,例如ISL。ML系列卡计算链路上协商为将ISL用作组播数据包的所有数据包,而STP和CDP数据包在使用ISL的连接设备之间桥接,而不进行处理。为避免此问题,请在连接的设备上禁用DTP和ISL。此功能按设计进行。 |
| CSCdz68649 | C | 4 | - | 在特定条件下,流量控制状态可以指示流量控制在流量控制不起作用时工作正常。ML系列卡上的流量控制仅在配置端口级监察器时起作用。端口级监察器是输入策略映射的默认和唯一类的监察器。流量控制也仅用于将源速率限制为已配置的监察器丢弃速率。流量控制不会防止由于输出队列拥塞而丢弃数据包。因此,如果没有端口级监察器,或者如果输出队列出现拥塞,则策略不起作用。但是,在这些情况下,策略仍然可能错误地显示为已启用。为避免此问题,请配置端口级监察器并防止输出队列拥塞。 |
| CSCdz69700 | C | 4 | - | 如果在ML1000端口上发出shutdown/no shutdown命令序列,则计数器将清除。这是启动过程的正常部分,此功能不会更改。 |
| CSCea11742 | V | 4 | 4.6 | 当您在两个ML POS端口之间调配电路作为OOS时,其中一个端口可能错误地报告TPTFAIL。ML100T-12和ML1000-2卡均存在此问题。如果出现此问题,请打开每个ML卡的控制台窗口,并将POS端口配置为关闭。 |
| CSCea20962 | V | 4 | 5 | 将OOS应用于电路调配窗口上的ML丢弃端口时,不显示警告。 |
| CSCdy47284 | C | 4 | - | ML-100快速以太网MTU未强制实施。但是,大于9050字节的帧可能会被丢弃,并导致Rx和Tx错误。 |
状态码
|
||||
排除故障并隔离故障
本部分以目前所提供的信息为基础,构建故障隔离案例。根据系统报告的症状,本部分提供用于排除故障的分步提示。这些案例研究涉及与ONS 15454上的ML卡相关的一些常见症状。
通常,您必须按照以下步骤排除问题:
-
收集一般信息和故障症状。
-
分析信息。
-
查明问题.
-
识别问题.
-
解决问题。
其中一些步骤被多次迭代。
一般信息
基本信息收集
在重新加载或重置ML卡之前收集信息。手动重新加载会丢弃可能有价值的信息。手动重新加载重置所有计数器,并且您丢失存储在内存中的所有日志。Cisco建议您先发出show tech-support命令和任何其他数据收集命令,以恢复日志信息,然后再在路由器上发出任何故障排除命令。如果重新启动或重置ML卡,则可能会丢失控制台/telnet访问以及相关信息。
导致事件的控制台日志可以提供导致错误或崩溃的信息。发生错误时,必须尝试保存记录到控制台或缓冲区的任何消息。最后这些控制台消息对于发现问题可能至关重要。根据问题类型,并非所有消息都会写入SYSLOG服务器。
使用show tech-support命令收集各种数据。此命令通常是在错误发生在给定时间点后获取路由器状态的最佳工具。
以下是show tech-support命令执行的命令的基本列表。您捕获的内容因IOS版本、硬件和您选择的选项而异。
show version
show running-config
show stacks
show interfaces
show controllers
show file systems
dir nvram:
show flash: all
show process memory
show process cpu
show context
show sdm internal all-regions
show sdm ip-adjacency all
show sdm ip-mcast all
show sdm ip-prefix all
show sdm l2-switching forwarding
show sdm l2-switching interface-macs
show sdm qos all
show ons alarm defect
show ons alarm failure
show ons hwp defects
show ons hwp reframe
show ons hwp tci
show ons hwp xcon
show ons equipment-agent status
show ons provisioning-agent message ports all
show ons provisioning-agent message node-element
test mda conn dump connections
test mda ppe global reg dump 0
test mda ppe global reg dump 1 Mempool statistics
show region
show buffers
除了这些命令外,还捕获与ML卡有特殊关联的其他命令输出,如本文档前面各节所述。例如,show log、show ons alarm等等。从CTC捕获并导出前面所述的相关信息,例如警报、条件、电路、库存和PM计数器。
用于排除故障的一些有用IOS工具
在收集所需信息后,您需要破译信息中的错误。使用show-tech命令的输出,此任务可能很困难。这些工具可以破译show-tech命令和许多其它命令的输出。
-
输出解释程序工具(仅限注册客户):将show tech-support命令的输出粘贴到此工具中。此工具将快速总结发现的任何问题。这是一个非常棒的工具,可快速总结您遇到的更直接的问题。此工具解释各种输入。您可以使用“技术”菜单下拉框进行浏览。但是,该工具并不完善,仍需要解释才能验证信息。
-
命令查找工具:选择以下参考指南中的任意一个以查找命令和语法:
-
IOS命令参考
-
IOS配置指南
-
Catalyst命令参考
-
PIX防火墙命令参考
-
-
Error Message Decoder:此工具可帮助您研究并解决Cisco IOS软件、Catalyst交换机软件和Cisco Secure PIX防火墙软件的错误消息。粘贴日志文件中的错误消息,并确保选中“结果中建议相关文档”复选框。
-
Bug Toolkit:根据以下一个或多个选项搜索结果:
-
IOS 版本.
-
功能或组件。
-
关键字。
-
Bug Severity(Bug Severity)(您可以选择特定严重性或指定范围)。
-
-
TAC案例收集:您可以通过TAC工程师提供的解决方案以交互方式诊断涉及硬件、配置和性能问题的常见问题。
注意:某些工具与ML卡不完全兼容。
案例分析
本节介绍一些常见故障情况,以及可采取的隔离这些情况的步骤。有关详细警报信息,请参阅《Cisco ONS 15454故障排除指南4.1.x和4.5版》。
ML以太网端口上报告的CARLOSS警报
主(MJ)和影响服务(SA),ML系列以太网(流量)卡上的载波丢失警报是“LOS(OC-N)”警报的数据等效。以太网端口已丢失链路,并且未收到有效信号。
当从IOS CLI将以太网端口配置为no shutdown端口,并且满足以下条件之一时,会发生CARLOSS警报:
-
电缆未正确连接到近端或远端。
-
自动协商失败。
-
速度(仅适用于10/100端口)设置不正确。
如本测试中在7603b和。252节点ML卡之间所示,禁用自动协商以启用端口。
为POS报告的TPTFAIL警报
这是严重警报(MJ),影响服务(SA)。 TPT层故障警报表示ML系列POS卡的端到端POS链路完整性功能中断。TPTFAIL表示POS端口的远端情况或配置不正确。
TPTFAIL警报表示SONET路径、远程POS端口或POS端口配置错误导致整个端到端POS路径无法工作。
如果POS端口使用的电路上存在任何SONET路径警报,例如“AIS-P”、“LOP-P”、“PDI-P”或“UNEQ-P”,则受影响的端口可以报告TPTFAIL警报。
如果远端ML系列POS端口被管理性禁用,端口会插入近端端口检测到的“AIS-P”条件。近端端口可在此情况下报告TPTFAIL。远端POS端口报告PRDI和PPDI。您可以使用show ons alarm命令查看所有这些警报。如果POS端口在IOS CLI级别配置错误,配置错误将导致端口关闭并报告TPTFAIL。
要清除TPTFAIL(ML系列)警报,请完成以下步骤:
-
如果POS端口电路没有发生SONET警报,请验证您是否正确配置了两个POS端口。
-
如果仅针对POS端口电路发生“PLM-P”警报,请验证您是否已正确配置了两个POS端口。
-
如果POS端口电路仅出现“PDI-P”情况,且电路由G系列卡终止,则验证G系列卡是否出现“CARLOSS(G系列以太网)”警报。如果是,请完成“清除CARLOSS(G系列以太网)警报”过程。
-
如果存在“AIS-P”警报、“LOP-P”警报或“UNEQ-P”警报,请排除SONET路径(同一电路上两个POS接口之间的路径)故障以清除这些警报。
千兆以太网接口保持关闭
POS接口报告CRC错误
此问题通常是由于POS配置上的CRC不匹配。
POS报告PPDI
PDI-P是ONS节点生成的STS路径开销(POH)中包含的一组特定于应用的代码。警报向下游设备指示,该STS同步负载包络中包含的一个或多个直接映射负载存在缺陷
支持ML系列卡电路的OC-N卡端口上的PDI-P条件可能源于ML系列卡的端到端以太网链路完整性特征。如果问题是由于链路完整性造成的,则也会针对终止电路的一个或两个POS端口报告“TPTFAIL(G系列以太网)”警报或警报。如果TPTFAIL针对一个或两个POS端口发生,请排除TPTFAIL随附的警报故障,以清除PDI-P条件。PDI-P警报也可能是卡住警报的症状。
以下是因。225上的POS0管理性关闭而发生警报的示例:
| .225 POS 0(关闭) | .252 POS 0 |
|---|---|
| PPDI、PRDI | PAIS、TPTFAIL |
在本例中,PAIS表示问题的根源是。225节点。如果清除PAIS,TPTFAIL、PPDI和PRDI也会清除。
POS报告PRDI
PRDI表示问题出在远端。由于远端收到AIS警报,因此可能会发生此问题。有关详细信息,请参阅POS报告PPDI。
POS报告PAIS
AIS路径条件表示此节点在传入路径中检测AIS。
通常,任何AIS都是一种特殊的SONET信号,它告知接收节点发送方节点没有可发送的有效信号。AIS不是错误。接收节点在节点看到信号AIS而不是实际信号的每个输入上提升故障状态AIS。在大多数情况下,当出现这种情况时,上游节点会发出警报以指示信号故障;所有下游节点只提升某类AIS。当您解决上游节点上的问题时,此条件将清除。
POS报告PPLM
此问题严重(CR)和影响服务(SA)
节点上的路径负载标签不匹配警报表示传入信号与本地调配的标签不匹配。由于SONET路径开销中的C2字节值无效,出现此情况。加扰和封装可以更改C2值。
POS接口保持关闭
各种警报可能会关闭POS接口。默认情况下,这些警报会导致POS链路关闭:PAIS、PLOP、PTIM、PUNEQ、PRDI、PPLM、PPDI、BER_SF_B3。要修改列表,请使用pos trigger defects接口命令。当POS接口打开或关闭时,将记录原因(show log)。 您可以使用show ons alarm命令检索所有活动警报或缺陷。排除启动POS接口的原因。当POS接口关闭时,会发生TPTFAIL警报。
当您连接到其他供应商的POS接口时,请确保两端的这些项目匹配:
-
加扰
-
C2值
-
CRC
POS接口报告输入错误
在POS接口(show interface POS和CTC PM计数器)上累积的输入错误表示入站数据包的格式不正确。各种原因可能导致输入错误数据包。
如果警报存在,请排除故障。
如果CRC错误随输入错误而增加,则CRC错误可能是输入错误的原因。排除CRC配置故障。
检验POS接口配置。
排除两个POS端口之间的路径组件故障。如果输入错误增加,而其他任何组件错误中没有相应增加,请考虑硬件问题。在更换硬件之前,在电路两侧执行以下步骤(一次一个),以查看问题是否仍然存在:
-
TCC侧交换机
-
XC侧开关
-
SONET端口上的保护交换机(如果存在保护)
-
ML卡软重置
-
ML卡重新拔插
CDP邻居未显示
检验您是否已在两个接口上启用CDP。
排除警报和接口错误(如果存在)。
无端到端流量
检验两台终端设备上的配置。
排除警报和错误(如果存在)。
附录:基本测试配置和命令信息
本部分捕获此测试中所有设备的基本配置信息,该信息用作排除故障的基准。
7603a
7603a#show run
Building configuration...

Current configuration : 3136 bytes
!
version 12.1
service timestamps debug uptime
service timestamps log uptime
no service password-encryption
!
hostname 7603a
!
!
ip subnet-zero
!
!
!
mls flow ip destination
mls flow ipx destination
spanning-tree extend system-id
!
redundancy
 mode rpr-plus
 main-cpu
  auto-sync running-config
  auto-sync standard
!
!
!
interface GigabitEthernet1/1
 ip address 10.0.0.1 255.0.0.0
!
router ospf 1
 log-adjacency-changes
 network 10.0.0.1 0.0.0.0 area 0
!
ip classless
no ip http server
!
!
!
!
line con 0
line vty 0 4
!
end

7603a#show ip int bri
Interface              IP-Address     OK? Method Status                 Protocol
Vlan1                  unassigned     YES unset  administratively down  down

GigabitEthernet1/1     10.0.0.1       YES manual up                     up


7603a#show ip route
Codes: C - connected, S - static, I - IGRP, R - RIP, M - mobile, B - BGP
       D - EIGRP, EX - EIGRP external, O - OSPF, IA - OSPF inter area
       N1 - OSPF NSSA external type 1, N2 - OSPF NSSA external type 2
       E1 - OSPF external type 1, E2 - OSPF external type 2, E - EGP
       i - IS-IS, L1 - IS-IS level-1, L2 - IS-IS level-2, ia - IS-IS inter area
       * - candidate default, U - per-user static route, o - ODR
       P - periodic downloaded static route

Gateway of last resort is not set

7603a#show int gigabitEthernet 1/1
GigabitEthernet1/1 is up, line protocol is up (connected)
  Hardware is C6k 1000Mb 802.3, address is 0009.b7f4.76ca (bia 0009.b7f4.76ca)
  Internet address is 10.0.0.1/8
  MTU 1500 bytes, BW 1000000 Kbit, DLY 10 usec,
     reliability 255/255, txload 1/255, rxload 1/255
  Encapsulation ARPA, loopback not set
  Keepalive set (10 sec)
  Full-duplex mode, link type is autonegotiation, media type is SX
  output flow-control is unsupported, input flow-control is unsupported, 1000Mb/s
  Clock mode is auto
  input flow-control is off, output flow-control is off
  ARP type: ARPA, ARP Timeout 04:00:00
  Last input 00:00:01, output 00:00:45, output hang never
  Last clearing of "show interface" counters never
  Input queue: 0/75/0/0 (size/max/drops/flushes); Total output drops: 0
  Queueing strategy: fifo
  Output queue :0/40 (size/max)
  5 minute input rate 0 bits/sec, 0 packets/sec
  5 minute output rate 0 bits/sec, 0 packets/sec
  L2 Switched: ucast: 5482 pkt, 516472 bytes - mcast: 1 pkt, 64 bytes
  L3 in Switched: ucast: 0 pkt, 0 bytes - mcast: 0 pkt, 0 bytes mcast
  L3 out Switched: ucast: 0 pkt, 0 bytes
     5145 packets input, 405866 bytes, 0 no buffer
     Received 5107 broadcasts, 0 runts, 0 giants, 0 throttles
     0 input errors, 0 CRC, 0 frame, 0 overrun, 0 ignored
     0 input packets with dribble condition detected
     332 packets output, 111641 bytes, 0 underruns
     0 output errors, 0 collisions, 2 interface resets
     0 babbles, 0 late collision, 0 deferred
     0 lost carrier, 0 no carrier
     0 output buffer failures, 0 output buffers swapped out

7603a#show ip ospf neig

Neighbor ID     Pri   State           Dead Time   Address         Interface
10.0.0.2          1   FULL/DR         00:00:38    10.0.0.2        GigabitEtherne
t1/1
7603b
7603b#show run
Building configuration...

Current configuration : 1102 bytes
!
version 12.1
service timestamps debug uptime
service timestamps log uptime
no service password-encryption
!
hostname 7603b
!
enable password cisco
!
ip subnet-zero
!
!
!
mls flow ip destination
mls flow ipx destination
spanning-tree extend system-id
!
redundancy
 mode rpr-plus
 main-cpu
  auto-sync running-config
  auto-sync standard
!
!
!
interface GigabitEthernet1/1
 ip address 10.0.0.2 255.0.0.0
 speed nonegotiate
!
router ospf 1
 log-adjacency-changes
 network 10.0.0.2 0.0.0.0 area 0
!
ip classless
no ip http server
!
!
!
!
line con 0
line vty 0 4
 no login
!
end

Note that if GigE link does not come up, auto-negotiation may not be working.
Auto-negotiation can be turned off to force the link to come up.
Ensure both sides of the link are matching.

7603b#show ip int bri
Interface              IP-Address      OK? Method Status                Protocol
Vlan1                  unassigned      YES NVRAM  administratively down down

GigabitEthernet1/1     10.0.0.2        YES manual up                    up

7603b#show int gig 1/1
GigabitEthernet1/1 is up, line protocol is up (connected)
  Hardware is C6k 1000Mb 802.3, address is 000b.45b0.484a (bia 000b.45b0.484a)
  Internet address is 10.0.0.2/8
  MTU 1500 bytes, BW 1000000 Kbit, DLY 10 usec,
     reliability 255/255, txload 1/255, rxload 1/255
  Encapsulation ARPA, loopback not set
  Keepalive set (10 sec)
  Full-duplex mode, link type is force-up, media type is SX
  output flow-control is unsupported, input flow-control is unsupported, 1000Mb/s
  Clock mode is auto
  input flow-control is off, output flow-control is off
  ARP type: ARPA, ARP Timeout 04:00:00
  Last input 00:00:01, output 00:00:04, output hang never
  Last clearing of "show interface" counters never
  Input queue: 0/75/0/0 (size/max/drops/flushes); Total output drops: 0
  Queueing strategy: fifo
  Output queue :0/40 (size/max)
  5 minute input rate 0 bits/sec, 0 packets/sec
  5 minute output rate 0 bits/sec, 0 packets/sec
  L2 Switched: ucast: 5695 pkt, 534143 bytes - mcast: 3 pkt, 192 bytes
  L3 in Switched: ucast: 0 pkt, 0 bytes - mcast: 0 pkt, 0 bytes mcast
  L3 out Switched: ucast: 0 pkt, 0 bytes
     5319 packets input, 395772 bytes, 0 no buffer
     Received 5172 broadcasts, 4 runts, 0 giants, 0 throttles
     4 input errors, 0 CRC, 0 frame, 0 overrun, 0 ignored
     0 input packets with dribble condition detected
     413 packets output, 139651 bytes, 0 underruns
     0 output errors, 0 collisions, 2 interface resets
     0 babbles, 0 late collision, 0 deferred
     0 lost carrier, 0 no carrier
     0 output buffer failures, 0 output buffers swapped out

7603b#show ip route
Codes: C - connected, S - static, I - IGRP, R - RIP, M - mobile, B - BGP
       D - EIGRP, EX - EIGRP external, O - OSPF, IA - OSPF inter area
       N1 - OSPF NSSA external type 1, N2 - OSPF NSSA external type 2
       E1 - OSPF external type 1, E2 - OSPF external type 2, E - EGP
       i - IS-IS, L1 - IS-IS level-1, L2 - IS-IS level-2, ia - IS-IS inter area
       * - candidate default, U - per-user static route, o - ODR
       P - periodic downloaded static route

Gateway of last resort is not set

C    10.0.0.0/8 is directly connected, GigabitEthernet1/1

7603b#ping 10.0.0.1

Type escape sequence to abort.
Sending 5, 100-byte ICMP Echos to 10.0.0.1, timeout is 2 seconds:
!!!!!
Success rate is 100 percent (5/5), round-trip min/avg/max = 1/1/1 ms
.225毫升
.225ML12#show run
Building configuration...
Current configuration : 580 bytes
!
version 12.1
no service pad
service timestamps debug uptime
service timestamps log uptime
no service password-encryption
!
hostname .225ML12
!
logging buffered 4096 debugging
enable password cisco
!
ip subnet-zero
no ip routing
no ip domain-lookup
!
!
bridge 100 protocol ieee
!
!
interface GigabitEthernet0
 no ip address
 no ip route-cache
 bridge-group 100
!
interface GigabitEthernet1
 no ip address
 no ip route-cache
 shutdown
!
interface POS0
 no ip address
 no ip route-cache
 crc 32
 bridge-group 100
!
ip classless
no ip http server
!
!
!
!
line con 0
line vty 0 4
 exec-timeout 0 0
 no login
!
end

.225ML12#show ip int bri
Interface              IP-Address      OK? Method Status                Protocol
GigabitEthernet0       unassigned      YES unset  up                    up
GigabitEthernet1       unassigned      YES unset  administratively down down
POS0                   unassigned      YES unset  up                    up

.225ML12#show int gig 0
GigabitEthernet0 is up, line protocol is up
  Hardware is xpif_port, address is 000f.2475.8c04 (bia 000f.2475.8c04)
  MTU 1500 bytes, BW 1000000 Kbit, DLY 10 usec,
     reliability 255/255, txload 1/255, rxload 1/255
  Encapsulation ARPA, loopback not set
  Keepalive set (10 sec)
  Full-duplex, 1000Mb/s, 1000BaseSX, Auto-negotiation
  output flow-control is off, input flow-control is on
  ARP type: ARPA, ARP Timeout 04:00:00
  Last input 00:00:53, output 00:00:01, output hang never
  Last clearing of "show interface" counters never
  Input queue: 0/75/0/0 (size/max/drops/flushes); Total output drops: 0
  Queueing strategy: fifo
  Output queue: 0/40 (size/max)
  5 minute input rate 0 bits/sec, 0 packets/sec
  5 minute output rate 0 bits/sec, 0 packets/sec
     336 packets input, 111810 bytes
     Received 1 broadcasts (0 IP multicast)
     1 runts, 0 giants, 0 throttles
     1 input errors, 0 CRC, 0 frame, 0 overrun, 0 ignored
     0 watchdog, 244 multicast
     0 input packets with dribble condition detected
     5369 packets output, 422097 bytes, 0 underruns
     0 output errors, 0 collisions, 0 interface resets
     0 babbles, 0 late collision, 0 deferred
     0 lost carrier, 0 no carrier
     0 output buffer failures, 0 output buffers swapped out

.225ML12#show int pos 0
POS0 is up, line protocol is up
  Hardware is Packet/Ethernet over Sonet, address is 000f.2475.8c00
(bia 000f.2475.8c00)
  MTU 1500 bytes, BW 622080 Kbit, DLY 100 usec,
     reliability 255/255, txload 1/255, rxload 1/255
  Encapsulation ONS15454-G1000, crc 32, loopback not set
  Keepalive set (10 sec)
  Scramble enabled
  ARP type: ARPA, ARP Timeout 04:00:00
  Last input 00:00:32, output never, output hang never
  Last clearing of "show interface" counters 02:16:40
  Input queue: 0/75/0/0 (size/max/drops/flushes); Total output drops: 0
  Queueing strategy: fifo
  Output queue: 0/40 (size/max)
  5 minute input rate 0 bits/sec, 0 packets/sec
  5 minute output rate 0 bits/sec, 0 packets/sec
     152 packets input, 26266640 bytes
     Received 0 broadcasts (0 IP multicast)
     0 runts, 0 giants, 0 throttles
              0 parity
     1 input errors, 1 CRC, 0 frame, 0 overrun, 0 ignored
     0 input packets with dribble condition detected
     4250 packets output, 351305 bytes, 0 underruns
     0 output errors, 0 applique, 0 interface resets
     0 babbles, 0 late collision, 0 deferred
     0 lost carrier, 0 no carrier
     0 output buffer failures, 0 output buffers swapped out
     0 carrier transitions

.225ML12#show ons alarm
Equipment Alarms
Active: None
Port Alarms
  POS0  Active: None
  POS1  Active: None
  GigabitEthernet0  Active: None
  GigabitEthernet1  Active: None

POS0
Active Alarms : None
Demoted Alarms: None

POS1
Interface not provisioned

This command shows all the defects that can be reported to CLI and TCC (via CTC).

.225ML12#show ons alarm defect
Equipment Defects
Active: None
Reportable to TCC/CLI: CONTBUS-IO-A CONTBUS-IO-B CTNEQPT-PBWORK
 CTNEQPT-PBPROT EQPT RUNCFG-SAVENEED ERROR-CONFIG
Port Defects
  POS0
  Active: None
  Reportable to TCC: CARLOSS TPTFAIL
  POS1
  Active: None
  Reportable to TCC: CARLOSS TPTFAIL
  GigabitEthernet0
  Active: None
  Reportable to TCC: CARLOSS TPTFAIL
  GigabitEthernet1
  Active: None
  Reportable to TCC: CARLOSS TPTFAIL

POS0
Active Defects: None
Alarms reportable to CLI: PAIS PRDI PLOP PUNEQ PPLM PTIM PPDI BER_SF_B3 BER_SD_B3

POS1
Interface not provisioned

This command shows all the active alarms.

.225ML12#show ons alarm failure
Equipment Alarms
Active: None
Port Alarms
  POS0  Active: None
  POS1  Active: None
  GigabitEthernet0  Active: None
  GigabitEthernet1  Active: None
POS0
Active Alarms : None
Demoted Alarms: None
POS1
Interface not provisioned

.225ML12#show control pos 0
Interface POS0
Hardware is Packet/Ethernet over Sonet
PATH
  PAIS      = 0         PLOP      = 0         PRDI    = 0         PTIM = 0
  PPLM      = 0         PUNEQ     = 0         PPDI    = 0
  BER_SF_B3 = 0         BER_SD_B3 = 0         BIP(B3) = 0          REI = 0
  NEWPTR    = 0         PSE       = 0         NSE     = 0
Active Alarms : None
Demoted Alarms: None
Active Defects: None
Alarms reportable to CLI: PAIS PRDI PLOP PUNEQ PPLM PTIM PPDI BER_SF_B3 BER_SD_B3
Link state change defects: PAIS PLOP PTIM PUNEQ PRDI PPLM PPDI BER_SF_B3
Link state change time   : 200 (msec)

DOS FPGA channel number  : 0
Starting STS (0 based)   : 0
VT ID (if any) (0 based) : 255
Circuit size           : STS-12c
RDI Mode               : 1 bit
C2 (tx / rx)           : 0x01 / 0x01
Framing                : SONET

Path Trace
 Mode            : off
 Transmit String :
 Expected String :
 Received String :
 Buffer          : Unstable
 Remote hostname :
 Remote interface:
 Remote IP addr  :
B3 BER thresholds:
SFBER = 1e-4,   SDBER = 1e-7

231 total input packets,  26294392 post-HDLC bytes
0 input short packets,  26294465 pre-HDLC bytes
0  input long packets , 0  input runt packets
1  input CRCerror packets , 0  input drop packets
0 input abort packets
0 input packets dropped by ucode

6392  total output packets, 527660  output pre-HDLC bytes
527812 output post-HDLC bytes

Carrier delay is 200 msec

.225ML12#show cdp nei
Capability Codes: R - Router, T - Trans Bridge, B - Source Route Bridge
                  S - Switch, H - Host, I - IGMP, r - Repeater, P - Phone
Device ID        Local Intrfce     Holdtme    Capability  Platform  Port ID
.252ML12         POS0               148           T       ONS-ML1000POS0
7603a            Gig 0              121         R S I     Cat 6000  Gig 1/1

The following command  shows the detail bridge table. Note that 000b.45b0.484a
 is the address of Gig0 on 7603b.

.225ML12#show bridge ver
Total of 300 station blocks, 298 free
Codes: P - permanent, S - self
Maximum dynamic entries allowed: 1000
Current dynamic entry count: 2

BG Hash      Address      Action  Interface      VC    Age   RX count   TX count
100 02/0   000b.45b0.484a forward  POS0                 -
100 BC/0   0009.b7f4.76ca forward  Gi0                  -

Flood ports
GigabitEthernet0
POS0

This command shows the same type of info as the above.

.225ML12#show sdm l2-switching forwarding bridge-group 100
MAC-Address   B-Group l3_int punt_da Out-int SPR-NodeId CAM-ADDR  STATE
-----------   ------- ------ ------- ------- ---------- --------  -----
0009B7F476CA  100     0      0       Gi0     ***        11        Used
000B45B0484A  100     0      0       PO0     ***        12        Used

.225ML12#show interface summary
 *: interface is up
 IHQ: pkts in input hold queue     IQD: pkts dropped from input queue
 OHQ: pkts in output hold queue    OQD: pkts dropped from output queue
 RXBS: rx rate (bits/sec)          RXPS: rx rate (pkts/sec)
 TXBS: tx rate (bits/sec)          TXPS: tx rate (pkts/sec)
 TRTL: throttle count

  Interface           IHQ   IQD  OHQ   OQD  RXBS RXPS  TXBS TXPS TRTL
---------------------------------------------------------------------
* GigabitEthernet0      0     0    0     0     0    0     0    0    0
  GigabitEthernet1      0     0    0     0     0    0     0    0    0
* POS0                  0     0    0     0     0    0     0    0    0

NOTE:No separate counters are maintained for subinterfaces
     Hence Details of subinterface are not shown

.225ML12#show ons equipment-agent status
EQA ---- phySlot: 12, eqptType: EQPT_L2SC, eqptID: 0x2403 ----
    curTCC: Tcc B
linkStatus:    Full    dbReq/Recv: 1  /  4   msgVerToEQM: 2
  socketFd:       0    pipeMsgAct:   No     hdrSizeToEQM: 28
 connTries:       0 connTimerFast:   No   hdrSizeFromEQM: 28
timingProv:   No
clock auto 1

.225ML12#show ons provisioning-agent message ports all
  ----- Backend Port (00) Data -----
  prov: yes   sts: 00   vt: 255   type: DOS   name:

  ----- STS (00) Term Strip -----
  Admin State: IS        Direction: TX_RX_EQPT
  Type: 12 Sf: 1E-4 Sd: 1E-7 C2 tx/exp: 0x01 / 0x01
  PathTrace Format: 64Byte  Mode: OFF
   expected: (not valid)
   send: valid: "\000\000\000\000"

  ----- VT (255) Term Strip not provisioned -----

  ----- STS (00) Xc Strip -----
  rate: 12  Admin: IS
  Src  Port/STS: 0x09/0x00  STS Eqpt: 0x01
  Dest Port/STS: 0x06/0x00  UPSR STS Cont Dest: 0x00
  Prev STS Stich Dest Port/STS: 0xFF/0x00
  Next STS Stich Dest Port/STS: 0xFF/0x00

  ----- Backend Port (01) Data -----
  prov:  no   sts: xx   vt: xx   type: xxx   name: xxxxx

The following command retrieves the ONS provisioning information
 that is done via CTC.

.225ML12#show ons provisioning-agent message node-element
  ----- NE Data -----
  Node Name: R27-15454c
  MAC Addr : 00 10 CF D2 70 92
  IP Addr      : 10.89.244.225
  Sub Net Mask : 255.255.255.192
  Dflt Router  : 10.89.244.193
  Lan IP Addr  : 10.89.244.225
  Lan Sub Mask : 255.255.255.192
  Day Savings  : 0x01
  Min from UTC : 480
  Node ID      : 0xFF
  Sync Msg Ver : 0x01
  Sync Msg Res Delta : -1
  Sync Msg Res Quality : 0x06
  XConA Eqpt ID : 0x00000201
  XConB Eqpt ID : 0x00000201   OSPF Node ID  : 0xCFD27092
  SDH Mode      : SONET
.252ML12
The auto negotiation was turned off on Gig0 (see later).

.252ML12#show run
Building configuration...
Current configuration : 643 bytes
!
version 12.1
no service pad
service timestamps debug uptime
service timestamps log uptime
no service password-encryption
!
hostname .252ML12
!
logging buffered 4096 debugging
enable password cisco
!
ip subnet-zero
no ip routing
no ip domain-lookup
!
!
bridge 100 protocol ieee
!
!
interface GigabitEthernet0
 no ip address
 no ip route-cache
 no speed
 no negotiation auto
 bridge-group 100
!
interface GigabitEthernet1
 no ip address
 no ip route-cache
 shutdown
!
interface POS0
 no ip address
 no ip route-cache
 crc 32
 bridge-group 100
!
ip classless
no ip http server
!
!
!
!
line con 0
line vty 0 4
 exec-timeout 0 0
 no login
!
end

.252ML12#show ip int brie
Interface              IP-Address      OK? Method Status                Protocol
GigabitEthernet0       unassigned      YES manual up                    up
GigabitEthernet1       unassigned      YES NVRAM  administratively down down
POS0                   unassigned      YES unset  up                    up

The Gig0 interface showed carrier loss until it was forced up by turning off
 auto negotiation.

.252ML12#show int gig 0
GigabitEthernet0 is up, line protocol is up
  Hardware is xpif_port, address is 000f.2475.8c4c (bia 000f.2475.8c4c)
  MTU 1500 bytes, BW 1000000 Kbit, DLY 10 usec,
     reliability 255/255, txload 1/255, rxload 1/255
  Encapsulation ARPA, loopback not set
  Keepalive set (10 sec)
  Full-duplex, 1000Mb/s, 1000BaseSX, Force link-up
  output flow-control is off, input flow-control is on
  ARP type: ARPA, ARP Timeout 04:00:00
  Last input 00:00:06, output 00:00:01, output hang never
  Last clearing of "show interface" counters never
  Input queue: 0/75/0/0 (size/max/drops/flushes); Total output drops: 0
  Queueing strategy: fifo
  Output queue: 0/40 (size/max)
  5 minute input rate 0 bits/sec, 0 packets/sec
  5 minute output rate 0 bits/sec, 0 packets/sec
     391 packets input, 125375 bytes
     Received 1 broadcasts (0 IP multicast)
     0 runts, 0 giants, 0 throttles
     0 input errors, 0 CRC, 0 frame, 0 overrun, 0 ignored
     0 watchdog, 282 multicast
     0 input packets with dribble condition detected
     8489 packets output, 637084 bytes, 0 underruns
     0 output errors, 0 collisions, 0 interface resets
     0 babbles, 0 late collision, 0 deferred
     0 lost carrier, 0 no carrier
     0 output buffer failures, 0 output buffers swapped out

.252ML12#show int pos 0
POS0 is up, line protocol is up
  Hardware is Packet/Ethernet over Sonet, address is 000f.2475.8c48
 (bia 000f.2475.8c48)
  MTU 1500 bytes, BW 622080 Kbit, DLY 100 usec,
     reliability 255/255, txload 1/255, rxload 1/255
  Encapsulation ONS15454-G1000, crc 32, loopback not set
  Keepalive set (10 sec)
  Scramble enabled
  ARP type: ARPA, ARP Timeout 04:00:00
  Last input 00:00:00, output never, output hang never
  Last clearing of "show interface" counters 03:58:02
  Input queue: 0/75/0/0 (size/max/drops/flushes); Total output drops: 0
  Queueing strategy: fifo
  Output queue: 0/40 (size/max)
  5 minute input rate 0 bits/sec, 0 packets/sec
  5 minute output rate 0 bits/sec, 0 packets/sec
     7396 packets input, 608413 bytes
     Received 0 broadcasts (0 IP multicast)
     0 runts, 0 giants, 0 throttles
              0 parity
     1 input errors, 1 CRC, 0 frame, 0 overrun, 0 ignored
     0 input packets with dribble condition detected
     267 packets output, 96676 bytes, 0 underruns
     0 output errors, 0 applique, 0 interface resets
     0 babbles, 0 late collision, 0 deferred
     0 lost carrier, 0 no carrier
     0 output buffer failures, 0 output buffers swapped out
     0 carrier transitions

.252ML12#show ons alarm
Equipment Alarms
Active: None
Port Alarms
  POS0  Active: None
  POS1  Active: None
  GigabitEthernet0  Active: None
  GigabitEthernet1  Active: None

POS0
Active Alarms : None
Demoted Alarms: None

POS1
Interface not provisioned

.252ML12#show ons alarm defect
Equipment Defects
Active: None
Reportable to TCC/CLI: CONTBUS-IO-A CONTBUS-IO-B CTNEQPT-PBWORK
 CTNEQPT-PBPROT EQPT RUNCFG-SAVENEED ERROR-CONFIG
Port Defects
  POS0
  Active: None
  Reportable to TCC: CARLOSS TPTFAIL
  POS1
  Active: None
  Reportable to TCC: CARLOSS TPTFAIL
  GigabitEthernet0
  Active: None
  Reportable to TCC: CARLOSS TPTFAIL
  GigabitEthernet1
  Active: None
  Reportable to TCC: CARLOSS TPTFAIL

POS0
Active Defects: None
Alarms reportable to CLI: PAIS PRDI PLOP PUNEQ PPLM PTIM PPDI BER_SF_B3 BER_SD_B3

POS1
Interface not provisioned

.252ML12#show ons alarm failure
Equipment Alarms
Active: None
Port Alarms
  POS0  Active: None
  POS1  Active: None
  GigabitEthernet0  Active: None
  GigabitEthernet1  Active: None

POS0
Active Alarms : None
Demoted Alarms: None

POS1
Interface not provisioned

.252ML12#show contro pos 0
Interface POS0
Hardware is Packet/Ethernet over Sonet
PATH
  PAIS      = 0         PLOP      = 0         PRDI    = 0         PTIM = 0
  PPLM      = 0         PUNEQ     = 0         PPDI    = 0
  BER_SF_B3 = 0         BER_SD_B3 = 0         BIP(B3) = 0          REI = 0
  NEWPTR    = 0         PSE       = 0         NSE     = 0
Active Alarms : None
Demoted Alarms: None
Active Defects: None
Alarms reportable to CLI: PAIS PRDI PLOP PUNEQ PPLM PTIM PPDI BER_SF_B3 BER_SD_B3
Link state change defects: PAIS PLOP PTIM PUNEQ PRDI PPLM PPDI BER_SF_B3
Link state change time   : 200 (msec)

DOS FPGA channel number  : 0
Starting STS (0 based)   : 0
VT ID (if any) (0 based) : 255
Circuit size           : STS-12c
RDI Mode               : 1 bit
C2 (tx / rx)           : 0x01 / 0x01
Framing                : SONET

Path Trace
 Mode            : off
 Transmit String :
 Expected String :
 Received String :
 Buffer          : Unstable
 Remote hostname :
 Remote interface:
 Remote IP addr  :

B3 BER thresholds:
SFBER = 1e-4,   SDBER = 1e-7

7425 total input packets,  610493 post-HDLC bytes
0 input short packets,  610501 pre-HDLC bytes
0  input long packets , 0  input runt packets
1  input CRCerror packets , 0  input drop packets
0 input abort packets
0 input packets dropped by ucode

268  total output packets, 97061  output pre-HDLC bytes
97061 output post-HDLC bytes

Carrier delay is 200 msec

.252ML12#show cdp neigh
Capability Codes: R - Router, T - Trans Bridge, B - Source Route Bridge
                  S - Switch, H - Host, I - IGMP, r - Repeater, P - Phone
Device ID        Local Intrfce     Holdtme    Capability  Platform  Port ID
.225ML12         POS0               168           T       ONS-ML1000POS0
7603b            Gig 0              158         R S I     Cat 6000  Gig 1/1

.252ML12#show bridge verbose
Total of 300 station blocks, 300 free
Codes: P - permanent, S - self

Total of 300 station blocks, 298 free Codes: P - permanent, S – self

Maximum dynamic entries allowed: 1000 Current dynamic entry count: 2
BG Hash       Address        Action  Interface    VC    Age   RX count   TX count
100 02/0      000b.45b0.484a forward  Gi0             -
100 BC/0      0009.b7f4.76ca forward  POS0            -
Flood ports   GigabitEthernet0        POS0

.252ML12#show sdm l2-switching forwarding bridge-group 100
MAC-Address   B-Group l3_int punt_da Out-int SPR-NodeId CAM-ADDR  STATE
-----------   ------- ------ ------- ------- ---------- --------  -----
000B45B0484A  100     0      0       Gi0     ***        11        Used
0009B7F476CA  100     0      0       PO0     ***        16        Used

.252ML12#show int summ
 *: interface is up
 IHQ: pkts in input hold queue     IQD: pkts dropped from input queue
 OHQ: pkts in output hold queue    OQD: pkts dropped from output queue
 RXBS: rx rate (bits/sec)          RXPS: rx rate (pkts/sec)
 TXBS: tx rate (bits/sec)          TXPS: tx rate (pkts/sec)
 TRTL: throttle count
  Interface           IHQ   IQD  OHQ   OQD  RXBS RXPS  TXBS TXPS TRTL
---------------------------------------------------------------------
* GigabitEthernet0      0     0    0     0     0    0     0    0    0
  GigabitEthernet1      0     0    0     0     0    0     0    0    0
* POS0                  0     0    0     0     0    0     0    0    0
NOTE:No separate counters are maintained for subinterfaces
     Hence Details of subinterface are not shown

.252ML12#show ons equipment-agent status
EQA ---- phySlot: 12, eqptType: EQPT_L2SC, eqptID: 0x2403 ----
    curTCC: Tcc A
linkStatus:    Full    dbReq/Recv: 1  /  5   msgVerToEQM: 2
  socketFd:       0    pipeMsgAct:   No     hdrSizeToEQM: 28
 connTries:       0 connTimerFast:   No   hdrSizeFromEQM: 28
timingProv:   No
clock auto 1

.252ML12#show ons provisioning-agent message ports all
  ----- Backend Port (00) Data -----
  prov: yes   sts: 00   vt: 255   type: DOS   name:

  ----- STS (00) Term Strip -----
  Admin State: IS        Direction: TX_RX_EQPT
  Type: 12 Sf: 1E-4 Sd: 1E-7 C2 tx/exp: 0x01 / 0x01
  PathTrace Format: 64Byte  Mode: OFF
   expected: (not valid)
   send: valid: "\000\000\000\000"

  ----- VT (255) Term Strip not provisioned -----

  ----- STS (00) Xc Strip -----
  rate: 12  Admin: IS
  Src  Port/STS: 0x09/0x00  STS Eqpt: 0x01
  Dest Port/STS: 0x06/0x00  UPSR STS Cont Dest: 0x00
  Prev STS Stich Dest Port/STS: 0xFF/0x00
  Next STS Stich Dest Port/STS: 0xFF/0x00

  ----- Backend Port (01) Data -----
  prov:  no   sts: xx   vt: xx   type: xxx   name: xxxxx

.252ML12#show ons provisioning-agent message node-element
  ----- NE Data -----
  Node Name: r26-15454a
  MAC Addr : 00 10 CF D2 40 52
  IP Addr      : 10.89.244.252
  Sub Net Mask : 255.255.255.192
  Dflt Router  : 10.89.244.193
  Lan IP Addr  : 10.89.244.252
  Lan Sub Mask : 255.255.255.192
  Day Savings  : 0x01
  Min from UTC : 480
  Node ID      : 0xFF
  Sync Msg Ver : 0x01
  Sync Msg Res Delta : 0
  Sync Msg Res Quality : 0x00
  XConA Eqpt ID : 0x00000201
  XConB Eqpt ID : 0x00000201
  OSPF Node ID  : 0xCFD24052
  SDH Mode      : SONET
相关信息
修订历史记录
| 版本 | 发布日期 | 备注 |
|---|---|---|
1.0 |
14-Nov-2005 |
初始版本 |
 反馈
反馈