排除Cisco IOS XE 16.x上Catalyst交换机的CPU使用故障
下载选项
非歧视性语言
此产品的文档集力求使用非歧视性语言。在本文档集中,非歧视性语言是指不隐含针对年龄、残障、性别、种族身份、族群身份、性取向、社会经济地位和交叉性的歧视的语言。由于产品软件的用户界面中使用的硬编码语言、基于 RFP 文档使用的语言或引用的第三方产品使用的语言,文档中可能无法确保完全使用非歧视性语言。 深入了解思科如何使用包容性语言。
关于此翻译
思科采用人工翻译与机器翻译相结合的方式将此文档翻译成不同语言,希望全球的用户都能通过各自的语言得到支持性的内容。 请注意:即使是最好的机器翻译,其准确度也不及专业翻译人员的水平。 Cisco Systems, Inc. 对于翻译的准确性不承担任何责任,并建议您总是参考英文原始文档(已提供链接)。
简介
本文档介绍如何对由于运行16.x版本的Cisco IOS® XE平台出现中断而导致的CPU使用率过高进行故障排除。
背景信息
本文档由Raymond Whiting和Yogesh Ramdoss(思科TAC工程师)撰写。
本文档还介绍了此平台上用于解决CPU使用率高问题的几个重要新命令。了解Cisco IOS XE的构建方式非常重要。使用Cisco IOS XE,Cisco已迁移到Linux内核,并且所有子系统都已分解为多个进程。之前在Cisco IOS中的所有子系统(如模块驱动程序、高可用性(HA)等)现在都作为Linux操作系统(OS)中的软件进程运行。 Cisco IOS 本身作为 Linux 操作系统中的后台守护程序 (IOSd) 运行。 Cisco IOS XE不仅保留了传统Cisco IOS的外观和感觉,还保留了其操作、支持和管理。
以下提供了一些有用的术语定义:
- 转发引擎驱动程序 (FED):这是Cisco Catalyst交换机的核心,负责所有硬件编程/转发。
- IOSd:Linux 内核上运行的 Cisco IOS 后台守护程序,作为内核中的软件进程运行。
- 数据包传输系统 (PDS):这是将数据包传输到各个子系统和从各个子系统传输数据包的架构和过程。例如,PDS 可控制如何在 FED 和 IOSd 之间传输数据包。
- 控制平面(CP):控制平面是一个通用术语,用于对涉及Catalyst交换机CPU的功能和流量进行分组。这包括发往交换机或从交换机发送的流量,例如生成树协议(STP)、热备份路由器协议(HSRP)和路由协议。这也包括必须由CPU处理的应用层协议,如安全外壳(SSH)和简单网络管理协议(SNMP)。
- 数据平面(DP):通常,数据平面包括硬件ASIC和无需控制平面协助即可转发的流量。
- 点击:由DP拦截的入口协议控制数据包发送到CP进行处理。
- 注入:CP生成的协议数据包发送到DP,以便在IO接口上传出。
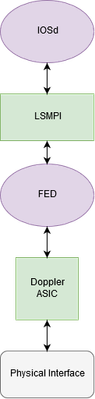
- LSMPI:Linux共享内存分支接口。
数据平面和控制平面之间通信路径的概要图:
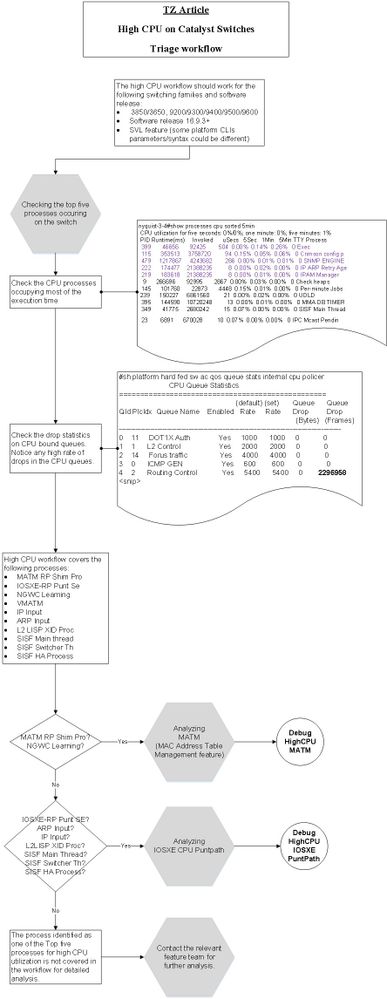
高CPU故障排除工作流程
本节提供系统工作流程来分类交换机上的高CPU问题。请注意,在撰写本部分时,它涵盖的是选定的流程。
案例研究1.地址解析协议中断
本部分的故障排除和验证过程可广泛用于由于中断而导致CPU使用率较高的情况。
步骤1.确定消耗CPU周期的进程
此show process cpu命令用于显示IOSd守护程序的当前进程状态。添加输出修改时| exclude 0.00
此输出提供两个有价值的信息:
- 五秒的CPU使用率:91%/30%
- 第一个数字(91%)是交换机的整体CPU利用率
- 第二个数字(30%)是由数据平面中断引起的利用率
- 地址解析协议
(ARP) Input(Address Resolution Protocol)进程是当前消耗资源的顶级Cisco IOS进程:
Switch# show processes cpu sort | ex 0.00
CPU utilization for five seconds: 91%/30%; one minute: 30%; five minutes: 8%
 PID Runtime(ms)     Invoked      uSecs   5Sec   1Min   5Min TTY Process
  37       14645         325      45061 59.53% 18.86%  4.38%   0 ARP Input
 137        2288         115      19895  1.20%  0.14%  0.07%   0 Per-minute Jobs
 373        2626       35334         74  0.15%  0.11%  0.09%   0 MMA DB TIMER
 218        3123       69739         44  0.07%  0.09%  0.12%   0 IP ARP Retry Age
 404        2656       35333         75  0.07%  0.09%  0.09%   0 MMA DP TIMER
此show processes cpu platform sorted命令用于显示来自Linux内核的进程使用率的外观。从输出中可以看到FED进程较高,这是由传送到IOSd进程的ARP请求造成的:
Switch# show processes cpu platform sorted
CPU utilization for five seconds: 38%, one minute: 38%, five minutes: 40%
Core 0: CPU utilization for five seconds: 39%, one minute: 37%, five minutes: 39%
Core 1: CPU utilization for five seconds: 41%, one minute: 38%, five minutes: 40%
Core 2: CPU utilization for five seconds: 30%, one minute: 38%, five minutes: 40%
Core 3: CPU utilization for five seconds: 37%, one minute: 39%, five minutes: 41%
   Pid    PPid    5Sec    1Min    5Min  Status        Size  Name
--------------------------------------------------------------------------------
 22701   22439     89%     88%     88%  R       2187444224  linux_iosd-imag
 11626   11064     46%     47%     48%  S       2476175360  fed main event
  4585       2      7%      9%      9%  S                0  lsmpi-xmit
  4586       2      3%      6%      6%  S                0  lsmpi-rx
步骤2.调查FED将数据包传送到控制平面的原因
步骤1.您可以断定IOSd/ARP进程运行较高,但它是从数据平面引入的流量的牺牲品。需要进一步调查FED进程为什么将流量传送到CPU以及此流量来自何处。
提show platform software fed switch active punt cause summary供了弃用原因的简要概述。此命令多次运行后递增的任何数字均表示:
Switch#show platform software fed switch active punt cause summary
Statistics for all causes

Cause    Cause Info                                       Rcvd         Dropped
------------------------------------------------------------------------------
7        ARP request or response                          18444227     0
11       For-us data                                      16           0
21       RP<->QFP keepalive                               3367         0
24       Glean adjacency                                  2            0
55       For-us control                                   6787         0
60       IP subnet or broadcast packet                    14           0
96       Layer2 control protocols                         3548         0
------------------------------------------------------------------------------
从FED发送到控制平面的数据包使用分割队列结构以确保高优先级控制流量。它不会丢失在低优先级流量(如ARP)之后。可使用查看这些队列的高级概述show platform software fed switch active cpu-interface。多次运行此命令后,您会发现(Forus ResolutionForus -表示发往CPU的流量)队列增长迅速。
Switch#show platform software fed switch active cpu-interface
queue                      retrieved   dropped     invalid     hol-block
-------------------------------------------------------------------------
Routing Protocol           8182        0           0           0
L2 Protocol                161         0           0           0
sw forwarding              2           0           0           0
broadcast                  14          0           0           0
icmp gen                   0           0           0           0
icmp redirect              0           0           0           0
logging                    0           0           0           0
rpf-fail                   0           0           0           0
DOT1X authentication       0           0           0           0
Forus Traffic              16          0           0           0
Forus Resolution           24097779    0           0           0
Inter FED                  0           0           0           0
L2 LVX control             0           0           0           0
EWLC control               0           0           0           0
EWLC data                  0           0           0           0
L2 LVX data                0           0           0           0
Learning cache             0           0           0           0
Topology control           4117        0           0           0
Proto snooping             0           0           0           0
DHCP snooping              0           0           0           0
Transit Traffic            0           0           0           0
Multi End station          0           0           0           0
Webauth                    0           0           0           0
Crypto control             0           0           0           0
Exception                  0           0           0           0
General Punt               0           0           0           0
NFL sampled data           0           0           0           0
Low latency                0           0           0           0
EGR exception              0           0           0           0
FSS                        0           0           0           0
Multicast data             0           0           0           0
Gold packet                0           0           0           0
使用可提供show platform software fed switch active punt cpuq all这些队列的更详细视图。队列5负责ARP,并在多次运行该命令时如预期递增。此show plat soft fed sw active inject cpuq clear命令可用于清除计数器以便更容易读取。
Switch#show platform software fed switch active punt cpuq all
<snip>
CPU Q Id                       : 5
CPU Q Name                     : CPU_Q_FORUS_ADDR_RESOLUTION
Packets received from ASIC     : 21018219
Send to IOSd total attempts    : 21018219
Send to IOSd failed count      : 0
RX suspend count               : 0
RX unsuspend count             : 0
RX unsuspend send count        : 0
RX unsuspend send failed count : 0
RX consumed count              : 0
RX dropped count               : 0
RX non-active dropped count    : 0
RX conversion failure dropped  : 0
RX INTACK count                : 1050215
RX packets dq'd after intack   : 90
Active RxQ event               : 3677400
RX spurious interrupt          : 1050016
<snip>
从这里出发,有几个选择。ARP是广播流量,因此您可以查找广播流量速率异常高的接口(对于排除第2层环路故障也很有用)。 需要多次运行此命令,以确定哪个接口主动增加。
Switch#show interfaces counters

Port            InOctets    InUcastPkts    InMcastPkts    InBcastPkts
Gi1/0/1    1041141009678              9              0    16267828358
Gi1/0/2             1254             11              0              1
Gi1/0/3                0              0              0              0
Gi1/0/4                0              0              0              0
另一种方法是使用嵌入式数据包捕获(EPC)工具,以收集在控制平面看到的数据包示例。
Switch#monitor capture cpuCap control-plane in match any file location flash:cpuCap.pcap
Switch#show monitor capture cpuCap

Status Information for Capture cpuCap
  Target Type:
 Interface: Control Plane, Direction: IN
   Status : Inactive
  Filter Details:
    Capture all packets
  Buffer Details:
   Buffer Type: LINEAR (default)
  File Details:
   Associated file name: flash:cpuCap.pcap
  Limit Details:
   Number of Packets to capture: 0 (no limit)
   Packet Capture duration: 0 (no limit)
   Packet Size to capture: 0 (no limit)
   Packet sampling rate: 0 (no sampling)
此命令在交换机上配置内部捕获,以捕获发送到控制平面的所有流量。此流量将保存到闪存中的文件。这是一个普通文件wireshark pcap,可以从交换机导出并在Wireshark中打开以供进一步分析。
开始捕获,让它运行几秒钟,然后停止捕获:
Switch#monitor capture cpuCap start
Enabling Control plane capture may seriously impact system performance. Do you want to continue? [yes/no]: yes
Started capture point : cpuCap
*Jun 14 17:57:43.172: %BUFCAP-6-ENABLE: Capture Point cpuCap enabled.
Switch#monitor capture cpuCap stop
Capture statistics collected at software:
        Capture duration - 59 seconds
        Packets received - 215950
        Packets dropped - 0
        Packets oversized - 0

Bytes dropped in asic - 0

Stopped capture point : cpuCap
Switch#
*Jun 14 17:58:37.884: %BUFCAP-6-DISABLE: Capture Point cpuCap disabled.
也可以查看交换机上的捕获文件:
Switch#show monitor capture file flash:cpuCap.pcap
Starting the packet display ........ Press Ctrl + Shift + 6 to exit

  1   0.000000 Xerox_d7:67:a1 -> Broadcast    ARP 60 Who has 192.168.1.24? Tell 192.168.1.2
  2   0.000054 Xerox_d7:67:a1 -> Broadcast    ARP 60 Who has 192.168.1.24? Tell 192.168.1.2
  3   0.000082 Xerox_d7:67:a1 -> Broadcast    ARP 60 Who has 192.168.1.24? Tell 192.168.1.2
  4   0.000109 Xerox_d7:67:a1 -> Broadcast    ARP 60 Who has 192.168.1.24? Tell 192.168.1.2
  5   0.000136 Xerox_d7:67:a1 -> Broadcast    ARP 60 Who has 192.168.1.24? Tell 192.168.1.2
  6   0.000162 Xerox_d7:67:a1 -> Broadcast    ARP 60 Who has 192.168.1.24? Tell 192.168.1.2
  7   0.000188 Xerox_d7:67:a1 -> Broadcast    ARP 60 Who has 192.168.1.24? Tell 192.168.1.2
  8   0.000214 Xerox_d7:67:a1 -> Broadcast    ARP 60 Who has 192.168.1.24? Tell 192.168.1.2
  9   0.000241 Xerox_d7:67:a1 -> Broadcast    ARP 60 Who has 192.168.1.24? Tell 192.168.1.2
从该输出可以明显看出,192.168.1.2主机是导致交换机上CPU使用率较高的常量ARP的来源。使用show ip arpshow mac address-table address 命令可跟踪主机,将其从网络中移除或对ARP进行寻址。也可以使用capture view命令中的detail选项获取捕获的每个数据包的完整详细信息show monitor capture file flash:cpuCap.pcap detail。有关Catalyst交换机上数据包捕获的详细信息,请参阅本指南。
案例研究2.使用CoPP重定向IP
默认情况下,最新一代的Catalyst交换机受控制平面策略(CoPP)保护。CoPP用于保护CPU免受恶意攻击和错误配置,这些攻击和错误配置可能会危害交换机的能力,从而维护生成树和路由协议等关键功能。这些保护可能导致出现以下情况:交换机的CPU和清除接口计数器仅略微升高,但流量在经过交换机时被丢弃。在正常操作时注意设备上的基线CPU利用率非常重要。CPU使用率提高并不一定是个问题,这取决于设备上启用的功能,但当此使用率增加且配置未发生更改时,这可能是一个值得关注的问题。
考虑此场景 — 位于网关交换机之外的主机报告下载速度缓慢以及到internet的ping丢失。交换机的常规运行状况检查不会显示接口上的错误,也不会显示来自网关交换机的任何ping丢失。

当您检查CPU时,它显示由于中断而稍有提升的数字。
Switch#show processes cpu sorted | ex 0.00
CPU utilization for five seconds: 8%/7%; one minute: 8%; five minutes: 8%
 PID Runtime(ms)     Invoked      uSecs   5Sec   1Min   5Min TTY Process
 122      913359     1990893        458  0.39%  1.29%  1.57%   0 IOSXE-RP Punt Se
 147        5823       16416        354  0.07%  0.05%  0.06%   0 PLFM-MGR IPC pro
 404       13237      183032         72  0.07%  0.08%  0.07%   0 MMA DP TIMER
当您检查CPU接口时,您会看到ICMP重定向计数器正在主动递增。
Switch#show platform software fed switch active cpu-interface
queue                      retrieved   dropped     invalid     hol-block
-------------------------------------------------------------------------
Routing Protocol           12175       0           0           0
L2 Protocol                236         0           0           0
sw forwarding              714673      0           0           0
broadcast                  2           0           0           0
icmp gen                   0           0           0           0
icmp redirect              2662788     0           0           0
logging                    7           0           0           0
rpf-fail                   0           0           0           0
DOT1X authentication       0           0           0           0
Forus Traffic              21776434    0           0           0
Forus Resolution           724021      0           0           0
Inter FED                  0           0           0           0
L2 LVX control             0           0           0           0
EWLC control               0           0           0           0
EWLC data                  0           0           0           0
L2 LVX data                0           0           0           0
Learning cache             0           0           0           0
Topology control           6122        0           0           0
Proto snooping             0           0           0           0
DHCP snooping              0           0           0           0
Transit Traffic            0           0           0           0
虽然FED中没有发现丢弃,但如果您选中CoPP,则可以在ICMP重定向队列中观察到丢弃。
Switch#show platform hardware fed switch 1 qos queue stats internal cpu policer

                         CPU Queue Statistics
============================================================================================
                                              (default)  (set)     Queue
QId PlcIdx  Queue Name                Enabled   Rate     Rate      Drop(Bytes)
-----------------------------------------------------------------------------
0    11     DOT1X Auth                  Yes     1000      1000     0
1    1      L2 Control                  Yes     2000      2000     0
2    14     Forus traffic               Yes     4000      4000     0
3    0      ICMP GEN                    Yes     600       600      0
4    2      Routing Control             Yes     5400      5400     0
5    14     Forus Address resolution    Yes     4000      4000     0
6    0      ICMP Redirect               Yes     600       600      463538463
7    16     Inter FED Traffic           Yes     2000      2000     0
8    4      L2 LVX Cont Pack            Yes     1000      1000     0
<snip>
CoPP实质上是置于设备控制平面上的QoS策略。CoPP的工作方式与交换机上的任何其他QoS相同:当特定流量的队列用尽时,使用该队列的流量会被丢弃。从这些输出中,您知道由于ICMP重定向正在对流量进行软件交换,并且您知道由于ICMP重定向队列的速率限制,此流量将被丢弃。您可以在控制平面上完成捕获,以验证到达控制平面的数据包是否来自用户。
为了查看每个类使用哪些匹配逻辑,您有一个CLI来帮助识别命中特定队列的数据包类型。请考虑以下示例,以便了解哪些内容命中system-cpp-routing-control类:
Switch#show platform software qos copp policy-info
Default rates of all classmaps are displayed:
 policy-map system-cpp-policy
 class system-cpp-police-routing-control
 police rate 5400 pps

Switch#show platform software qos copp class-info
ACL representable classmap filters are displayed:
class-map match-any system-cpp-police-routing-control
 description Routing control and Low Latency
 match access-group name system-cpp-mac-match-routing-control
 match access-group name system-cpp-ipv4-match-routing-control
 match access-group name system-cpp-ipv6-match-routing-control
 match access-group name system-cpp-ipv4-match-low-latency
 match access-group name system-cpp-ipv6-match-low-latency

mac access-list extended system-cpp-mac-match-routing-control
 permit any host 0180.C200.0014
 permit any host 0900.2B00.0004
 ip access-list extended system-cpp-ipv4-match-routing-control
 permit udp any any eq rip
 <...snip...>
 ipv6 access-list system-cpp-ipv6-match-routing-control
 permit ipv6 any FF02::1:FF00:0/104
 permit ipv6 any host FF01::1
<...snip...>
 ip access-list extended system-cpp-ipv4-match-low-latency
 permit udp any any eq 3784
 permit udp any any eq 3785
 ipv6 access-list system-cpp-ipv6-match-low-latency
 permit udp any any eq 3784
 permit udp any any eq 3785
 <...snip...>
Switch#monitor capture cpuSPan control-plane in match any file location flash:cpuCap.pcap
Control-plane direction IN is already attached to the capture
Switch#monitor capture cpuSpan start

Enabling Control plane capture may seriously impact system performance. Do you want to continue? [yes/no]: yes
Started capture point : cpuSpan
Switch#
*Jun 15 17:28:52.841: %BUFCAP-6-ENABLE: Capture Point cpuSpan enabled.
Switch#monitor capture cpuSpan stop
Capture statistics collected at software:
        Capture duration - 12 seconds
        Packets received - 5751
        Packets dropped - 0
        Packets oversized - 0

Bytes dropped in asic - 0

Stopped capture point : cpuSpan
Switch#
*Jun 15 17:29:02.415: %BUFCAP-6-DISABLE: Capture Point cpuSpan disabled.
Switch#show monitor capture file flash:cpuCap.pcap detailed
Starting the packet display ........ Press Ctrl + Shift + 6 to exit

Frame 1: 60 bytes on wire (480 bits), 60 bytes captured (480 bits) on interface 0
<snip>
Ethernet II, Src: OmronTat_2c:a1:52 (00:00:0a:2c:a1:52), Dst: Cisco_8f:cb:47 (00:42:5a:8f:cb:47)
<snip>
Internet Protocol Version 4, Src: 192.168.1.10, Dst: 8.8.8.8

<snip>
当此主机ping 8.8.8.8时,它会将ping发送到网关的MAC地址,因为目的地址在VLAN之外。网关交换机检测到下一跳处于同一个VLAN中,将目的MAC地址重写到防火墙,然后转发数据包。此过程可能会在硬件中发生,但此硬件转发的例外是IP重定向过程。当交换机收到ping命令时,它检测到它正在同一个VLAN上路由流量,并将该流量传送到CPU,以便生成重定向数据包返回主机。此重定向消息用于通知主机存在通往目标的更佳路径。在本例中,第2层下一跳是设计且预期的,必须将交换机配置为不发送重定向消息并在硬件中转发数据包。当您在VLAN接口上禁用重定向时,即可完成此操作。
interface Vlan1
 ip address 192.168.1.1 255.255.255.0
 no ip redirects
end
当IP重定向关闭时,交换机将重写MAC地址并在硬件中转发。
案例研究3.间歇性高CPU
如果交换机上的CPU使用率过高,可以在交换机上设置脚本,以便在发生高CPU事件时自动运行这些命令。这可通过使用Cisco IOS嵌入式事件管理器(EEM)来完成。
输入值用于在脚本触发之前确定CPU使用率。该脚本监控5秒的CPU平均SNMP OID。两个文件写入闪存tac-cpu-
,包含命令输出和tac-cpu-
CPU入口捕获。这些文件随后可以查看。
config t
no event manager applet high-cpu authorization bypass
event manager applet high-cpu authorization bypass
event snmp oid 1.3.6.1.4.1.9.9.109.1.1.1.1.3.1 get-type next entry-op gt entry-val 80 poll-interval 1 ratelimit 300 maxrun 180
action 0.01 syslog msg "High CPU detected, gathering system information."
action 0.02 cli command "enable"
action 0.03 cli command "term exec prompt timestamp"
action 0.04 cli command "term length 0"
action 0.05 cli command "show clock"
action 0.06 regex "([0-9]|[0-9][0-9]):([0-9]|[0-9][0-9]):([0-9]|[0-9][0-9])" $_cli_result match match1
action 0.07 string replace "$match" 2 2 "."
action 0.08 string replace "$_string_result" 5 5 "."
action 0.09 set time $_string_result
action 1.01 cli command "show proc cpu sort | append flash:tac-cpu-$time.txt"
action 1.02 cli command "show proc cpu hist | append flash:tac-cpu-$time.txt"
action 1.03 cli command "show proc cpu platform sorted | append flash:tac-cpu-$time.txt"
action 1.04 cli command "show interface | append flash:tac-cpu-$time.txt"
action 1.05 cli command "show interface stats | append flash:tac-cpu-$time.txt"
action 1.06 cli command "show log | append flash:tac-cpu-$time.txt"
action 1.07 cli command "show ip traffic | append flash:tac-cpu-$time.txt"
action 1.08 cli command "show users | append flash:tac-cpu-$time.txt"
action 1.09 cli command "show platform software fed switch active punt cause summary | append flash:tac-cpu-$time.txt"
action 1.10 cli command "show platform software fed switch active cpu-interface | append flash:tac-cpu-$time.txt"
action 1.11 cli command "show platform software fed switch active punt cpuq all | append flash:tac-cpu-$time.txt"
action 2.08 cli command "no monitor capture tac_cpu"
action 2.09 cli command "monitor capture tac_cpu control-plane in match any file location flash:tac-cpu-$time.pcap"
action 2.10 cli command "monitor capture tac_cpu start" pattern "yes"
action 2.11 cli command "yes"
action 2.12 wait 10
action 2.13 cli command "monitor capture tac_cpu stop"
action 3.01 cli command "term default length"
action 3.02 cli command "terminal no exec prompt timestamp"
action 3.03 cli command "no monitor capture tac_cpu"
相关信息
修订历史记录
| 版本 | 发布日期 | 备注 |
|---|---|---|
2.0 |
13-Mar-2024
|
重新认证 |
1.0 |
08-Aug-2018
|
初始版本 |
由思科工程师提供
- 雷蒙德·怀廷软件工程师
 反馈
反馈