Probleemoplossing voor CPU-gebruik in Catalyst-Switches op Cisco IOS XE 16.x
Downloadopties
Inclusief taalgebruik
De documentatie van dit product is waar mogelijk geschreven met inclusief taalgebruik. Inclusief taalgebruik wordt in deze documentatie gedefinieerd als taal die geen discriminatie op basis van leeftijd, handicap, gender, etniciteit, seksuele oriëntatie, sociaaleconomische status of combinaties hiervan weerspiegelt. In deze documentatie kunnen uitzonderingen voorkomen vanwege bewoordingen die in de gebruikersinterfaces van de productsoftware zijn gecodeerd, die op het taalgebruik in de RFP-documentatie zijn gebaseerd of die worden gebruikt in een product van een externe partij waarnaar wordt verwezen. Lees meer over hoe Cisco gebruikmaakt van inclusief taalgebruik.
Over deze vertaling
Cisco heeft dit document vertaald via een combinatie van machine- en menselijke technologie om onze gebruikers wereldwijd ondersteuningscontent te bieden in hun eigen taal. Houd er rekening mee dat zelfs de beste machinevertaling niet net zo nauwkeurig is als die van een professionele vertaler. Cisco Systems, Inc. is niet aansprakelijk voor de nauwkeurigheid van deze vertalingen en raadt aan altijd het oorspronkelijke Engelstalige document (link) te raadplegen.
Inhoud
Inleiding
Dit document beschrijft hoe u problemen kunt oplossen bij hoog CPU-gebruik door onderbrekingen op Cisco IOS® XE-platforms waarop de 16.x-releases worden uitgevoerd.
Achtergrondinformatie
Dit document is bijgedragen door Raymond Whiting en Yogesh Ramdoss, Cisco TAC Engineers.
Dit document introduceert ook verschillende nieuwe opdrachten op dit platform die integraal zijn om problemen met de hoge CPU-gebruiksproblemen op te lossen. Het is belangrijk om te begrijpen hoe Cisco IOS XE wordt gebouwd. Met Cisco IOS XE is Cisco overgestapt op een Linux-kernel en zijn alle subsystemen opgesplitst in processen. Alle subsystemen die zich eerder in Cisco IOS bevonden - zoals de moduledrivers, High Availability (HA) enzovoort - worden nu uitgevoerd als softwareprocessen binnen het Linux Operating System (OS). Cisco IOS zelf wordt uitgevoerd als een daemon binnen het Linux-OS (IOSd). Cisco IOS XE behoudt niet alleen dezelfde look en feel van de klassieke Cisco IOS, maar ook de werking, ondersteuning en het beheer.
Hier zijn een paar handige definities:
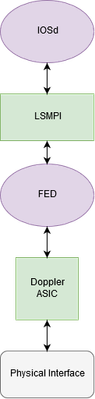
- Forwarding Engine Driver (FED): Dit is het hart van de Cisco Catalyst switch en is verantwoordelijk voor alle hardwareprogrammering/doorsturen.
- IOSd: Dit is de Cisco IOS-daemon die op de Linux-kernel draait. Het wordt uitgevoerd als een softwareproces binnen de kernel.
- Packet Delivery System (PDS): Dit is de architectuur en het proces van hoe pakketten worden geleverd aan en van de verschillende subsystemen. Zo wordt bijvoorbeeld bepaald hoe pakketten van de FED aan IOSd worden geleverd en omgekeerd.
- Bedieningsplane (CP): Het besturingsplane is een generieke term die wordt gebruikt om de functies en het verkeer te groeperen die de CPU van de Catalyst Switch omvatten. Dit omvat verkeer zoals Spanning Tree Protocol (STP), Hot Standby Router Protocol (HSRP) en routeringsprotocollen die bestemd zijn voor de switch of die vanaf de switch worden verzonden. Dit omvat ook toepassingslaagprotocollen zoals Secure Shell (SSH) en Simple Network Management Protocol (SNMP) die door de CPU moeten worden verwerkt.
- Gegevensvlak (DP): Meestal omvat het gegevensvlak de hardware-ASIC's en het verkeer dat wordt doorgestuurd zonder hulp van het besturingsplane.
- Punt: Ingress-protocolcontrolepakket onderschept door DP verzonden naar de CP om het te verwerken.
- Injecteren: CP gegenereerd protocolpakket verzonden naar DP om te vertrekken naar de IO-interface(s).
- LSMPI: Linux gedeelde geheugen punt interface.
Een diagram op hoog niveau van het communicatiepad tussen het gegevensplane en het besturingsplane:
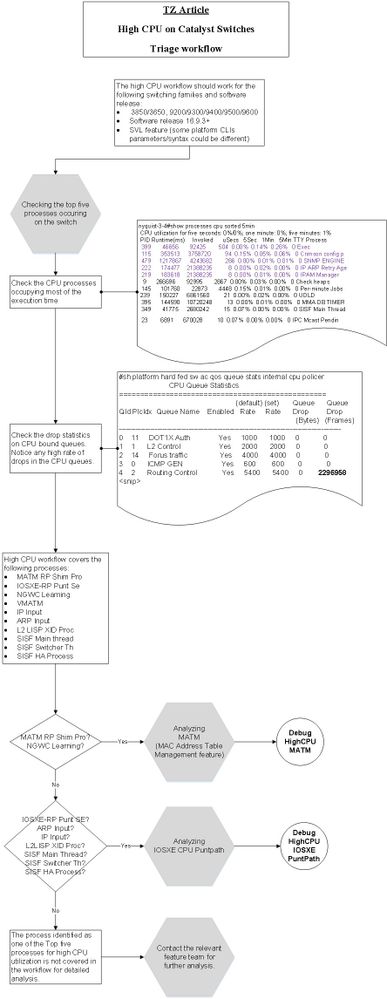
Werkstroom voor hoge CPU-probleemoplossing
Deze paragraaf geeft een systematische workflow om hoge CPU problemen op de switches te testen. Merk op dat dit een geselecteerd proces betreft op het moment dat u deze sectie schrijft.
Case Study 1. Protocol voor adresoplossing onderbreekt
Het proces voor probleemoplossing en verificatie in deze sectie kan vanwege onderbrekingen breed worden gebruikt voor een hoog CPU-gebruik.
Stap 1. Identificeer het proces dat CPU-cycli verbruikt
Hetshow process cpucommando wordt gebruikt om de huidige processtatus binnen de IOSd daemon weer te geven. Wanneer u de output toevoegt wijzig| exclude 0.00
Er zijn twee waardevolle stukken informatie van deze output:
- CPU-gebruik gedurende vijf seconden: 91% / 30%
- Het eerste getal (91%) is het totale CPU-gebruik van de switch
- Het tweede getal (30%) is het gebruik veroorzaakt door onderbrekingen van het dataplatform
- Het proces van het Protocol van de Resolutie van het Adres
(ARP) Inputis momenteel het hoogste proces van Cisco IOS dat de middelen verbruikt:
Switch# show processes cpu sort | ex 0.00
CPU utilization for five seconds: 91%/30%; one minute: 30%; five minutes: 8%
 PID Runtime(ms)     Invoked      uSecs   5Sec   1Min   5Min TTY Process
  37       14645         325      45061 59.53% 18.86%  4.38%   0 ARP Input
 137        2288         115      19895  1.20%  0.14%  0.07%   0 Per-minute Jobs
 373        2626       35334         74  0.15%  0.11%  0.09%   0 MMA DB TIMER
 218        3123       69739         44  0.07%  0.09%  0.12%   0 IP ARP Retry Age
 404        2656       35333         75  0.07%  0.09%  0.09%   0 MMA DP TIMER
show processes cpu platform sortedDe opdracht wordt gebruikt om weer te geven hoe het procesgebruik van de Linux kernel eruit ziet. Uit de output kan worden opgemaakt dat het FED-proces hoog is, als gevolg van de ARP-verzoeken die aan het IOSd-proces zijn doorgegeven:
Switch# show processes cpu platform sorted
CPU utilization for five seconds: 38%, one minute: 38%, five minutes: 40%
Core 0: CPU utilization for five seconds: 39%, one minute: 37%, five minutes: 39%
Core 1: CPU utilization for five seconds: 41%, one minute: 38%, five minutes: 40%
Core 2: CPU utilization for five seconds: 30%, one minute: 38%, five minutes: 40%
Core 3: CPU utilization for five seconds: 37%, one minute: 39%, five minutes: 41%
   Pid    PPid    5Sec    1Min    5Min  Status        Size  Name
--------------------------------------------------------------------------------
 22701   22439     89%     88%     88%  R       2187444224  linux_iosd-imag
 11626   11064     46%     47%     48%  S       2476175360  fed main event
  4585       2      7%      9%      9%  S                0  lsmpi-xmit
  4586       2      3%      6%      6%  S                0  lsmpi-rx
Stap 2. Onderzoeken waarom de FED pakketten doorgeeft aan het besturingsplane
Van Stap 1. U kunt concluderen dat het IOSd/ARP proces hoog loopt maar het slachtoffer van verkeer is dat van het Dataplane wordt geïntroduceerd. Er is verder onderzoek nodig naar de vraag waarom het FED-proces verkeer naar de CPU stuurt en waar dit verkeer vandaan komt.
Hetshow platform software fed switch active punt cause summarygeeft een overzicht op hoog niveau van de reden van het punt. Een willekeurig getal dat wordt verhoogd via meerdere runs van deze opdracht geeft:
Switch#show platform software fed switch active punt cause summary
Statistics for all causes

Cause    Cause Info                                       Rcvd         Dropped
------------------------------------------------------------------------------
7        ARP request or response                          18444227     0
11       For-us data                                      16           0
21       RP<->QFP keepalive                               3367         0
24       Glean adjacency                                  2            0
55       For-us control                                   6787         0
60       IP subnet or broadcast packet                    14           0
96       Layer2 control protocols                         3548         0
------------------------------------------------------------------------------
Pakketten die vanuit de FED naar het controlevliegtuig worden verzonden, maken gebruik van een gesplitste wachtrijstructuur om prioriteitscontroleverkeer te garanderen. Het gaat niet verloren achter verkeer met een lagere prioriteit, zoals ARP. Een overzicht op hoog niveau van deze wachtrijen kan worden bekeken met het gebruik van deshow platform software fed switch active cpu-interface. Nadat u deze opdracht meerdere malen hebt uitgevoerd, kan worden gevonden dat deForus Resolution(Forus - dat betekent verkeer bestemd voor de CPU) wachtrij snel toeneemt.
Switch#show platform software fed switch active cpu-interface
queue                      retrieved   dropped     invalid     hol-block
-------------------------------------------------------------------------
Routing Protocol           8182        0           0           0
L2 Protocol                161         0           0           0
sw forwarding              2           0           0           0
broadcast                  14          0           0           0
icmp gen                   0           0           0           0
icmp redirect              0           0           0           0
logging                    0           0           0           0
rpf-fail                   0           0           0           0
DOT1X authentication       0           0           0           0
Forus Traffic              16          0           0           0
Forus Resolution           24097779    0           0           0
Inter FED                  0           0           0           0
L2 LVX control             0           0           0           0
EWLC control               0           0           0           0
EWLC data                  0           0           0           0
L2 LVX data                0           0           0           0
Learning cache             0           0           0           0
Topology control           4117        0           0           0
Proto snooping             0           0           0           0
DHCP snooping              0           0           0           0
Transit Traffic            0           0           0           0
Multi End station          0           0           0           0
Webauth                    0           0           0           0
Crypto control             0           0           0           0
Exception                  0           0           0           0
General Punt               0           0           0           0
NFL sampled data           0           0           0           0
Low latency                0           0           0           0
EGR exception              0           0           0           0
FSS                        0           0           0           0
Multicast data             0           0           0           0
Gold packet                0           0           0           0
Het gebruik van hetshow platform software fed switch active punt cpuq allgeeft een gedetailleerder beeld van deze wachtrijen. Wachtrij 5 is verantwoordelijk voor ARP en zoals verwacht wordt deze verhoogd over meerdere looppas van de opdracht. show plat soft fed sw active inject cpuq clearDe opdracht kan worden gebruikt om de tellers te wissen voor een eenvoudige lezing.
Switch#show platform software fed switch active punt cpuq all
<snip>
CPU Q Id                       : 5
CPU Q Name                     : CPU_Q_FORUS_ADDR_RESOLUTION
Packets received from ASIC     : 21018219
Send to IOSd total attempts    : 21018219
Send to IOSd failed count      : 0
RX suspend count               : 0
RX unsuspend count             : 0
RX unsuspend send count        : 0
RX unsuspend send failed count : 0
RX consumed count              : 0
RX dropped count               : 0
RX non-active dropped count    : 0
RX conversion failure dropped  : 0
RX INTACK count                : 1050215
RX packets dq'd after intack   : 90
Active RxQ event               : 3677400
RX spurious interrupt          : 1050016
<snip>
Vanaf hier zijn er een paar opties. ARP is uitzendingsverkeer, zodat kunt u interfaces zoeken die een abnormaal hoog tarief van uitzendingsverkeer hebben (ook nuttig om Layer 2 lijnen problemen op te lossen). Het is noodzakelijk om deze opdracht meerdere malen uit te voeren om te bepalen welke interface actief toeneemt.
Switch#show interfaces counters

Port            InOctets    InUcastPkts    InMcastPkts    InBcastPkts
Gi1/0/1    1041141009678              9              0    16267828358
Gi1/0/2             1254             11              0              1
Gi1/0/3                0              0              0              0
Gi1/0/4                0              0              0              0
De andere optie is om het ingesloten pakketvastlegging (EPC) te gebruiken om een voorbeeld te nemen van de pakketten die op het controlevlak worden gezien.
Switch#monitor capture cpuCap control-plane in match any file location flash:cpuCap.pcap
Switch#show monitor capture cpuCap

Status Information for Capture cpuCap
  Target Type:
 Interface: Control Plane, Direction: IN
   Status : Inactive
  Filter Details:
    Capture all packets
  Buffer Details:
   Buffer Type: LINEAR (default)
  File Details:
   Associated file name: flash:cpuCap.pcap
  Limit Details:
   Number of Packets to capture: 0 (no limit)
   Packet Capture duration: 0 (no limit)
   Packet Size to capture: 0 (no limit)
   Packet sampling rate: 0 (no sampling)
Deze opdracht configureert een interne opname op de switch om verkeer op te nemen dat naar het besturingsplane wordt gestraft. Dit verkeer wordt opgeslagen in een bestand op de flitser. Dit is een normaalwireshark pcapbestand dat kan worden geëxporteerd van een switch en geopend in Wireshark voor verdere analyse.
Start de opname, laat deze enkele seconden lopen en stop de opname:
Switch#monitor capture cpuCap start
Enabling Control plane capture may seriously impact system performance. Do you want to continue? [yes/no]: yes
Started capture point : cpuCap
*Jun 14 17:57:43.172: %BUFCAP-6-ENABLE: Capture Point cpuCap enabled.
Switch#monitor capture cpuCap stop
Capture statistics collected at software:
        Capture duration - 59 seconds
        Packets received - 215950
        Packets dropped - 0
        Packets oversized - 0

Bytes dropped in asic - 0

Stopped capture point : cpuCap
Switch#
*Jun 14 17:58:37.884: %BUFCAP-6-DISABLE: Capture Point cpuCap disabled.
Het is ook mogelijk om het opnamebestand op de switch te bekijken:
Switch#show monitor capture file flash:cpuCap.pcap
Starting the packet display ........ Press Ctrl + Shift + 6 to exit

  1   0.000000 Xerox_d7:67:a1 -> Broadcast    ARP 60 Who has 192.168.1.24? Tell 192.168.1.2
  2   0.000054 Xerox_d7:67:a1 -> Broadcast    ARP 60 Who has 192.168.1.24? Tell 192.168.1.2
  3   0.000082 Xerox_d7:67:a1 -> Broadcast    ARP 60 Who has 192.168.1.24? Tell 192.168.1.2
  4   0.000109 Xerox_d7:67:a1 -> Broadcast    ARP 60 Who has 192.168.1.24? Tell 192.168.1.2
  5   0.000136 Xerox_d7:67:a1 -> Broadcast    ARP 60 Who has 192.168.1.24? Tell 192.168.1.2
  6   0.000162 Xerox_d7:67:a1 -> Broadcast    ARP 60 Who has 192.168.1.24? Tell 192.168.1.2
  7   0.000188 Xerox_d7:67:a1 -> Broadcast    ARP 60 Who has 192.168.1.24? Tell 192.168.1.2
  8   0.000214 Xerox_d7:67:a1 -> Broadcast    ARP 60 Who has 192.168.1.24? Tell 192.168.1.2
  9   0.000241 Xerox_d7:67:a1 -> Broadcast    ARP 60 Who has 192.168.1.24? Tell 192.168.1.2
Van deze output, is het duidelijk dat de 192.168.1.2 gastheer de bron van constante ARPs is die hoge CPU op de switch veroorzaken. Gebruik de opdrachtenshow ip arpenshow mac address-table addressom de host te traceren en of het uit het netwerk te verwijderen of de ARP's te adresseren. Het is ook mogelijk om volledige details van elk pakket opgenomen te krijgen met het gebruik van de detailoptie in de opdracht Opname bekijkenshow monitor capture file flash:cpuCap.pcap detail. Raadpleeg deze handleiding voor meer informatie over pakketopnamen op een Catalyst Switch.
Case Study 2. IP-omleiding met CoP
De nieuwste generatie Catalyst Switches worden standaard beschermd door Control Plane Policing (CoPP). CoPP wordt gebruikt om de CPU te beschermen tegen kwaadaardige aanvallen en fouten in configuraties die de capaciteit van de switches in gevaar kunnen brengen om kritieke functies te behouden zoals het overspannen van bomen en het routeren van protocollen. Deze beveiliging kan leiden tot scenario's waarbij de switch slechts een iets verhoogde CPU en duidelijke interfacetellers heeft, maar verkeer wordt gedropt tijdens het passeren van de switch. Het is belangrijk om het basislijn CPU-gebruik op uw apparaat op te merken bij normale bewerkingen. Het is niet per se een probleem om het CPU-gebruik te verhogen en het hangt af van de functies die op het apparaat zijn ingeschakeld, maar wanneer dit gebruik toeneemt zonder configuratiewijzigingen, kan dit een punt van zorg zijn.
Overweeg dit scenario - hosts die leven van de Gateway switch melden langzame downloadsnelheden en ping verlies aan het internet. Een algemene gezondheidscontrole van de switch toont geen fouten op de interfaces of om het even welk pingverlies wanneer afkomstig van de gateway switch.

Als je de CPU controleert, zie je iets verhoogde getallen door onderbrekingen.
Switch#show processes cpu sorted | ex 0.00
CPU utilization for five seconds: 8%/7%; one minute: 8%; five minutes: 8%
 PID Runtime(ms)     Invoked      uSecs   5Sec   1Min   5Min TTY Process
 122      913359     1990893        458  0.39%  1.29%  1.57%   0 IOSXE-RP Punt Se
 147        5823       16416        354  0.07%  0.05%  0.06%   0 PLFM-MGR IPC pro
 404       13237      183032         72  0.07%  0.08%  0.07%   0 MMA DP TIMER
Wanneer u de CPU-interface controleert, ziet u dat de ICMP-omleidingsteller actief wordt verhoogd.
Switch#show platform software fed switch active cpu-interface
queue                      retrieved   dropped     invalid     hol-block
-------------------------------------------------------------------------
Routing Protocol           12175       0           0           0
L2 Protocol                236         0           0           0
sw forwarding              714673      0           0           0
broadcast                  2           0           0           0
icmp gen                   0           0           0           0
icmp redirect              2662788     0           0           0
logging                    7           0           0           0
rpf-fail                   0           0           0           0
DOT1X authentication       0           0           0           0
Forus Traffic              21776434    0           0           0
Forus Resolution           724021      0           0           0
Inter FED                  0           0           0           0
L2 LVX control             0           0           0           0
EWLC control               0           0           0           0
EWLC data                  0           0           0           0
L2 LVX data                0           0           0           0
Learning cache             0           0           0           0
Topology control           6122        0           0           0
Proto snooping             0           0           0           0
DHCP snooping              0           0           0           0
Transit Traffic            0           0           0           0
Terwijl er geen druppels worden waargenomen bij de FED, kunnen druppels worden waargenomen in de ICMP Redirect-wachtrij als u CoPP controleert.
Switch#show platform hardware fed switch 1 qos queue stats internal cpu policer

                         CPU Queue Statistics
============================================================================================
                                              (default)  (set)     Queue
QId PlcIdx  Queue Name                Enabled   Rate     Rate      Drop(Bytes)
-----------------------------------------------------------------------------
0    11     DOT1X Auth                  Yes     1000      1000     0
1    1      L2 Control                  Yes     2000      2000     0
2    14     Forus traffic               Yes     4000      4000     0
3    0      ICMP GEN                    Yes     600       600      0
4    2      Routing Control             Yes     5400      5400     0
5    14     Forus Address resolution    Yes     4000      4000     0
6    0      ICMP Redirect               Yes     600       600      463538463
7    16     Inter FED Traffic           Yes     2000      2000     0
8    4      L2 LVX Cont Pack            Yes     1000      1000     0
<snip>
CoPP is in wezen een QoS-beleid dat op het bedieningsvlak van het apparaat is geplaatst. CoPP werkt net als alle andere QoS op de switch: wanneer de wachtrij voor een specifiek verkeer is uitgeput, wordt het verkeer dat die wachtrij gebruikt, verbroken. Van deze output, weet u dat het verkeer software wordt geschakeld wegens ICMP omleidingen, en u weet dat dit verkeer wordt gelaten vallen wegens de tariefgrens op de rij van ICMP Redirect. U kunt een opname op het controlevliegtuig bereiken om te bevestigen dat de pakketten die het controlevliegtuig raken van de gebruikers zijn.
Om te zien welke overeenkomende logica elke klasse gebruikt, hebt u een CLI om te helpen pakkettypes identificeren die een bepaalde rij raken. Neem dit voorbeeld om te weten wat de klasse raaktsystem-cpp-routing-control:
Switch#show platform software qos copp policy-info
Default rates of all classmaps are displayed:
 policy-map system-cpp-policy
 class system-cpp-police-routing-control
 police rate 5400 pps

Switch#show platform software qos copp class-info
ACL representable classmap filters are displayed:
class-map match-any system-cpp-police-routing-control
 description Routing control and Low Latency
 match access-group name system-cpp-mac-match-routing-control
 match access-group name system-cpp-ipv4-match-routing-control
 match access-group name system-cpp-ipv6-match-routing-control
 match access-group name system-cpp-ipv4-match-low-latency
 match access-group name system-cpp-ipv6-match-low-latency

mac access-list extended system-cpp-mac-match-routing-control
 permit any host 0180.C200.0014
 permit any host 0900.2B00.0004
 ip access-list extended system-cpp-ipv4-match-routing-control
 permit udp any any eq rip
 <...snip...>
 ipv6 access-list system-cpp-ipv6-match-routing-control
 permit ipv6 any FF02::1:FF00:0/104
 permit ipv6 any host FF01::1
<...snip...>
 ip access-list extended system-cpp-ipv4-match-low-latency
 permit udp any any eq 3784
 permit udp any any eq 3785
 ipv6 access-list system-cpp-ipv6-match-low-latency
 permit udp any any eq 3784
 permit udp any any eq 3785
 <...snip...>
Switch#monitor capture cpuSPan control-plane in match any file location flash:cpuCap.pcap
Control-plane direction IN is already attached to the capture
Switch#monitor capture cpuSpan start

Enabling Control plane capture may seriously impact system performance. Do you want to continue? [yes/no]: yes
Started capture point : cpuSpan
Switch#
*Jun 15 17:28:52.841: %BUFCAP-6-ENABLE: Capture Point cpuSpan enabled.
Switch#monitor capture cpuSpan stop
Capture statistics collected at software:
        Capture duration - 12 seconds
        Packets received - 5751
        Packets dropped - 0
        Packets oversized - 0

Bytes dropped in asic - 0

Stopped capture point : cpuSpan
Switch#
*Jun 15 17:29:02.415: %BUFCAP-6-DISABLE: Capture Point cpuSpan disabled.
Switch#show monitor capture file flash:cpuCap.pcap detailed
Starting the packet display ........ Press Ctrl + Shift + 6 to exit

Frame 1: 60 bytes on wire (480 bits), 60 bytes captured (480 bits) on interface 0
<snip>
Ethernet II, Src: OmronTat_2c:a1:52 (00:00:0a:2c:a1:52), Dst: Cisco_8f:cb:47 (00:42:5a:8f:cb:47)
<snip>
Internet Protocol Version 4, Src: 192.168.1.10, Dst: 8.8.8.8

<snip>
Wanneer deze gastheer 8.8.8.8 pingelt, verzendt het pingelen naar het adres van MAC van de gateway, aangezien het bestemmingsadres buiten VLAN is. De gateway switch detecteert dat de volgende hop in hetzelfde VLAN staat, herschrijft het MAC-adres van de bestemming naar de firewall en stuurt het pakket door. Dit proces kan in hardware voorkomen, maar een uitzondering op deze hardware-doorsturen is het IP-omleidingsproces. Wanneer de switch de ping ontvangt, detecteert hij dat hij verkeer op hetzelfde VLAN routeert en punteert hij het verkeer naar de CPU om een pakketdoorgifte naar de host te genereren. Dit omleiden bericht is om de host te informeren dat er een meer optimale pad naar de bestemming is. In dit geval is Layer 2 next-hop door ontwerp en verwacht, moet de switch worden geconfigureerd om geen redirect berichten te verzenden en de pakketten in hardware door te sturen. Dit gebeurt wanneer u de omleidingen op de VLAN-interface uitschakelt.
interface Vlan1
 ip address 192.168.1.1 255.255.255.0
 no ip redirects
end
Wanneer IP-omleidingen zijn uitgeschakeld, herschrijft de switch het MAC-adres en doorsturen in de hardware.
Case Study 3. Intermitterende hoge CPU
In het geval dat de hoge CPU op de switch van tijd tot tijd is, is het mogelijk om een script op de switch in te stellen om deze opdrachten automatisch uit te voeren bij hoge CPU-gebeurtenissen. Dit gebeurt met het gebruik van Cisco IOS Embedded Event Manager (EEM).
Het entry-val wordt gebruikt om te bepalen hoe hoog de CPU is voordat het script wordt geactiveerd. Het script bewaakt de gemiddelde SNMP-OID van 5 seconden voor de CPU. Er worden twee bestanden naar de flitser geschreven,tac-cpu-
deze bevat de opdrachtoutput entac-cpu-
de CPU-toegangsopname. Deze bestanden kunnen dan op een later tijdstip worden herzien.
config t
no event manager applet high-cpu authorization bypass
event manager applet high-cpu authorization bypass
event snmp oid 1.3.6.1.4.1.9.9.109.1.1.1.1.3.1 get-type next entry-op gt entry-val 80 poll-interval 1 ratelimit 300 maxrun 180
action 0.01 syslog msg "High CPU detected, gathering system information."
action 0.02 cli command "enable"
action 0.03 cli command "term exec prompt timestamp"
action 0.04 cli command "term length 0"
action 0.05 cli command "show clock"
action 0.06 regex "([0-9]|[0-9][0-9]):([0-9]|[0-9][0-9]):([0-9]|[0-9][0-9])" $_cli_result match match1
action 0.07 string replace "$match" 2 2 "."
action 0.08 string replace "$_string_result" 5 5 "."
action 0.09 set time $_string_result
action 1.01 cli command "show proc cpu sort | append flash:tac-cpu-$time.txt"
action 1.02 cli command "show proc cpu hist | append flash:tac-cpu-$time.txt"
action 1.03 cli command "show proc cpu platform sorted | append flash:tac-cpu-$time.txt"
action 1.04 cli command "show interface | append flash:tac-cpu-$time.txt"
action 1.05 cli command "show interface stats | append flash:tac-cpu-$time.txt"
action 1.06 cli command "show log | append flash:tac-cpu-$time.txt"
action 1.07 cli command "show ip traffic | append flash:tac-cpu-$time.txt"
action 1.08 cli command "show users | append flash:tac-cpu-$time.txt"
action 1.09 cli command "show platform software fed switch active punt cause summary | append flash:tac-cpu-$time.txt"
action 1.10 cli command "show platform software fed switch active cpu-interface | append flash:tac-cpu-$time.txt"
action 1.11 cli command "show platform software fed switch active punt cpuq all | append flash:tac-cpu-$time.txt"
action 2.08 cli command "no monitor capture tac_cpu"
action 2.09 cli command "monitor capture tac_cpu control-plane in match any file location flash:tac-cpu-$time.pcap"
action 2.10 cli command "monitor capture tac_cpu start" pattern "yes"
action 2.11 cli command "yes"
action 2.12 wait 10
action 2.13 cli command "monitor capture tac_cpu stop"
action 3.01 cli command "term default length"
action 3.02 cli command "terminal no exec prompt timestamp"
action 3.03 cli command "no monitor capture tac_cpu"
Gerelateerde informatie
- Cisco IOS XE 16 in één oogopslag
- Hoog CPU-gebruik van Catalyst 3850 Series switch troubleshooten
- Geïntegreerde pakketvastlegging voor Cisco IOS en Cisco IOS XE-configuratievoorbeeld
- Punt/Injecteer FED Packet Capture op Catalyst Switches met Cisco IOS XE 16.x
- Cisco technische ondersteuning en downloads
Revisiegeschiedenis
| Revisie | Publicatiedatum | Opmerkingen |
|---|---|---|
2.0 |
13-Mar-2024
|
Hercertificering |
1.0 |
08-Aug-2018
|
Eerste vrijgave |
Bijgedragen door Cisco-engineers
- Raymond WhitingSoftware engineer
 Feedback
Contact Cisco
- Een ondersteuningscase openen

- (Vereist een Cisco-servicecontract)