Back to top


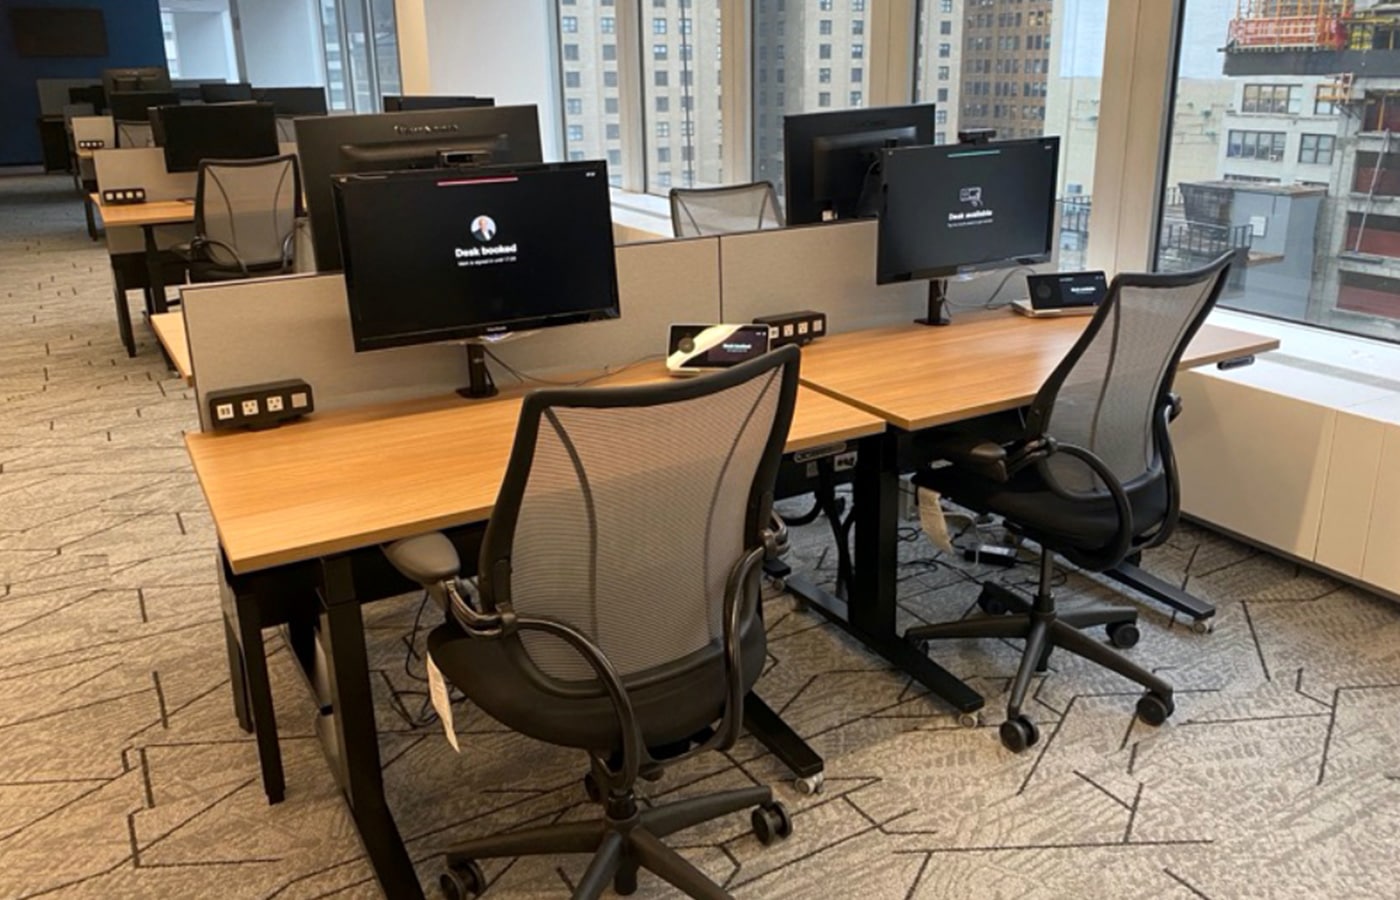
Hot desks
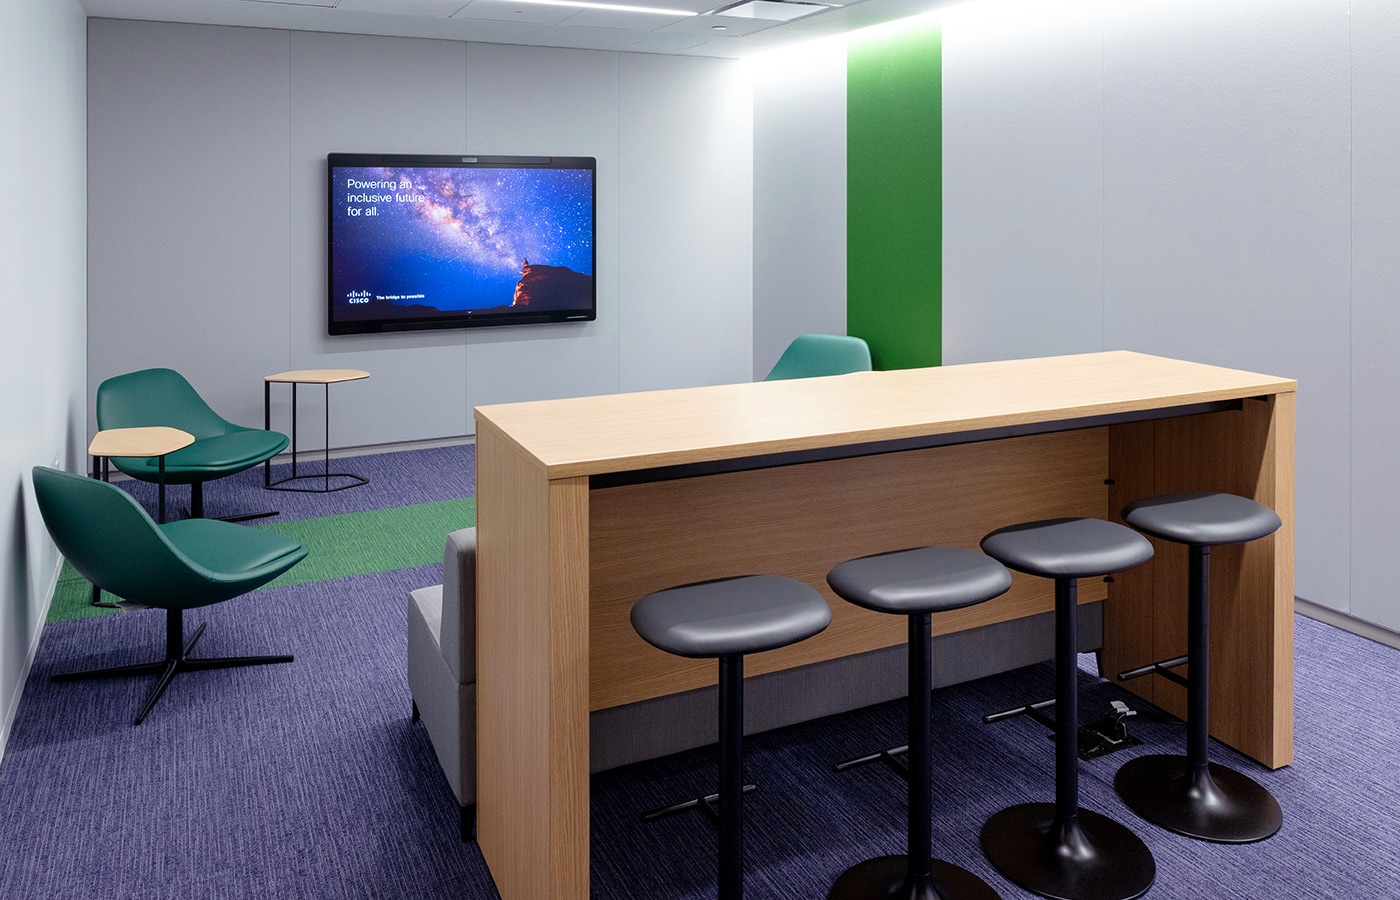
Innovation suite
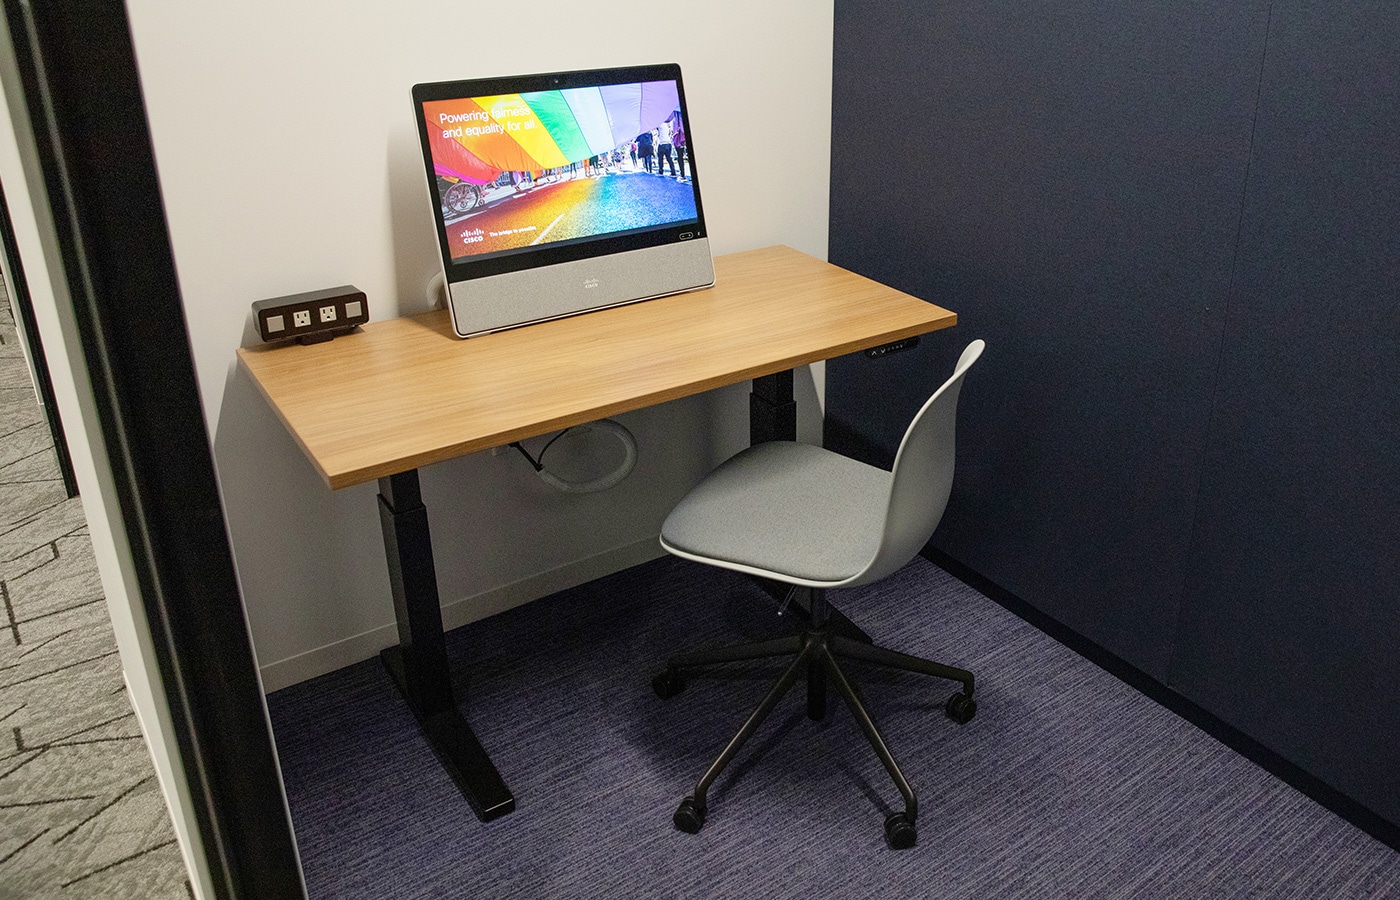
Quiet room
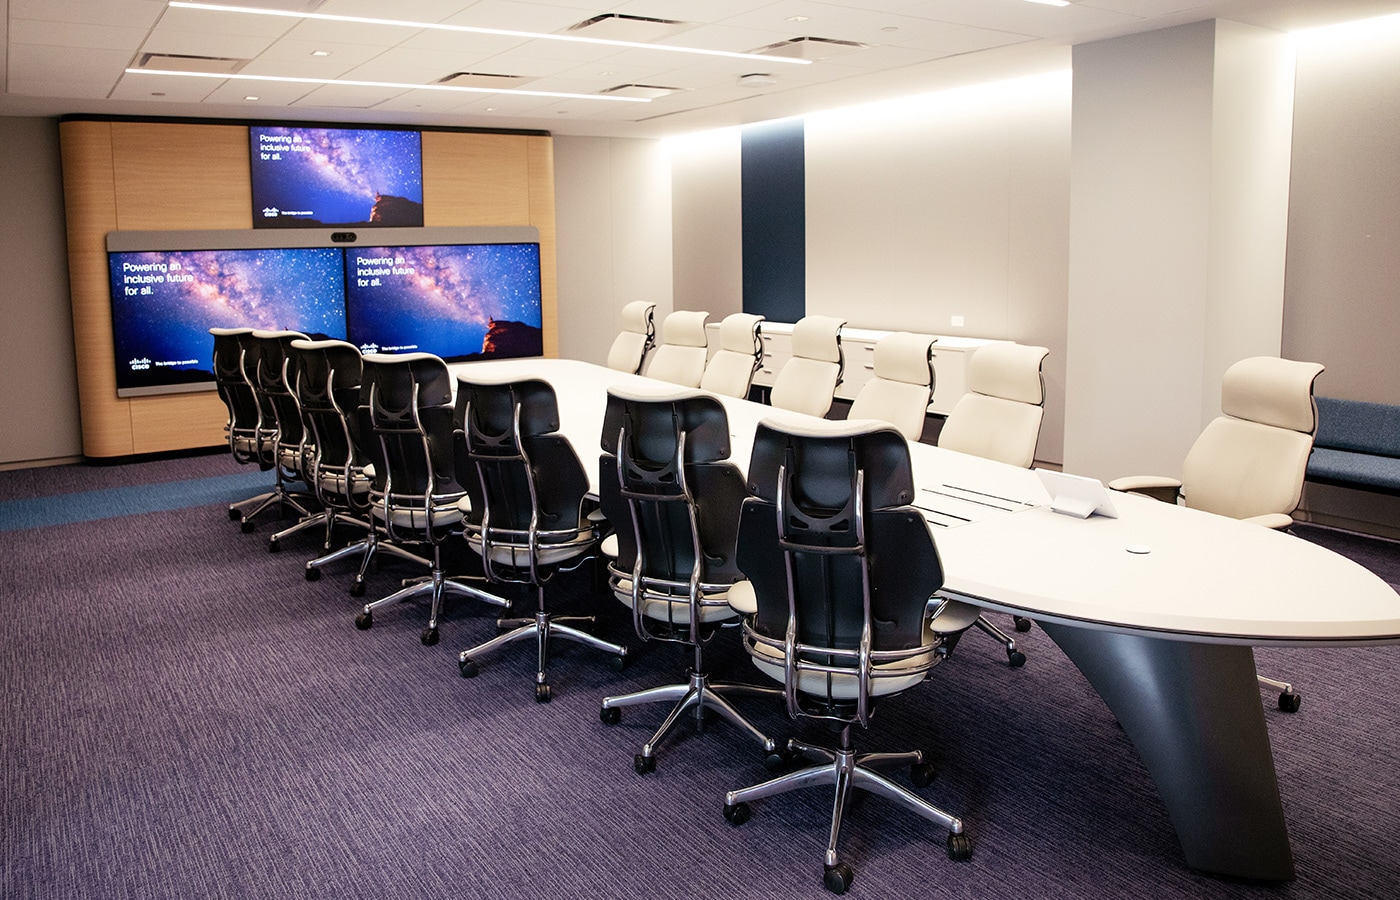
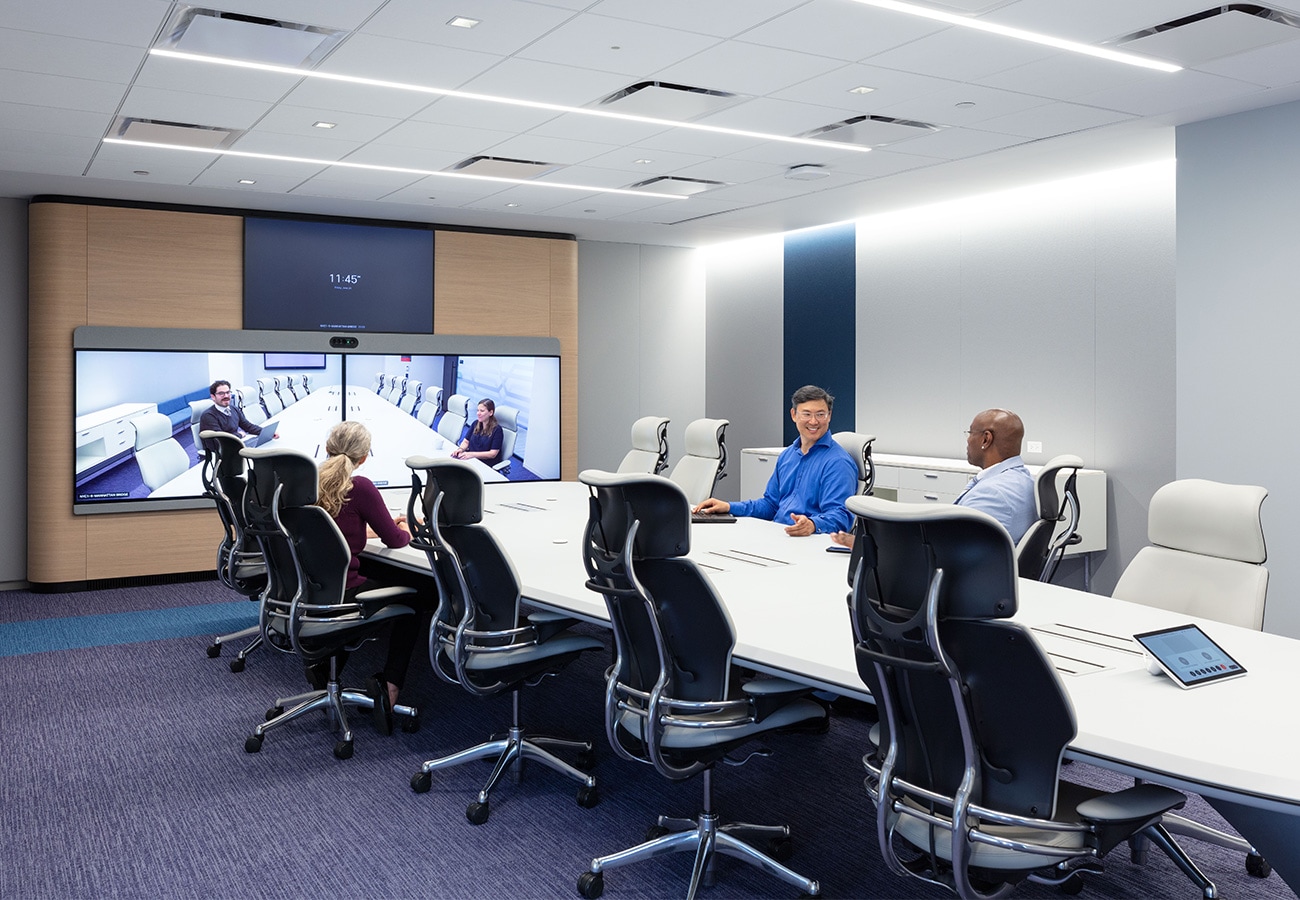
Large collaboration room

 of employees want their company to implement changes to make the workplace safer.


Scroll down for a 5-minute overview. Or take 20 minutes to dive deeper in each section.
Introduction
PENN1 is Cisco’s office in New York City. Prior to COVID-19, it was a traditional office with modest utilization. Now, after a two-year transformation, it is one of the most vibrant, energizing spaces in the company’s portfolio and a showcase of smart building technology.
We learned a lot along the way. As a result, PENN1 today is not just a model for a high-tech, hybrid workplace. It’s a model that illustrates how to make that happen—a 59,000-square-foot instruction manual for how to succeed at transitioning your own office to sustainable, smarter, hybrid workspaces.
Deeper dive
Read the back story
1. Define the objectives
To accomplish our goal of transforming PENN1 into a smart building for hybrid work, we first established five key objectives.
- Make it hybrid: Create an office that fosters collaboration among people who might be there always, often, sometimes, or not at all.
- Promote wellness: Build health and wellness into the design.
- Embrace sustainability: Accelerate progress in Cisco’s journey to net zero.
- Digitize real estate: Make the building programmable, smart, always on, and always efficient.
- Be the vision: Create a building that is itself a visionary platform for tomorrow’s offices.
Deeper dive
Read about the objectives
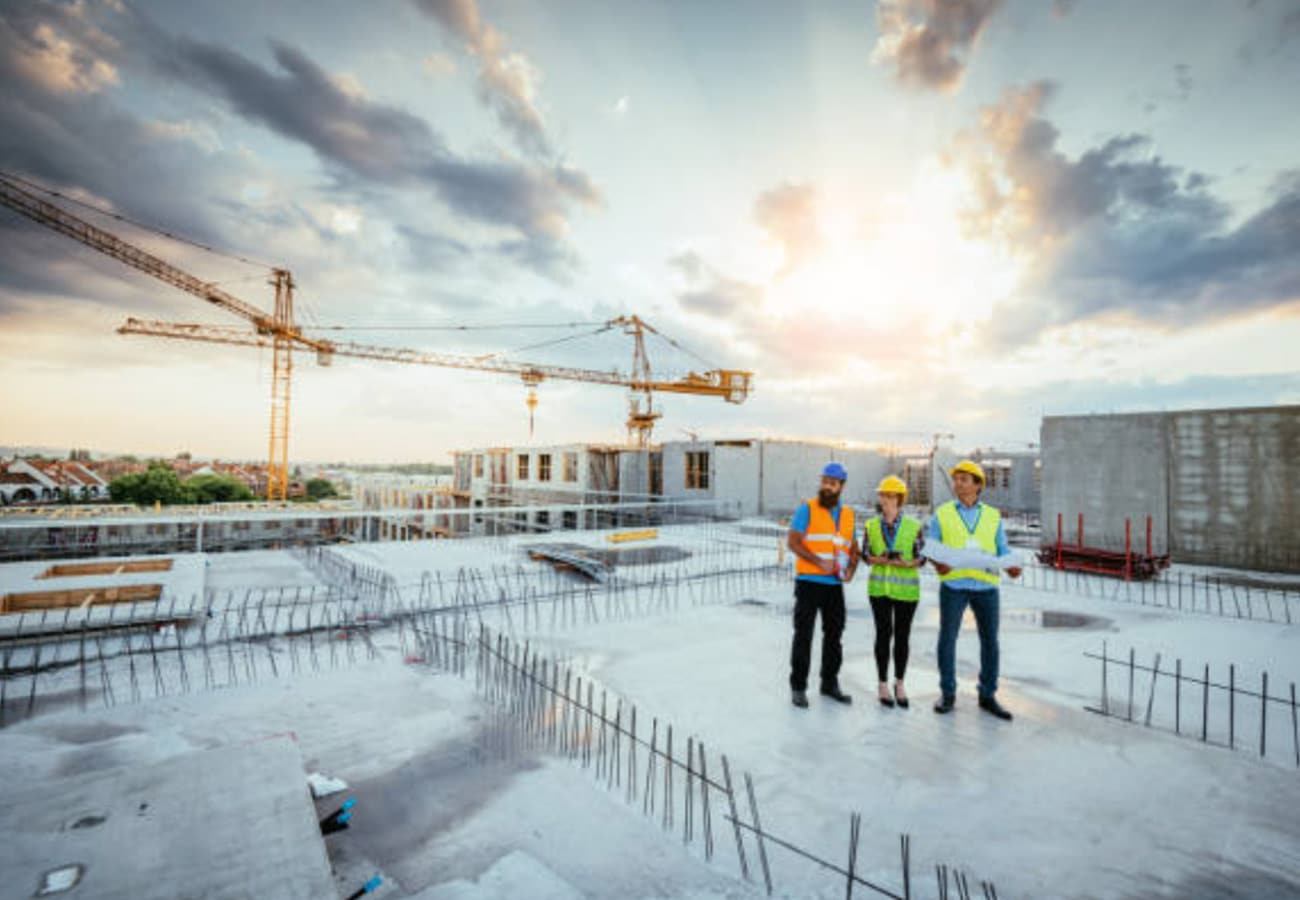
2. Assemble the partners and technologies
A modern retrofit requires a range of skills, from architectural design, construction management, and smart building expertise to technologies we excel at and technologies we depend on others to provide. That’s why one of the most crucial requirements for success, at every stage of the retrofit process, was finding the right partners to team with.
Deeper dive
Learn about the partners and technologies
3. Establish a design approach
We didn’t start from scratch. We had to ask how the existing office—designed for the workflows of just a few years ago—could be converted to meet new workflows. So, we asked our existing stakeholders—human resources, workplace resources, IT, customer experience—how they understood their own goals and pain points. We also leveraged usage data from our wireless network and collaboration endpoints.
Our biggest insight: Most of the collaboration that happens in the office will include one, or two, or many collaborators who are not physically there. So, we needed to do more than accept that reality, we needed to find a way to thrive off of it.
Deeper dive
Explore the design approach
4. Reinvent the workspaces
The new PENN1 would need a range of workspaces to match all the new ways our workers do their best work—such as hot desks, huddle rooms, and a variety of collaboration spaces—configured with the right layouts and the right screens to make everyone attending feel like they’re right there, whether they’re physically in the room or a thousand miles away.
Deeper dive
See the workspaces
Hot desks
Innovation suite
Quiet room
Large collaboration room
5. Optimize for experience and wellness
The pandemic changed all of our employees’ standards for workplace health and experience, and our ability to design buildings that meet those standards is growing exponentially. The connected office at PENN1 generates continuous data about environmental metrics—congestion, temperature, air quality, lighting—that can help employees choose the space that’s most comfortable for them. And a healthier workplace is a more productive one.
Deeper dive
Learn how we did it
97%
6. Optimize for comfort, energy efficiency, and sustainability
PENN1 integrates multiple building control systems—power, HVAC, lighting, shades, and occupancy—over a single, unified PoE network. The results are simplified management, better visibility, LEED Silver certification (Leadership in Energy and Environmental Design), and a major reduction in energy consumption.
Deeper dive
Read about our sustainability approach
7. Review achievements and lessons learned
The results of the PENN1 renovation are extraordinary. It’s an office where more people get more accomplished in more ways using less space. Along the way, we ran into challenges, which is to be expected. Recognizing those challenges, and tackling them head-on, is itself a crucial ingredient to success for any office renovation.
Deeper dive
Survey the top findingsTwice as many people seated in half the space
A net reduction of 5% in CapEx and another $250,000 in cost avoided during construction through lower labor costs of buying and installing Ethernet cable versus armored line voltage BX electrical cable.
Building inspectors unfamiliar with current technologies like PoE
Increased use of video collaboration requires purpose-built furniture
Your turn
The time is now. How will you adapt your own real estate to the new opportunities with smart buildings and the new demands of hybrid work?
Deeper dive
Make your plans for next steps