Nexus 9000 TAHUSD 버퍼 Syslog 및 혼잡 이해
다운로드 옵션
편견 없는 언어
본 제품에 대한 문서 세트는 편견 없는 언어를 사용하기 위해 노력합니다. 본 설명서 세트의 목적상, 편견 없는 언어는 나이, 장애, 성별, 인종 정체성, 민족 정체성, 성적 지향성, 사회 경제적 지위 및 교차성에 기초한 차별을 의미하지 않는 언어로 정의됩니다. 제품 소프트웨어의 사용자 인터페이스에서 하드코딩된 언어, RFP 설명서에 기초한 언어 또는 참조된 서드파티 제품에서 사용하는 언어로 인해 설명서에 예외가 있을 수 있습니다. 시스코에서 어떤 방식으로 포용적인 언어를 사용하고 있는지 자세히 알아보세요.
이 번역에 관하여
Cisco는 전 세계 사용자에게 다양한 언어로 지원 콘텐츠를 제공하기 위해 기계 번역 기술과 수작업 번역을 병행하여 이 문서를 번역했습니다. 아무리 품질이 높은 기계 번역이라도 전문 번역가의 번역 결과물만큼 정확하지는 않습니다. Cisco Systems, Inc.는 이 같은 번역에 대해 어떠한 책임도 지지 않으며 항상 원본 영문 문서(링크 제공됨)를 참조할 것을 권장합니다.
소개
이 문서에서는 NX-OS 소프트웨어를 실행하는 Cisco Scale ASIC가 장착된 Cisco Nexus 9000 시리즈 스위치의 대기열 처리 및 버퍼링에 관해 설명합니다.
사전 요구 사항
요구 사항
공유 미디어 네트워크의 이더넷 스위칭에 대한 기본 사항과 이러한 네트워크에서 대기열 처리/버퍼링의 필요성을 이해하는 것이 좋습니다. 또한 QoS(Quality of Service) 및 Cisco Nexus 스위치의 버퍼링에 대한 기본 사항을 이해할 것을 권장합니다. 자세한 내용은 다음 설명서를 참조하십시오.
- Cisco Nexus 9000 시리즈 NX-OS QoS 설정 가이드, 릴리스 10.1(x)
- Cisco Nexus 9000 시리즈 NX-OS QoS 설정 가이드, 릴리스 9.3(x)
- Cisco Nexus 9000 시리즈 NX-OS QoS 설정 가이드, 릴리스 9.2(x)
- Cisco Nexus 9000 시리즈 NX-OS QoS 설정 가이드, 릴리스 7.x
사용되는 구성 요소
이 문서의 정보는 NX-OS 소프트웨어 릴리스 9.3(8)을 실행하는 Cloud Scale ASIC가 장착된 Cisco Nexus 9000 시리즈 스위치를 기준으로 합니다.
이 문서에서 설명하는 절차는 여기에 표시된 하드웨어에만 적용됩니다.
- Nexus 9200/9300 고정 스위치
- N9K-C92160YC-X
- N9K-C92300YC
- N9K-C92304QC
- N9K-C92348GC-X
- N9K-C9236C
- N9K-C9272Q
- N9K-C9332C
- N9K-C9364C
- N9K-C93108TC-EX
- N9K-C93108TC-EX-24
- N9K-C93180LC-EX
- N9K-C93180YC-EX
- N9K-C93180YC-EX-24
- N9K-C93108TC-FX
- N9K-C93108TC-FX-24
- N9K-C93180YC-FX
- N9K-C93180YC-FX-24
- N9K-C9348GC-FXP
- N9K-C93240YC-FX2
- N9K-C93216TC-FX2
- N9K-C9336C-FX2
- N9K-C9336C-FX2-E
- N9K-C93360YC-FX2
- N9K-C93180YC-FX3
- N9K-C93108TC-FX3P
- N9K-C93180YC-FX3S
- N9K-C9316D-GX
- N9K-C93600CD-GX
- N9K-C9364C-GX
- N9K-C9364D-GX2A
- N9K-C9332D-GX2B
- Nexus 9500 모듈형 스위치 라인 카드
- N9K-X97160YC-EX
- N9K-X9732C-EX
- N9K-X9736C-EX
- N9K-X97284YC-FX
- N9K-X9732C-FX
- N9K-X9788TC-FX
- N9K-X9716D-GX
이 문서의 정보는 특정 랩 환경의 디바이스를 토대로 작성되었습니다. 이 문서에 사용된 모든 디바이스는 초기화된(기본) 컨피그레이션으로 시작되었습니다. 현재 네트워크가 작동 중인 경우 모든 명령의 잠재적인 영향을 미리 숙지하시기 바랍니다.
배경 정보
이 문서에서는 NX-OS 소프트웨어를 실행하는 Cisco Cloud Scale ASIC(Application-Specific Integrated Circuit)가 장착된 Cisco Nexus 9000 시리즈 스위치의 대기열 처리 및 버퍼링의 메커니즘에 대해 설명합니다. 또한 이 문서에서는 0이 아닌 출력 폐기 인터페이스 카운터와 버퍼 임계값이 초과되었음을 나타내는 시스템 로그 등 이 플랫폼의 포트 오버서브스크립션의 증상에 대해서도 설명합니다.
Cisco Nexus 9000 Cloud Scale ASIC 버퍼링 아키텍처 이해
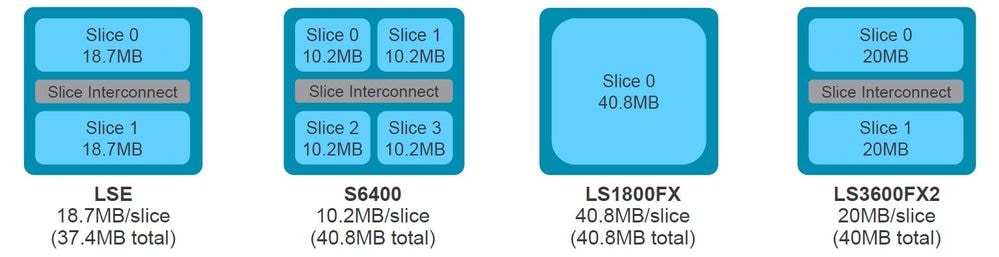
Cisco Cloud Scale ASIC가 장착된 Cisco Nexus 9000 시리즈 스위치는 "공유 메모리" 이그레스 버퍼 아키텍처를 구현합니다. ASIC는 하나 이상의 "슬라이스"로 나뉩니다. 각 슬라이스에는 자체 버퍼가 있으며 해당 슬라이스 내의 포트만 해당 버퍼를 사용할 수 있습니다. 물리적으로 각 슬라이스는 버퍼의 일부를 나타내는 "셀"로 나뉩니다. 슬라이스는 "pool-groups"로 분할됩니다. 특정 수의 셀이 각 풀 그룹에 할당되며 별도의 풀 그룹 간에 공유되지 않습니다. 각 풀 그룹에는 유니캐스트 또는 멀티캐스트 트래픽에 대한 CoS(Class of Service)를 나타내는 하나 이상의 "풀"이 있습니다. 이렇게 하면 각 풀 그룹은 풀 그룹이 제공하는 트래픽 유형을 위한 버퍼 리소스를 보장하는 데 도움이 됩니다.
여기에 있는 이미지는 다양한 Cisco Cloud Scale ASIC 모델이 어떻게 슬라이스로 구분되는지 시각적으로 보여줍니다. 또한 이미지는 셀을 통해 각 슬라이스에 특정 양의 버퍼가 어떻게 할당되는지 보여줍니다.
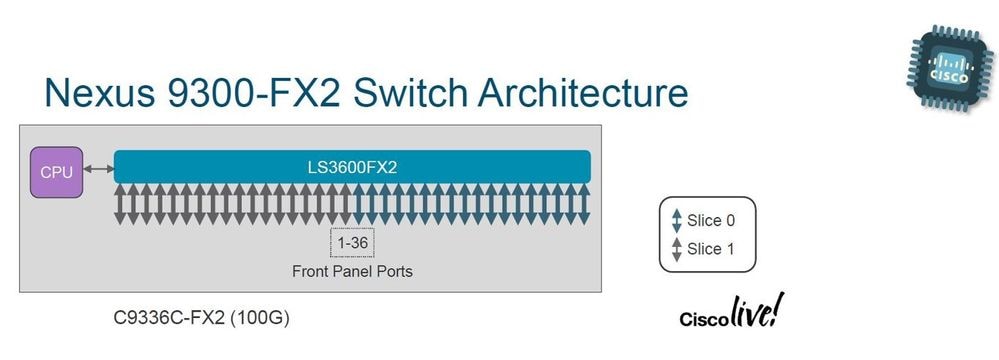
Nexus 9000 시리즈 스위치와 Nexus 9500 라인 카드의 각 모델에는 내부에 있는 Cisco Cloud Scale ASIC의 수가 서로 다르며, 어떤 전면 패널 포트가 어떤 ASIC에 연결되는지 지정하는 서로 다른 레이아웃이 있습니다. N9K-X9736C-FX 라인 카드와 N9K-C9336C-FX2 스위치를 사용하는 두 가지 예시가 여기 이미지에 표시되어 있습니다.
N9K-C9736C-FX 라인 카드에는 4개의 Cisco Cloud Scale LS1800FX ASIC과 ASIC당 1개의 슬라이스가 있습니다. 내부적으로는 각 ASIC를 "유닛"이라고 합니다. 각 슬라이스는 "인스턴스"라고 하며 섀시 내에서 해당 슬라이스를 고유하게 식별하는 0부터 시작하는 정수가 할당됩니다. 이로 인해 여기에 표시된 순열이 생성됩니다.
- 유닛 0, 슬라이스 0을 인스턴스 0이라고 함
- 유닛 1, 슬라이스 0을 인스턴스 1이라고 함
- 유닛 2, 슬라이스 0을 인스턴스 2라고 함
- 유닛 3, 슬라이스 0을 인스턴스 3이라고 함

N9K-C9336C-FX2 스위치에는 ASIC당 2개의 슬라이스가 포함된 1개의 Cisco Cloud Scale LS3600FX2 ASIC가 있습니다. 내부적으로는 각 ASIC를 "유닛"이라고 합니다. 각 슬라이스는 "인스턴스"라고 하며 섀시 내에서 해당 슬라이스를 고유하게 식별하는 0부터 시작하는 정수가 할당됩니다. 이로 인해 여기에 표시된 순열이 생성됩니다.
- 유닛 0, 슬라이스 0을 인스턴스 0이라고 함
- 유닛 0, 슬라이스 1을 인스턴스 1이라고 함
모든 라인 카드와 스위치는 레이아웃이 다르며 그 결과 인스턴스 번호가 달라집니다. 대역폭 집약적인 트래픽 플로우를 중심으로 네트워크를 설계하려면 작업할 스위치 또는 라인 카드 레이아웃을 이해해야 합니다. show interface hardware-mappings 명령을 사용하여 각 전면 패널 포트를 유닛(ASIC) 및 슬라이스 번호와 상호 연결할 수 있습니다. 관련 예시가 여기에 나와 있습니다. 섀시의 슬롯 2에 N9K-X9736C-FX 라인 카드가 삽입된 Nexus 9504 스위치의 인터페이스 Ethernet2/16이 유닛 1, 슬라이스 0에 매핑됩니다.
switch# show interface hardware-mappings
Legends:
       SMod  - Source Mod. 0 is N/A
       Unit  - Unit on which port resides. N/A for port channels
       HPort - Hardware Port Number or Hardware Trunk Id:
       HName - Hardware port name. None means N/A
       FPort - Fabric facing port number. 255 means N/A
       NPort - Front panel port number
       VPort - Virtual Port Number. -1 means N/A
       Slice - Slice Number. N/A for BCM systems
       SPort - Port Number wrt Slice. N/A for BCM systems
       SrcId - Source Id Number. N/A for BCM systems
       MacIdx - Mac index. N/A for BCM systems
       MacSubPort - Mac sub port. N/A for BCM systems

-------------------------------------------------------------------------------------------------------
Name       Ifindex  Smod Unit HPort FPort NPort VPort Slice SPort SrcId MacId MacSP VIF  Block BlkSrcID
-------------------------------------------------------------------------------------------------------
Eth2/1     1a080000 5    0    16    255   0     -1    0     16    32    4     0     145  0     32
Eth2/2     1a080200 5    0    12    255   4     -1    0     12    24    3     0     149  0     24
Eth2/3     1a080400 5    0    8     255   8     -1    0     8     16    2     0     153  0     16
Eth2/4     1a080600 5    0    4     255   12    -1    0     4     8     1     0     157  0     8
Eth2/5     1a080800 5    0    0     255   16    -1    0     0     0     0     0     161  0     0
Eth2/6     1a080a00 5    0    56    255   20    -1    0     56    112   14    0     165  1     40
Eth2/7     1a080c00 5    0    52    255   24    -1    0     52    104   13    0     169  1     32
Eth2/8     1a080e00 6    1    16    255   28    -1    0     16    32    4     0     173  0     32
Eth2/9     1a081000 6    1    12    255   32    -1    0     12    24    3     0     177  0     24
Eth2/10    1a081200 6    1    8     255   36    -1    0     8     16    2     0     181  0     16
Eth2/11    1a081400 6    1    4     255   40    -1    0     4     8     1     0     185  0     8
Eth2/12    1a081600 6    1    0     255   44    -1    0     0     0     0     0     189  0     0
Eth2/13    1a081800 6    1    56    255   48    -1    0     56    112   14    0     193  1     40
Eth2/14    1a081a00 6    1    52    255   52    -1    0     52    104   13    0     197  1     32
Eth2/15    1a081c00 7    2    16    255   56    -1    0     16    32    4     0     201  0     32
Eth2/16    1a081e00 7    2    12    255   60    -1    0     12    24    3     0     205  0     24
Eth2/17    1a082000 7    2    8     255   64    -1    0     8     16    2     0     209  0     16
Eth2/18    1a082200 7    2    4     255   68    -1    0     4     8     1     0     213  0     8
Eth2/19    1a082400 7    2    0     255   72    -1    0     0     0     0     0     217  0     0
Eth2/20    1a082600 7    2    56    255   76    -1    0     56    112   14    0     221  1     40
Eth2/21    1a082800 7    2    52    255   80    -1    0     52    104   13    0     225  1     32
Eth2/22    1a082a00 8    3    16    255   84    -1    0     16    32    4     0     229  0     32
Eth2/23    1a082c00 8    3    12    255   88    -1    0     12    24    3     0     233  0     24
Eth2/24    1a082e00 8    3    8     255   92    -1    0     8     16    2     0     237  0     16
Eth2/25    1a083000 8    3    4     255   96    -1    0     4     8     1     0     241  0     8
Eth2/26    1a083200 8    3    0     255   100   -1    0     0     0     0     0     245  0     0
Eth2/27    1a083400 8    3    56    255   104   -1    0     56    112   14    0     249  1     40
Eth2/28    1a083600 8    3    52    255   108   -1    0     52    104   13    0     253  1     32
Eth2/29    1a083800 5    0    48    255   112   -1    0     48    96    12    0     257  1     24
Eth2/30    1a083a00 5    0    44    255   116   -1    0     44    88    11    0     261  1     16
Eth2/31    1a083c00 6    1    48    255   120   -1    0     48    96    12    0     265  1     24
Eth2/32    1a083e00 6    1    44    255   124   -1    0     44    88    11    0     269  1     16
Eth2/33    1a084000 7    2    48    255   128   -1    0     48    96    12    0     273  1     24
Eth2/34    1a084200 7    2    44    255   132   -1    0     44    88    11    0     277  1     16
Eth2/35    1a084400 8    3    48    255   136   -1    0     48    96    12    0     281  1     24
Eth2/36    1a084600 8    3    44    255   140   -1    0     44    88    11    0     285  1     16
여러 ASIC 및 슬라이스의 인스턴스 ID 계산
시스템 로그를 해석할 때 연속 유닛 및 슬라이스 조합 순서를 기준으로 인스턴스 ID가 계산됩니다. 예를 들어, Nexus 9500 모듈 또는 Nexus 9300 TOR(Top-of-Rack)에 유닛당 2개의 유닛(ASIC)과 2개의 슬라이스가 있는 경우 인스턴스 ID는 다음과 같을 수 있습니다.
- 유닛 0, 슬라이스 0을 인스턴스 0이라고 함
- 유닛 0, 슬라이스 1을 인스턴스 1이라고 함
- 유닛 1, 슬라이스 0을 인스턴스 2라고 함
- 유닛 1, 슬라이스 1을 인스턴스 3이라고 함
모듈에 유닛 1개와 슬라이스 4개가 있는 경우 인스턴스 ID는 다음과 같을 수 있습니다.
- 유닛 0, 슬라이스 0을 인스턴스 0이라고 함
- 유닛 0, 슬라이스 1을 인스턴스 1이라고 함
- 유닛 0, 슬라이스 2를 인스턴스 2라고 함
- 유닛 0, 슬라이스 3을 인스턴스 3이라고 함
오버서브스크립션 및 출력 폐기 이해
이더넷 네트워크에 연결된 인터페이스는 한 번에 하나의 패킷만 전송할 수 있습니다. 두 개의 패킷이 이더넷 인터페이스를 동시에 이그레스해야 하는 경우 이더넷 인터페이스는 한 패킷을 전송하고 다른 패킷은 버퍼링합니다. 첫 번째 패킷이 전송되면 이더넷 인터페이스는 버퍼에서 두 번째 패킷을 전송합니다. 이그레스해야 하는 트래픽의 총 합계와 인터페이스가 인터페이스 대역폭을 초과할 경우 해당 인터페이스는 오버서브스크립션된 것으로 간주됩니다. 예를 들어 총 15Gbps의 트래픽이 즉시 스위치로 들어가고 10Gbps 인터페이스에서 이그레스되어야 하는 경우, 10Gbps 인터페이스는 한 번에 15Gbps의 트래픽을 전송할 수 없으므로 오버서브스크립션됩니다.
Cloud Scale ASIC가 장착된 Cisco Nexus 9000 시리즈 스위치는 이그레스 인터페이스와 연결된 ASIC 슬라이스의 버퍼 내 트래픽을 버퍼링하여 이러한 리소스 경합을 처리합니다. 인터페이스를 이그레스해야 하는 트래픽의 총 합계가 오랫동안 인터페이스 대역폭을 초과할 경우, ASIC 슬라이스의 버퍼는 인터페이스를 이그레스해야 하는 패킷으로 채워지기 시작합니다.
ASIC 슬라이스의 버퍼 사용률이 90%에 도달하면 스위치는 여기에 표시된 것과 유사한 시스템 로그를 생성합니다.
%TAHUSD-SLOT2-4-BUFFER_THRESHOLD_EXCEEDED: Module 2 Instance 0 Pool-group buffer 90 percent threshold is exceeded!
ASIC 슬라이스의 버퍼가 완전히 차면 스위치는 버퍼의 공간이 비워질 때까지 인터페이스를 이그레스해야 하는 모든 추가 트래픽을 삭제합니다. 스위치가 이 트래픽을 삭제하면 이그레스 인터페이스의 출력 폐기 카운터가 증가합니다.
생성된 시스템 로그와 0이 아닌 출력 폐기 카운터는 모두 오버서브스크립션된 인터페이스의 증상입니다. 각 증상은 다음의 하위 섹션에서 자세히 설명합니다.
BUFFER_THRESHOLD_EXCEEDED 시스템 로그 이해
BUFFER_THRESHOLD_EXCEEDED 시스템 로그의 예시가 여기에 나와 있습니다.
%TAHUSD-SLOTX-4-BUFFER_THRESHOLD_EXCEEDED: Module X Instance Y Pool-group buffer Z percent threshold is exceeded!
이 시스템 로그에는 3가지 주요 정보가 포함되어 있습니다.
- Module X - 오버서브스크립션된 인터페이스가 포함된 라인 카드의 슬롯입니다.
- Instance Y - 오버서브스크립션된 인터페이스를 포함하는 ASIC 및 슬라이스 튜플에 할당된 인스턴스 번호입니다.
- Pool-group buffer Z - 시스템 로그가 생성되기 전 영향을 받는 풀 그룹 버퍼 임계값입니다. 이 값은 모듈 X에 연결된 show hardware internal buffer info pkt-stats 출력에서 관찰된 대로 사용된 셀 수를 총 셀 수로 나눈 것입니다.
출력 폐기 인터페이스 카운터 이해
출력 폐기 인터페이스 카운터는 인터페이스를 이그레스해야 하지만 ASIC 슬라이스 버퍼가 가득 차서 새 패킷을 수락할 수 없어 삭제된 패킷 수를 나타냅니다. 출력 폐기 카운터는 여기에 나와 있는 것처럼 show interface 및 show interface counter errors 출력에 표시됩니다.
switch# show interface Ethernet1/1
Ethernet1/1 is up
admin state is up, Dedicated Interface
  Hardware: 1000/10000/25000/40000/50000/100000 Ethernet, address: 7cad.4f6d.f6d8 (bia 7cad.4f6d.f6d8)
  MTU 1500 bytes, BW 40000000 Kbit , DLY 10 usec
  reliability 255/255, txload 232/255, rxload 1/255
  Encapsulation ARPA, medium is broadcast
  Port mode is trunk
  full-duplex, 40 Gb/s, media type is 40G
  Beacon is turned off
  Auto-Negotiation is turned on  FEC mode is Auto
  Input flow-control is off, output flow-control is off
  Auto-mdix is turned off
  Rate mode is dedicated
  Switchport monitor is off
  EtherType is 0x8100
  EEE (efficient-ethernet) : n/a
    admin fec state is auto, oper fec state is off
  Last link flapped 03:16:50
  Last clearing of "show interface" counters never
  3 interface resets
  Load-Interval #1: 30 seconds
    30 seconds input rate 0 bits/sec, 0 packets/sec
    30 seconds output rate 36503585488 bits/sec, 3033870 packets/sec
    input rate 0 bps, 0 pps; output rate 36.50 Gbps, 3.03 Mpps
  Load-Interval #2: 5 minute (300 seconds)
    300 seconds input rate 32 bits/sec, 0 packets/sec
    300 seconds output rate 39094683384 bits/sec, 3249159 packets/sec
    input rate 32 bps, 0 pps; output rate 39.09 Gbps, 3.25 Mpps
  RX
    0 unicast packets  208 multicast packets  9 broadcast packets
    217 input packets  50912 bytes
    0 jumbo packets  0 storm suppression bytes
    0 runts  0 giants  0 CRC  0 no buffer
    0 input error  0 short frame  0 overrun   0 underrun  0 ignored
    0 watchdog  0 bad etype drop  0 bad proto drop  0 if down drop
    0 input with dribble  0 input discard
    0 Rx pause
  TX
    38298127762 unicast packets  6118 multicast packets  0 broadcast packets
    38298133880 output packets  57600384931480 bytes
    0 jumbo packets
    0 output error  0 collision  0 deferred  0 late collision
    0 lost carrier  0 no carrier  0 babble  57443534227 output discard       <<< Output discards due to oversubcription
    0 Tx pause

switch# show interface Ethernet1/1 counters errors

--------------------------------------------------------------------------------
Port          Align-Err    FCS-Err   Xmit-Err    Rcv-Err  UnderSize OutDiscards
--------------------------------------------------------------------------------
Eth1/1                0          0          0          0          0 57443534227

--------------------------------------------------------------------------------
Port         Single-Col  Multi-Col   Late-Col  Exces-Col  Carri-Sen       Runts
--------------------------------------------------------------------------------
Eth1/1                0          0          0          0          0           0

--------------------------------------------------------------------------------
Port          Giants SQETest-Err Deferred-Tx IntMacTx-Er IntMacRx-Er Symbol-Err
--------------------------------------------------------------------------------
Eth1/1             0          --           0           0           0          0

--------------------------------------------------------------------------------
Port         InDiscards
--------------------------------------------------------------------------------
Eth1/1                0
오버서브스크립션 시나리오 예시
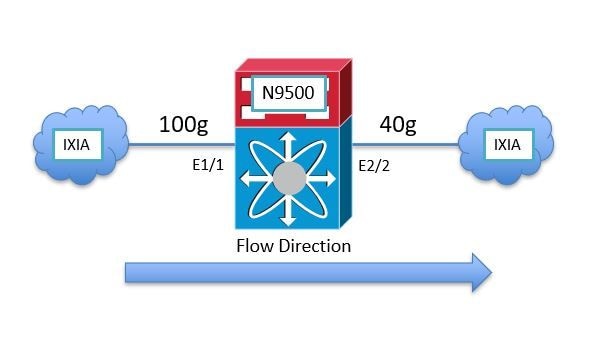
2개의 IXIA 트래픽 생성기 간의 트래픽이 섀시의 슬롯 1과 슬롯 2에 삽입된 2개의 N9K-X9736C-FX 라인 카드가 있는 Nexus 9504 스위치를 통과하는 시나리오를 가정해 보겠습니다. 100Gbps 트래픽의 경우 100Gbps 인터페이스 Ethernet1/1을 통해 스위치로 들어오고 40Gbps 인터페이스 Ethernet2/2를 이그레스(egress)해야 하므로 Ethernet2/2는 초과 가입됩니다. 이 시나리오의 토폴로지가 여기에 나와 있습니다.
Nexus 9000 Cloud Scale ASIC는 공유 메모리 이그레스 버퍼 아키텍처를 사용하므로, 이그레스 인터페이스 Ethernet2/2의 버퍼를 확인하여 혼잡을 확인해야 합니다. 이 예에서 슬롯 2에 삽입된 라인 카드가 이그레스 라인 카드이므로 반드시 Attach module 2 명령을 show hardware internal tah buffer counters 명령과 함께 사용해야 합니다. 유닛 0, 슬라이스 0 풀 그룹 및 관련 풀에 대해 0이 아닌 "Occupancy drops" 카운터를 확인합니다. 이 값은 풀 그룹 버퍼가 완전히 차서 삭제된 패킷 수를 나타냅니다.
switch# attach module 2
module-2# show hardware internal tah buffer counters

Unit: 0 Slice: 0
====================
|------------------------------------------------------------------------------------------------------------------|
|                                               Output Pool-Group drops                                            |
|                                Drop-PG      No-drop      CPU--PG      LCPU-PG      RCPU-PG      SPAN-PG          |
|------------------------------------------------------------------------------------------------------------------|
Occupancy drops                  51152554987        0            0            0            0            0       |
AQM drops                              0            0          N/A          N/A         N/A          N/A        |

|--------------------------------------------------------------------------------------------------------------------|
|                                                        Output UC Pool counters                                     |
|                               Pool 0     Pool 1     Pool 2     Pool 3     Pool 4     Pool 5     Pool 6     Pool 7  |
|--------------------------------------------------------------------------------------------------------------------|
Dynamic Threshold (cells)        93554      93554      93554      93554      93554      93554      93554      93554  |

Occupancy drops                 51152555398     0          0          0          0          0          0          0  |
AQM drops                            0          0          0          0          0          0          0          0  |

|--------------------------------------------------------------------------------------------------------------------|
|                                                        Output MC Pool counters                                     |
|                               Pool 0     Pool 1     Pool 2     Pool 3     Pool 4     Pool 5     Pool 6     Pool 7  |
|--------------------------------------------------------------------------------------------------------------------|
Dynamic Threshold (cells)        93554      93554      93554      93554      93554      93554      93554      93554  |
Dynamic Threshold (desc)         93554      93554      93554      93554      93554      93554      93554      93554  |
Dynamic Threshold (inq thr)      64035      64035      64035      64035      64035      64035      64035      64035  |

Occupancy drops                      0          0          0          0          0          0          0          0  |

|--------------+---------+---------+---------+---------+---------+--------+---------+---------+|
|                                     Additional counters                                      |
|--------------+---------+---------+---------+---------+---------+--------+---------+---------+|
          MEM cell drop reason                  :      0
          MEM descriptor drop reason            :      0
          OPG cell drop reason                  :      0
          OPG descriptor drop reason            :      0
          OPG CPU cell drop reason              :      0
          OPG CPU descriptor drop reason        :      0
          OPG SPAN cell drop reason             :      0
          OPG SPAN descriptor drop reason       :      0
          OPOOL cell drop reason                :      0
          OPOOL descriptor drop reason          :      0
          UC OQUEUE cell drop reason            : 51152556479
          MC OQUEUE cell drop reason            : 27573307
          OQUEUE descriptor drop reason         :      0
          MC OPOOL cell drop reason             :      0
          FWD DROP                              :     15
          SOD                                   :      0
          BMM BP                                :      0
          No Drop                               :      0
          Packets received                      : 87480806439
          TRUNC MTU                             :      0
          TRUNK BMM BP                          :      0
          VOQFC messages sent                   :      0
          SOD messages sent                     :      0
          SPAN desciptor drop                   :      0

Unit: 1 Slice: 0
====================
|------------------------------------------------------------------------------------------------------------------|
|                                               Output Pool-Group drops                                            |
|                                Drop-PG      No-drop      CPU--PG      LCPU-PG      RCPU-PG      SPAN-PG          |
|------------------------------------------------------------------------------------------------------------------|
Occupancy drops                        0            0            0            0            0            0       |
AQM drops                              0            0          N/A          N/A         N/A          N/A        |

|--------------------------------------------------------------------------------------------------------------------|
|                                                        Output UC Pool counters                                     |
|                               Pool 0     Pool 1     Pool 2     Pool 3     Pool 4     Pool 5     Pool 6     Pool 7  |
|--------------------------------------------------------------------------------------------------------------------|
Dynamic Threshold (cells)        93554      93554      93554      93554      93554      93554      93554      93554  |

Occupancy drops                      0          0          0          0          0          0          0          0  |
AQM drops                            0          0          0          0          0          0          0          0  |

|--------------------------------------------------------------------------------------------------------------------|
|                                                        Output MC Pool counters                                     |
|                               Pool 0     Pool 1     Pool 2     Pool 3     Pool 4     Pool 5     Pool 6     Pool 7  |
|--------------------------------------------------------------------------------------------------------------------|
Dynamic Threshold (cells)        93554      93554      93554      93554      93554      93554      93554      93554  |
Dynamic Threshold (desc)         93554      93554      93554      93554      93554      93554      93554      93554  |
Dynamic Threshold (inq thr)      64035      64035      64035      64035      64035      64035      64035      64035  |

Occupancy drops                      0          0          0          0          0          0          0          0  |

|--------------+---------+---------+---------+---------+---------+--------+---------+---------+|
|                                     Additional counters                                      |
|--------------+---------+---------+---------+---------+---------+--------+---------+---------+|
          MEM cell drop reason                  :      0
          MEM descriptor drop reason            :      0
          OPG cell drop reason                  :      0
          OPG descriptor drop reason            :      0
          OPG CPU cell drop reason              :      0
          OPG CPU descriptor drop reason        :      0
          OPG SPAN cell drop reason             :      0
          OPG SPAN descriptor drop reason       :      0
          OPOOL cell drop reason                :      0
          OPOOL descriptor drop reason          :      0
          UC OQUEUE cell drop reason            :      0
          MC OQUEUE cell drop reason            :      0
          OQUEUE descriptor drop reason         :      0
          MC OPOOL cell drop reason             :      0
          FWD DROP                              :      8
          SOD                                   :      0
          BMM BP                                :      0
          No Drop                               :      0
          Packets received                      : 45981341
          TRUNC MTU                             :      0
          TRUNK BMM BP                          :      0
          VOQFC messages sent                   :      0
          SOD messages sent                     :      0
          SPAN desciptor drop                   :      0
각 ASIC 유닛/슬라이스 튜플은 "인스턴스"라고 하는 고유한 식별 정보를 통해 표시됩니다. show hardware internal buffer info pkt-stats 명령 출력을 통해 각 인스턴스의 혼잡한 풀 그룹(축약 "PG")에 대한 세부 정보가 표시됩니다. 이 명령은 버퍼에서 사용된 이전 셀의 피크/최대 개수도 표시합니다. 마지막으로 명령은 버퍼링되는 트래픽과 함께 포트의 Cloud Scale ASIC 포트 식별자의 순간 스냅샷을 표시합니다. 이 명령의 예시가 여기에 나와 있습니다.
switch# attach module 2
module-2# show hardware internal buffer info pkt-stats

Instance 0

============
|------------------------------------------------------------------------------------------------------------|
|                                   Output Pool-Group Buffer Utilization (cells/desc)                        |
|                                Drop-PG      No-drop      CPU--PG      LCPU-PG      RCPU-PG      SPAN-PG    |
|------------------------------------------------------------------------------------------------------------|
Total Instant Usage (cells)        59992            0            0            0            0            0       |
Remaining Instant Usage (cells)    33562            0         1500          250         1500         1500       |
Peak/Max Cells Used                90415            0          N/A          N/A          N/A          N/A       |
Switch Cells Count                 93554            0         1500          250         1500         1500       |

Total Instant Usage (desc)             0            0            0            0            0            0       |
Remaining Instant Usage (desc)     93554            0         1500          250         1500         1500       |
Switch Desc Count                  93554            0         1500          250         1500         1500       |

|--------------------------------------------------------------------------------------------------------------------|
|                                    Output UC Pool Buffer Utilization (cells/desc)                                  |
|                               Pool 0     Pool 1     Pool 2     Pool 3     Pool 4     Pool 5     Pool 6     Pool 7  |
|--------------------------------------------------------------------------------------------------------------------|
Total Instant Usage (cells)      60027          0          0          0          0          0          0          0  |
Total Instant Usage (desc)           0          0          0          0          0          0          0          0  |
Peak/Max Cells Used              62047          0          0          0          0          0          0          0  |

|--------------------------------------------------------------------------------------------------------------------|
|                                    Output MC Pool Buffer Utilization (cells/desc)                                  |
|                               Pool 0     Pool 1     Pool 2     Pool 3     Pool 4     Pool 5     Pool 6     Pool 7  |
|--------------------------------------------------------------------------------------------------------------------|
Total Instant Usage (cells)          0          0          0          0          0          0          0          0  |
Total Instant Usage (desc)           0          0          0          0          0          0          0          0  |
Total Instant Usage (inq cells)      0          0          0          0          0          0          0          0  |
Total Instant Usage (packets)        0          0          0          0          0          0          0          0  |
Peak/Max Cells Used              60399          0          0          0          0          0          0          0  |

|--------------------------------------------------------------------------|
|              Instant Buffer utilization per queue per port               |
|      Each line displays the number of cells/desc utilized for a given    |
|                     port for each QoS queue                              |
|             One cell represents approximately 416 bytes                  |

|--------------+---------+---------+---------+---------+---------+--------+---------+---------+|
|ASIC Port         Q7        Q6        Q5        Q4        Q3        Q2        Q1        Q0    |
|--------------+---------+---------+---------+---------+---------+--------+---------+---------+|
 [12]                                                                                               <<< ASIC Port 12 in Unit 0 Instance 0 is likely the congested egress interface
          UC->       0         0         0         0         0         0         0     59988   |
    MC cells->       0         0         0         0         0         0         0         0   |
    MC desc->        0         0         0         0         0         0         0         0   |
명령의 peak 변형도 참조하십시오. 이 명령을 사용하여 시스템 로그를 특정 풀 그룹, 풀 또는 포트에서 발생할 수 있는 스파이크와 연결합니다.
switch# show hardware internal buffer info pkt-stats peak

slot  1
=======


Instance 0

============

|--------------+---------+---------+---------+---------+---------+|
|                     Pool-Group Peak counters                    |
|--------------+---------+---------+---------+---------+---------+|
          Drop PG       :           0
          No-drop PG    :           0

|--------------+---------+---------+---------+---------+---------+|
|                           Pool Peak counters                    |
|--------------+---------+---------+---------+---------+---------+|
          MC Pool 0     :           0
          MC Pool 1     :           0
          MC Pool 2     :           0
          MC Pool 3     :           0
          MC Pool 4     :           0
          MC Pool 5     :           0
          MC Pool 6     :           0
          MC Pool 7     :           0

          UC Pool 0     :           0
          UC Pool 1     :           0
          UC Pool 2     :           0
          UC Pool 3     :           0
          UC Pool 4     :           0
          UC Pool 5     :           0
          UC Pool 6     :           0
          UC Pool 7     :           0

|--------------+---------+---------+---------+---------+---------+|
|                           Port Peak counters                    |
|             classes mapped to count_0: 0 1 2 3 4 5 6 7
|             classes mapped to count_1: None
|--------------+---------+---------+---------+---------+---------+|
 [0]                                             <<< ASIC Port. This can be checked via "show interface hardware-mappings"
          count_0       :           0
          count_1       :           0
 [1]
          count_0       :           0
          count_1       :           0
show interface hardware-mappings 명령을 사용하여 Cloud Scale ASIC 포트 식별자를 전면 패널 포트로 변환할 수 있습니다. 앞에서 언급한 예에서 슬라이스/인스턴스 0의 ASIC 유닛 0과 연결된 ASIC 포트 12(show interface hardware-mappings 출력에서 SPort 열로 표시)에는 각각 416바이트의 59,988개의 점유 셀이 있습니다. 여기에는 이 인터페이스를 전면 패널 포트 Ethernet2/2에 매핑하는 show interface hardware-mappings 명령의 예가 나와 있습니다.
switch# show interface hardware-mappings
Legends:
       SMod  - Source Mod. 0 is N/A
       Unit  - Unit on which port resides. N/A for port channels
       HPort - Hardware Port Number or Hardware Trunk Id:
       HName - Hardware port name. None means N/A
       FPort - Fabric facing port number. 255 means N/A
       NPort - Front panel port number
       VPort - Virtual Port Number. -1 means N/A
       Slice - Slice Number. N/A for BCM systems
       SPort - Port Number wrt Slice. N/A for BCM systems
       SrcId - Source Id Number. N/A for BCM systems
       MacIdx - Mac index. N/A for BCM systems
       MacSubPort - Mac sub port. N/A for BCM systems

-------------------------------------------------------------------------------------------------------
Name       Ifindex  Smod Unit HPortFPort NPort VPort Slice SPort SrcId MacId MacSP VIF  Block BlkSrcID
-------------------------------------------------------------------------------------------------------
Eth2/2     1a080200 5    0    12   255   4     -1    0     12    24    3     0     149  0     24
show queuing interface 명령을 사용하여 인터페이스 Ethernet2/2의 오버서브스크립션과 QoS 큐잉 삭제의 상관관계를 추가로 연결할 수 있습니다. 관련 예시가 여기에 나와 있습니다.
switch# show queuing interface Ethernet2/2


Egress Queuing for Ethernet2/2 [System]
------------------------------------------------------------------------------
QoS-Group# Bandwidth% PrioLevel                Shape                   QLimit
                                   Min          Max        Units
------------------------------------------------------------------------------
      7             -         1           -            -     -            9(D)
      6             0         -           -            -     -            9(D)
      5             0         -           -            -     -            9(D)
      4             0         -           -            -     -            9(D)
      3             0         -           -            -     -            9(D)
      2             0         -           -            -     -            9(D)
      1             0         -           -            -     -            9(D)
      0           100         -           -            -     -            9(D)
+-------------------------------------------------------------+
|                              QOS GROUP 0                    |
+-------------------------------------------------------------+
|                           |  Unicast       |Multicast       |
+-------------------------------------------------------------+
|                   Tx Pkts |     35593332351|        18407162|
|                   Tx Byts |  53532371857088|     27684371648|
| WRED/AFD & Tail Drop Pkts |     53390604466|        27573307|
| WRED/AFD & Tail Drop Byts |  80299469116864|       110293228|
|              Q Depth Byts |        24961664|               0|
|       WD & Tail Drop Pkts |     53390604466|        27573307|
+-------------------------------------------------------------+
|                              QOS GROUP 1                    |
+-------------------------------------------------------------+
|                           |  Unicast       |Multicast       |
+-------------------------------------------------------------+
|                   Tx Pkts |               0|               0|
|                   Tx Byts |               0|               0|
| WRED/AFD & Tail Drop Pkts |               0|               0|
| WRED/AFD & Tail Drop Byts |               0|               0|
|              Q Depth Byts |               0|               0|
|       WD & Tail Drop Pkts |               0|               0|
+-------------------------------------------------------------+
|                              QOS GROUP 2                    |
+-------------------------------------------------------------+
|                           |  Unicast       |Multicast       |
+-------------------------------------------------------------+
|                   Tx Pkts |               0|               0|
|                   Tx Byts |               0|               0|
| WRED/AFD & Tail Drop Pkts |               0|               0|
| WRED/AFD & Tail Drop Byts |               0|               0|
|              Q Depth Byts |               0|               0|
|       WD & Tail Drop Pkts |               0|               0|
+-------------------------------------------------------------+
|                              QOS GROUP 3                    |
+-------------------------------------------------------------+
|                           |  Unicast       |Multicast       |
+-------------------------------------------------------------+
|                   Tx Pkts |               0|               0|
|                   Tx Byts |               0|               0|
| WRED/AFD & Tail Drop Pkts |               0|               0|
| WRED/AFD & Tail Drop Byts |               0|               0|
|              Q Depth Byts |               0|               0|
|       WD & Tail Drop Pkts |               0|               0|
+-------------------------------------------------------------+
|                              QOS GROUP 4                    |
+-------------------------------------------------------------+
|                           |  Unicast       |Multicast       |
+-------------------------------------------------------------+
|                   Tx Pkts |               0|               0|
|                   Tx Byts |               0|               0|
| WRED/AFD & Tail Drop Pkts |               0|               0|
| WRED/AFD & Tail Drop Byts |               0|               0|
|              Q Depth Byts |               0|               0|
|       WD & Tail Drop Pkts |               0|               0|
+-------------------------------------------------------------+
|                              QOS GROUP 5                    |
+-------------------------------------------------------------+
|                           |  Unicast       |Multicast       |
+-------------------------------------------------------------+
|                   Tx Pkts |               0|               0|
|                   Tx Byts |               0|               0|
| WRED/AFD & Tail Drop Pkts |               0|               0|
| WRED/AFD & Tail Drop Byts |               0|               0|
|              Q Depth Byts |               0|               0|
|       WD & Tail Drop Pkts |               0|               0|
+-------------------------------------------------------------+
|                              QOS GROUP 6                    |
+-------------------------------------------------------------+
|                           |  Unicast       |Multicast       |
+-------------------------------------------------------------+
|                   Tx Pkts |               0|               0|
|                   Tx Byts |               0|               0|
| WRED/AFD & Tail Drop Pkts |               0|               0|
| WRED/AFD & Tail Drop Byts |               0|               0|
|              Q Depth Byts |               0|               0|
|       WD & Tail Drop Pkts |               0|               0|
+-------------------------------------------------------------+
|                              QOS GROUP 7                    |
+-------------------------------------------------------------+
|                           |  Unicast       |Multicast       |
+-------------------------------------------------------------+
|                   Tx Pkts |               0|               0|
|                   Tx Byts |               0|               0|
| WRED/AFD & Tail Drop Pkts |               0|               0|
| WRED/AFD & Tail Drop Byts |               0|               0|
|              Q Depth Byts |               0|               0|
|       WD & Tail Drop Pkts |               0|               0|
+-------------------------------------------------------------+
|                      CONTROL QOS GROUP                      |
+-------------------------------------------------------------+
|                           |  Unicast       |Multicast       |
+-------------------------------------------------------------+
|                   Tx Pkts |            5704|               0|
|                   Tx Byts |          725030|               0|
|            Tail Drop Pkts |               0|               0|
|            Tail Drop Byts |               0|               0|
+-------------------------------------------------------------+
|                         SPAN QOS GROUP                      |
+-------------------------------------------------------------+
|                           |  Unicast       |Multicast       |
+-------------------------------------------------------------+
|                   Tx Pkts |               0|               0|
|                   Tx Byts |               0|               0|
+-------------------------------------------------------------+

Per Slice Egress SPAN Statistics
---------------------------------------------------------------
         SPAN Copies Tail Drop Pkts                           0
         SPAN Input Queue Drop Pkts                           0
 SPAN Copies/Transit Tail Drop Pkts                           0
         SPAN Input Desc Drop  Pkts                           0
마지막으로 show interface 명령을 사용하여 이그레스 인터페이스 Ethernet2/2에 0이 아닌 출력 폐기 카운터가 있는지 확인할 수 있습니다. 관련 예시가 여기에 나와 있습니다.
switch# show interface Ethernet2/2
Ethernet2/2 is up
admin state is up, Dedicated Interface
  Hardware: 1000/10000/25000/40000/50000/100000 Ethernet, address: 7cad.4f6d.f6d8 (bia 7cad.4f6d.f6d8)
  MTU 1500 bytes, BW 40000000 Kbit , DLY 10 usec
  reliability 255/255, txload 232/255, rxload 1/255
  Encapsulation ARPA, medium is broadcast
  Port mode is trunk
  full-duplex, 40 Gb/s, media type is 40G
  Beacon is turned off
  Auto-Negotiation is turned on  FEC mode is Auto
  Input flow-control is off, output flow-control is off
  Auto-mdix is turned off
  Rate mode is dedicated
  Switchport monitor is off
  EtherType is 0x8100
  EEE (efficient-ethernet) : n/a
    admin fec state is auto, oper fec state is off
  Last link flapped 03:16:50
  Last clearing of "show interface" counters never
  3 interface resets
  Load-Interval #1: 30 seconds
    30 seconds input rate 0 bits/sec, 0 packets/sec
    30 seconds output rate 36503585488 bits/sec, 3033870 packets/sec
    input rate 0 bps, 0 pps; output rate 36.50 Gbps, 3.03 Mpps
  Load-Interval #2: 5 minute (300 seconds)
    300 seconds input rate 32 bits/sec, 0 packets/sec
    300 seconds output rate 39094683384 bits/sec, 3249159 packets/sec
    input rate 32 bps, 0 pps; output rate 39.09 Gbps, 3.25 Mpps
  RX
    0 unicast packets  208 multicast packets  9 broadcast packets
    217 input packets  50912 bytes
    0 jumbo packets  0 storm suppression bytes
    0 runts  0 giants  0 CRC  0 no buffer
    0 input error  0 short frame  0 overrun   0 underrun  0 ignored
    0 watchdog  0 bad etype drop  0 bad proto drop  0 if down drop
    0 input with dribble  0 input discard
    0 Rx pause
  TX
    38298127762 unicast packets  6118 multicast packets  0 broadcast packets
    38298133880 output packets  57600384931480 bytes
    0 jumbo packets
    0 output error  0 collision  0 deferred  0 late collision
    0 lost carrier  0 no carrier  0 babble  57443534227 output discard       <<< Output discards due to oversubcription
    0 Tx pause
다음 단계
Cloud Scale ASIC가 장착된 Nexus 9000 시리즈 스위치에서 출력 폐기가 발생한 경우 다음 방법 중 하나 이상을 사용하여 문제를 해결할 수 있습니다.
- 출력 폐기가 발생하는 인터페이스는 단일 인터페이스이며 포트 채널에 번들로 제공되지 않는 경우에는 인터페이스의 대역폭을 업그레이드하여 혼잡을 완화할 수 있습니다. 예를 들어, 혼잡한 이그레스 인터페이스가 10Gbps 인터페이스인 경우 25Gbps, 40Gbps 인터페이스 또는 100Gbps 인터페이스로 업그레이드하면 문제를 해결할 수 있습니다.
- 이그레스 인터페이스의 트랜시버 폼 팩터를 기반으로 트랜시버를 업그레이드할 수 있습니다(QSFP 포트 내부의 CVR-QSFP-SFP10G에 삽입된 10Gbps SFP+에서 네이티브 40Gbps QSFP 트랜시버로 마이그레이션할 수 있음).
- 혼잡한 이그레스 인터페이스 설정을 10Gbps 포트에서 25Gbps, 40Gbps 또는 100Gbps 포트로 마이그레이션하는 경우에도 이 작업을 수행할 수 있습니다.
- 출력 폐기가 발생하는 인터페이스가 단일 인터페이스이며 포트 채널에 번들로 제공되지 않는 경우에는 혼잡한 인터페이스를 동일한 대역폭의 다른 인터페이스와 함께 포트 채널의 멤버로 구성하여 혼잡을 완화할 수 있습니다.
- 출력 폐기가 발생하는 인터페이스가 포트 채널 인터페이스인 경우, 포트 채널에 멤버를 추가하면 전체 포트 채널의 대역폭이 증가하고 여러 개의 대규모 트래픽 흐름에 대해 로드 밸런싱된 해싱이 개선될 수 있습니다.
- 네트워크의 호스트 간 혼잡한 트래픽 플로우에 속도를 저하시키는 인터페이스가 포함되는지 검증합니다(예: 40Gbps 인터페이스를 통해 스위치를 인그레스하고 10Gbps 인터페이스를 통해 스위치를 이그레스하는 트래픽). 이는 네트워크 혼잡을 유발하는 병목 현상이 될 수 있습니다. 이러한 병목 현상을 제거하려면 저속 인터페이스(예: 10Gbps)를 고속 인터페이스(예: 25Gbps, 40Gbps 등)로 업그레이드하면 네트워크 혼잡이 완화됩니다.
- 혼잡한 이그레스 인터페이스에서 가용 대역폭을 늘릴 수 없는 경우, 엔드 투 엔드 QoS를 검증하고 네트워크에 대해 적절한 대기열 처리 작업을 적용하십시오.
- 마이크로 버스트가 간헐적 혼잡의 잠재적 원인인 경우 이 문서의 마이크로 버스트 모니터링 섹션에서 마이크로 버스트 모니터링을 구성하는 방법에 대한 정보를 참조하십시오.
추가 정보
문서의 이 섹션에는 BUFFER_THRESHOLD_EXCEEDED 시스템 로그, 네트워크 혼잡/오버서브스크립션 시나리오, 증분 출력 폐기 인터페이스 카운터가 발생할 때 수행하는 다음 단계에 대한 추가 정보가 포함되어 있습니다.
BUFFER_THRESHOLD_EXCEEDED 시스템 로그 설정 옵션
시스템 버퍼 상태 폴링 간격을 수정할 수 있으며, 이 값은 시스템이 ASIC 슬라이스 버퍼의 현재 사용률을 폴링하는 빈도를 제어합니다. 이 작업은 hardware profile buffer info poll-interval 전역 설정 명령으로 수행됩니다. 기본 설정 값은 5,000밀리초입니다. 이 설정은 전역으로 또는 모듈별로 수정할 수 있습니다. 1,000밀리초 값으로 수정된 이 설정 명령의 예시가 여기에 나와 있습니다.
switch# configure terminal
Enter configuration commands, one per line. End with CNTL/Z.
switch(config)# hardware profile buffer info poll-interval timer 1000
switch(config)# end
switch# show running-config | include hardware.profile.buffer
hardware profile buffer info poll-interval timer 1000
switch#
포트 이그레스 버퍼 사용 임계값을 수정할 수 있습니다. 이 값은 ASIC 슬라이스 버퍼 사용률이 설정된 임계값을 초과했음을 나타내는 BUFFER_THRESHOLD_EXCEEDED 시스템 로그를 생성하는 시점을 제어합니다. 이 작업은 hardware profile buffer info port-threshold 전역 설정 명령으로 수행됩니다. 기본 설정 값은 90%입니다. 이 설정은 전역으로 또는 모듈별로 수정할 수 있습니다. 80% 값으로 수정된 이 설정 명령의 예시가 여기에 나와 있습니다.
switch# configure terminal
Enter configuration commands, one per line. End with CNTL/Z.
switch(config)# hardware profile buffer info port-threshold threshold 80
switch(config)# end
switch# show running-config | include hardware.profile.buffer
hardware profile buffer info port-threshold threshold 80
switch#
스위치에 의해 생성되는 BUFFER_THRESHOLD_EXCEEDED 시스템 로그 간의 최소 간격을 수정할 수 있습니다. BUFFER_THRESHOLD_EXCEEDED 시스템 로그를 완전히 비활성화할 수도 있습니다. 이 작업은 hardware profile buffer info syslog-interval timer 전역 설정 명령을 사용하여 수행됩니다. 기본 설정 값은 120초입니다. 값을 0초로 설정하여 시스템 로그를 완전히 비활성화할 수 있습니다. 이 구성 명령의 예시가 여기에 나와 있으며, 여기서 시스템 로그는 완전히 비활성화됩니다.
switch# configure terminal
Enter configuration commands, one per line. End with CNTL/Z.
switch(config)# hardware profile buffer info syslog-interval timer 0
switch(config)# end
switch# show running-config | include hardware.profile.buffer
hardware profile buffer info syslog-interval timer 0
switch#
네트워크 혼잡 시나리오에 대한 수집 로그
네트워크 혼잡 시나리오의 영향을 받는 스위치에서 여기에 표시된 로그를 수집하여 이 문서에 나열된 명령 외에도 혼잡 이그레스 인터페이스를 식별할 수 있습니다.
- show tech-support details 명령의 출력
- show tech-support usd-all 명령의 출력
- show tech-support ipqos all 명령의 출력
- Cisco Cloud Scale 라인 카드가 삽입된 Nexus 9500 시리즈 스위치로 작업하는 경우, show system internal interface counters peak module{x} 명령의 출력이 표시됩니다. 여기서 {x}는 혼잡한 이그레스 인터페이스를 호스팅하는 모듈의 슬롯 번호입니다.
마이크로 버스트 모니터링
혼잡 또는 오버서브스크립션이 매우 짧은 간격(마이크로 버스트)으로 발생하는 경우, 오버서브스크립션이 스위치에 미치는 영향을 정확하게 나타내려면 추가 정보가 필요합니다.
Cisco Cloud Scale ASIC가 장착된 Cisco Nexus 9000 시리즈 스위치는 환경에 일시적인 네트워크 혼잡 및 트래픽 손실을 유발할 수 있는 마이크로 버스트의 트래픽을 모니터링할 수 있습니다. 마이크로 버스트 및 이 기능을 설정하는 방법에 대한 자세한 내용은 여기에 표시된 문서를 참조하십시오.
- Cisco Nexus 9000 시리즈 NX-OS QoS 설정 가이드, 릴리스 10.1(x)의 "마이크로 버스트 모니터링" 장
- Cisco Nexus 9000 시리즈 NX-OS QoS 설정 가이드, 릴리스 9.3(x)의 "마이크로 버스트 모니터링" 장
- Cisco Nexus 9000 시리즈 NX-OS QoS 설정 가이드, 릴리스 9.2(x)의 "마이크로 버스트 모니터링" 장
- Cisco Nexus 9000 시리즈 NX-OS QoS 설정 가이드, 릴리스 7.x의 "마이크로 버스트 모니터링" 장
관련 정보
개정 이력
| 개정 | 게시 날짜 | 의견 |
|---|---|---|
6.0 |
09-Nov-2023
|
Update |
5.0 |
04-Oct-2023
|
재인증 |
3.0 |
21-Jan-2022
|
문서에 "다음 단계" 섹션을 추가합니다. |
2.0 |
03-Oct-2021
|
새 하드웨어를 포함하도록 해당 하드웨어 섹션을 업데이트합니다. |
1.0 |
31-Aug-2021
|
최초 릴리스 |
Cisco 엔지니어가 작성
- 매튜 맥라미Cisco 기술 리더
- 조슈아 스토너Cisco 소프트웨어 엔지니어링 기술 리더
 피드백
피드백지원 문의
- 지원 케이스 접수

- (시스코 서비스 계약 필요)