Using the Cisco DCNM Client
Available Languages
Table Of Contents
Introducing the Cisco DCNM Client
Working with Statistics and Charts
Information about Statistics and Charts
Licensing Requirements for Statistics and Charts
Starting Statistical Monitoring for a Chart
Stopping Statistical Monitoring for a Chart
Configuring Global Preferences
Configuring Monitoring Preferences
Configuring the Maximum Age of Events Fetched from the Server
Feature History for Using the Cisco DCNM Client
Using the Cisco DCNM Client
This chapter describes the user interface of the Cisco Data Center Network Manager (DCNM) client and how to use common features.
This chapter includes the following sections:
•
Introducing the Cisco DCNM Client
•
•
•
•
•
Introducing the Cisco DCNM Client
This section describes the Cisco DCNM client and its parts.
This section includes the following topics:
User Interface
The Cisco DCNM client user interface, shown in Figure 3-1, presents device status information and provides configuration tools that allow you to manage devices. It is divided into the panes shown in Figure 3-1. When you want to view information about a specific object in a managed device or want to perform a configuration task, you use the panes in the order shown in Figure 3-1.
Figure 3-1

Cisco DCNM Client User Interface
Feature Selector Pane
The Feature Selector pane, shown in Figure 3-1, allows you to see features grouped by categories and to choose the feature that you want to use or configure. The bottom section of the Feature Selector pane displays buttons for feature categories. When you choose a category, the top section of the Feature Selector pane displays a tree of features within the chosen category.
In Figure 3-1, the Interfaces category is chosen, so the tree shows features that allow you to configure the interfaces of managed devices.
The documentation and online help for Cisco DCNM includes many procedures that begin with choosing the applicable feature from the Feature Selector pane. For example, a procedure about configuring an Ethernet interface would start with the following step:
From the Feature Selector pane, choose Interfaces > Physical > Ethernet.
After you choose a feature on the tree, the Contents pane displays information about the feature.
Contents Pane
The Contents pane, shown in Figure 3-1, displays information about the currently selected feature and provides fields for configuring that feature. The Contents pane contains two smaller panes: the Summary pane and the Details pane.
Summary Pane
The Summary pane, shown in Figure 3-1, displays an organized set of objects that you can view information about or perform actions on. The type of objects that appear depends upon the currently selected feature.
For example, if you choose Interfaces > Physical > Ethernet from the Feature Selector pane, the Summary pane shows a table of devices. You can expand the managed devices to view the slots that contain network interface cards. You can expand the slots to view the interfaces they contain and key information about the status of the interfaces, such as the port mode, administrative status, and operational status. For most features, the title bar for the Summary pane shows what you have selected.
After you choose the object that you want to view or configure, the Details pane displays information about the selected object, such as an Ethernet interface.
Exporting the Summary Pane
You can export the data shown in the Summary pane to a spreadsheet in Microsoft Excel 97-2003 format. To do so, click the green arrow in the upper-right corner of the Summary pane and specify the filename and location for the spreadsheet.
Filtering the Summary Pane
For many features, you can filter the objects that appear in the Summary pane. If filtering is supported for the feature that you selected, you can enable filtering from the menu bar by choosing View > Filter. In the Summary pane, the columns that you can use to filter the objects become drop-down lists. To filter the Summary pane, use the drop-down column heading lists to limit the objects that appear.
Details Pane
The Details pane, shown in Figure 3-1, shows information and configuration fields that are specific to the object that you selected in the Summary pane. The Details tab is often further divided into tabs. You can click on a tab to view its contents.
This section includes the following topics:
•
Tabs
Tabs organize related fields and information. For example, as shown in Figure 3-1, when you select an Ethernet interface, four tabs appears in the Details pane, such as the Port Details tab.
The following two special tabs often appear in the Details pane for many of the types of objects that you can choose from the Summary pane:
•
•
Sections
Sections provide further organization of related fields and information. The Cisco DCNM client allows you to expand and collapse sections so that you can show or hide fields and information as needed. For example, as shown in Figure 3-1, on the Port Details tab, the Basic Settings section is expanded but the Port Mode Settings section is collapsed.
Association Pane
The Cisco DCNM client also includes the Association pane, which allows you to access objects that you have configured in features that are associated with the currently selected feature. Figure 3-2 shows the Association pane.
When tabs appear on the right side of the Cisco DCNM client, you can click on them to access the Association pane. For example, as shown in Figure 3-2, if you are configuring an Ethernet interface, you can use the Association pane to access the IPv4 ACLs that you can apply to the interface. If you right-click on an IPv4 ACL in the Association pane, you can choose to apply the ACL to the interface or to go to the IPv4 ACLs feature and configure the ACL.
Figure 3-2
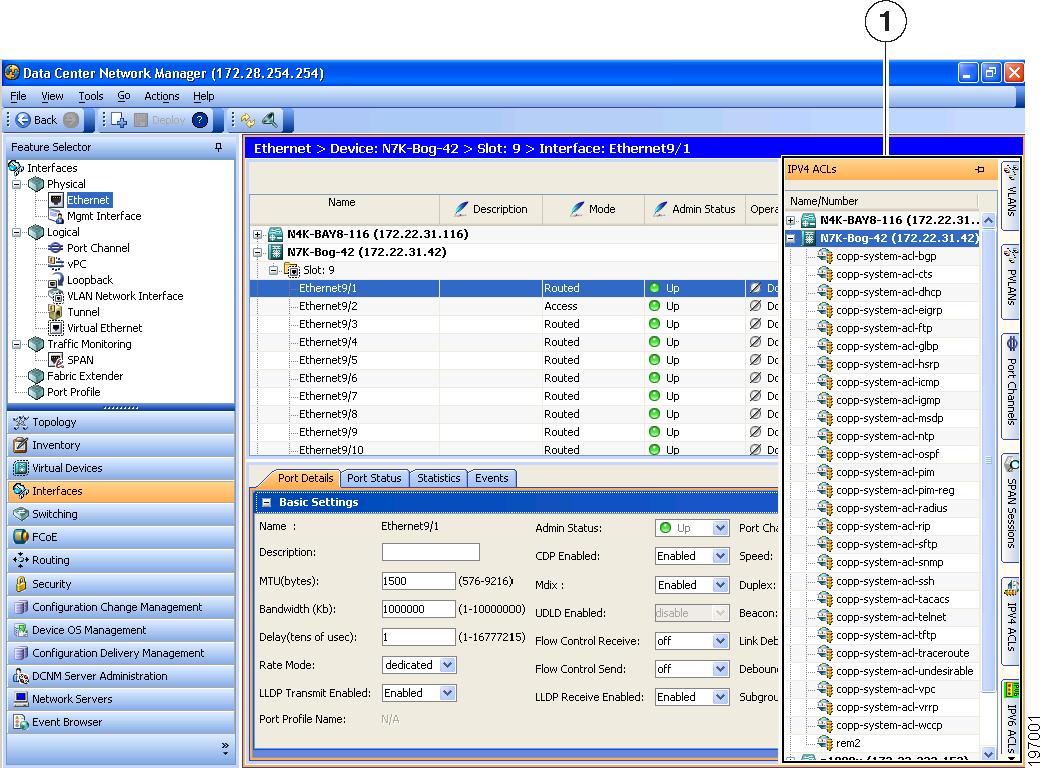
Association Pane
Menus
The menu bar in the Cisco DCNM client includes the following standard menus that appear:
File Menu
•
•
•
View Menu
•
•
•
Tools Menu
•
•

Note
Go Menu
•
•
•
•
•
•
•
•
•
•
•
•
•
•
Actions Menu
The items on the Actions menu reflect what you can do, depending upon the feature you are using and the object that is selected in the Summary pane. For some features, such as Inventory, the Actions menu does not appear in the menu bar.
Help Menu
•
•
•
•
•
Toolbars
The Cisco DCNM client provides several standard toolbars plus additional, feature-specific toolbars that are available only when you have selected the applicable feature. The following table lists actions that you can take to configure toolbars.
Keyboard Commands
You can use the keyboard to perform many of the commands that you can perform with menu items or toolbars. The menus show the keyboard equivalent of most menu items. For example, the following list shows some common menu items and the matching keyboard command:
•
•
•
•
•
Multiple Platform Support
Cisco DCNM supports several types of Nexus platforms; however, some of the features supported in Cisco DCNM are not supported or applicable to all platforms. This section describes how DCNM handles unsupported features in the user interface.
•
For example, if you choose Security > Access Control > Time-range from the Feature Selector pane, the Summary pane displays only the platform types that support the Time-range feature. In this case, the Cisco Nexus 1000V does not support this feature, so any managed Cisco Nexus 1000V platforms are not displayed in the Summary pane. Similarly, the Time-range association pane does not include any Cisco Nexus 1000V platforms.
•
If all attributes grouped in a particular section are not supported, then N/A is added to the section title, and Cisco DCNM does not allow you to expand the section.
If all attributes in a tab are not supported for a particular platform, the tab is displayed, but if you click on it, a message appears stating that the attribute is not supported.
•
•
•
Opening the Cisco DCNM Client
You can open the Cisco DCNM client after you have installed the Cisco DCNM client on the computer that you are using.
BEFORE YOU BEGIN
Install the Cisco DCNM client on the computer that you are using. For more information about installing the Cisco DCNM client, see Chapter 2, "Installing and Launching the Cisco DCNM Client."
DETAILED STEPS
Step 1
Note
A dialog box displays login fields.
Step 2
Note
Step 3
Step 4
Step 5
a.
b.
The default Cisco DCNM server port number is 1099; however, you can specify a different port number when you install or reinstall the Cisco DCNM server.
Step 6
a.
b.
The Proxy Server area appears below the check box.
c.
d.
e.
Step 7
The Cisco DCNM client user interface appears.
If a dialog box displays a message about device credentials, you have not configured device credentials for the user account that you specified.
Step 8
•
•
Note
Closing the Cisco DCNM Client
You can close the Cisco DCNM client when you are done using it.
DETAILED STEPS
Step 1
A dialog box displays a confirmation message.
Step 2
•
•
Step 3
If you started any statistical data collection processes during the Cisco DCNM client session, a dialog box displays the collection processes.
Step 4
a.
Note
b.
c.
Deploying Changes
When you use the Cisco DCNM client to make configuration changes to managed devices or to the Cisco DCNM server, you may need to deploy the changes or the Cisco DCNM client may deploy them automatically, depending upon what changes you have made.
•
•
To remind you of the necessity to deploy changes that the Cisco DCNM client is storing, the procedures in the Cisco DCNM documentation set include a deployment step.
Deploying server changes saves your changes on the Cisco DCNM server. For example, if you add a Cisco DCNM server user account, deploying your changes adds the user account to the Cisco DCNM server and does not affect managed devices.
Deploying configuration changes to a managed device causes the Cisco DCNM server to update the running configuration of the device.
Note
When you close the Cisco DCNM client and you have not deployed your changes, you can deploy them without canceling the process of closing the Cisco DCNM client. For more information, see the "Closing the Cisco DCNM Client" section.
Working with Statistics and Charts
This section describes how to use the statistical charts available on a Statistics tab.
This section includes the following topics:
•
•
•
•
Information about Statistics and Charts
You can use a Statistics tab to start and stop statistical monitoring for an object and to work with charts of statistical data about the selected object. For each chart, the Cisco DCNM client also provides overview charts, which allow you to see historical trends and to control the time scale of the standard chart.
When you start monitoring for a new chart, Cisco DCNM creates a new statistical collection process that appears in the Statistical Data Collection feature. For more information, see the "Administering Statistical Data Collection" section on page 14-1.
Licensing Requirements for Statistics and Charts
The following table shows the licensing requirements for this feature:
Accessing a Chart
You can access any chart. The charts that are available for a particular Statistics tab depend upon the feature and object selected.
DETAILED STEPS
Step 1
For example, choose Interfaces > Physical > Ethernet.
Step 2
The Statistics tab appears in the Details pane.
Note
Step 3
In the Statistics tab, one or more charts may appear.
Note
Step 4
Step 5
The chart status appears in the lower left corner of the chart pane. If the chart is not active, you must start statistical monitoring for the chart before you can use it. For more information, see the "Starting Statistical Monitoring for a Chart" section.
Starting Statistical Monitoring for a Chart
You can start statistical monitoring for a chart in the Statistics tab for any of the device configuration features that support statistical monitoring.
Note
DETAILED STEPS
Step 1
Step 2
Step 3
icon to start the collection process.
Step 4
Note
Stopping Statistical Monitoring for a Chart
You can stop statistical monitoring for a chart in the Statistics tab.
Note
DETAILED STEPS
Step 1
Step 2
icon.
Note
Using a Chart
The Cisco DCNM client provides the following options for using a chart:
•
•
•
•
•
This procedure provides basic instructions for using each of these options.
Note
DETAILED STEPS
Step 1
Step 2
Step 3
Step 4
Step 5
•
•
•
icon.
•
icon.
•
icon.
Step 6
•
icon.
•
icon.
•
icon.
Step 7
Using an Overview Chart
You can use an overview chart to view the historical trend of the statistical data of the current chart and to set the time scale of the standard chart.
BEFORE YOU BEGIN
Ensure that any device with data that you want to view on an overview chart is included on the list of Cisco DCNM-licensed devices. For more information, see the "Licensing Requirements for Statistics and Charts" section.
DETAILED STEPS
Step 1
Step 2
Step 3
In a new window, the overview chart displays the historical trends of the charted data.
Step 4
•
•
•
•
•
•
•
Step 5
Exporting a Chart
You can export a chart as a JPG image or as a comma-separated value (CSV) file.
When you export a chart as a JPG image, the image is of the chart as it appears when you export the image.
When you export a chart as a CSV file, the file contains all data from the statistical collection for the chart.
DETAILED STEPS
Step 1
Step 2
Step 3
Step 4
Step 5
•
•
Step 6
The Cisco DCNM client exports the chart in the file format that you specified.
Configuring Global Preferences
Using the Global Preferences dialog box, you can configure several preferences for how the Cisco DCNM client displays data and fields. The sections on the Global Preferences are as follows:
•
•
•
Configuring Monitoring Preferences
You can configure the default frequency for statistical data retrieval from monitored devices. The default frequency for statistical data retrieval is 30 seconds. This frequency determines the initial data retrieval frequency for a new chart. Users can override the default frequency by configuring the chart-specific setting.
You can also configure whether the Cisco DCNM client automatically opens statistical charts when you access the Statistics tab of an object for which Cisco DCNM is already collecting statistical data.
BEFORE YOU BEGIN
Determine how often you want Cisco DCNM to retrieve statistical data by default. Consider how important it is to your organization that charts update frequently. If very current charting data is important to your organization, consider using a short data retrieval frequency.
DETAILED STEPS
Step 1
The Global Preferences dialog box appears. Under Monitoring, the Default Monitoring Frequency drop-down list displays the current frequency for statistical data retrieval.
The default polling frequency is 30 seconds.
Step 2
Step 3
•
•
Step 4
Configuring the Maximum Age of Events Fetched from the Server
You can configure the maximum age of events that the Cisco DCNM client fetches from the Cisco DCNM server when you start the Cisco DCNM client. This setting affects how old the events are that the Cisco DCNM client displays in the Event Browser and on feature-specific Events tabs. By default, the Cisco DCNM client fetches events that occurred up to 1 hour prior to the Cisco DCNM client startup. You can configure the Cisco DCNM client to fetch events that are up to 24 hours old.
DETAILED STEPS
Step 1
The Global Preferences dialog box appears. Under Events, the Fetch events before drop-down list displays the current maximum age of events.
Step 2
Note
Step 3
Configuring Preprovisioning
Preprovisioning refers to configuring a managed device with settings for modes or protocols that are not enabled. The preprovisioning preference affects the following sections of the Cisco DCNM client interface:
•
When you enable preprovisioning, the Cisco DCNM client displays all port mode fields regardless of the setting in the Mode drop-down list. When you disable preprovisioning, the Cisco DCNM client displays only the port mode settings that are relevant to the currently selected port mode. For example, if preprovisioning is disabled and you choose Trunk from the Mode drop-down list, the Cisco DCNM client displays only the Trunk settings and hides the Access, PVLAN Host, and PVLAN Promiscuous fields.
Additionally, the dialog boxes for configuring the Access VLAN field and the Native VLAN field include the Create in the Device check box. When you enable preprovisioning, you can uncheck this check box if you want Cisco DCNM to configure the device to refer to a VLAN that is not currently configured. When you disable preprovisioning, this check box is always checked and Cisco DCNM creates the VLAN specified, if it does not already exist.
•
When you enable preprovisioning, the Cisco DCNM client displays MST settings regardless of the settings in the Protocol drop-down list. When you disable preprovisioning, the Cisco DCNM client displays the MST Setting fields unless you choose MST from the Protocol drop-down list.
DETAILED STEPS
Step 1
The Global Preferences dialog box appears. Under Pre Provision, the Pre Provision check box appears.
Step 2
•
•
Step 3
Using Online Help
Online help has the following features:
•
You can expand and collapse individual topics in the contents. You can also collapse or expand all topics.
•
•
To access the welcome page in online help, from the menu bar, choose Help > Help Contents.
Cisco DCNM online help includes context-sensitive help.
To access context-sensitive help for a feature, follow these steps:
Step 1
Step 2
•
•
Online help for the selected feature appears in a browser window. Cisco DCNM uses the default browser application on the computer that runs the Cisco DCNM client.
Additional References
For additional information related to using the Cisco DCNM client, see the following sections:
Related Documents
Installing and launching the Cisco DCNM client
Information about using specific Cisco DCNM features
Obtaining Documentation and Submitting a Service Request, page xix
Standards
No new or modified standards are supported by this feature, and support for existing standards has not been modified by this feature.
—
Feature History for Using the Cisco DCNM Client
Table 3-1 lists the release history for this feature.
 Feedback