WatchDog Commands
Available Languages
Table Of Contents
Information Produced: Name Column
Information Produced: State Column
Information Produced: Gen Column
Information Produced: Exec Time Column
Information Produced: PID Column
Information Produced: Success Column
Information Produced: Missed Column
Average, Minimum, and Maximum % CPU Utilization per Time Period
Average, Minimum, and Maximum % Memory Usage per Time Period
Average, Minimum, and Maximum Virtual Memory Usage per Time Period
WatchDog Commands
The WatchDog is responsible for bootstrapping the MPLS VPN Solution and starting the necessary set of server processes. In addition, the WatchDog monitors the health and performance of each server to ensure it is functioning properly. In the event of a software error that causes a server to fail, the WatchDog automatically restarts the errant server.
The WatchDog is a background daemon process that is automatically installed as part of the installation procedure for MPLS VPN Solution. After the installation procedure has been completed, you can execute the startwd command to run the WatchDog for the first time. The WatchDog is automatically started any time the machine is rebooted.
This chapter provides the description, syntax, and arguments (listed alphabetically) for the following WatchDog commands:
startwd Command
This section provides the description and syntax for the startwd command.
Description
The startwd command starts the WatchDog and all MPLS VPN Solution processes. Running this manually is necessary after installing new software, after changing the csm.properties file, or when restarting after issuing a stopwd command. The startwd command is run automatically when the machine is rebooted.

Note
The Orbix daemon must be running for the startwd command to operate correctly. If the Orbix daemon is not running, you will receive a message indicating that.
Syntax
startwd
Note
Note
stopwd Command
This section provides the description and syntax for the stopwd command.
Description
The stopwd command stops the WatchDog and all MPLS VPN Solutionprocesses. Normally this will only be necessary before installing new versions of MPLS VPN Solution or changing the csm.properties file. When stopping and restarting the WatchDog, the csm.properties file is reread.
Syntax
stopwd [-y]
where: -y
indicates not to prompt before shutdown. If -y is not specified, you are prompted with the following message: "Are you absolutely sure you want to stop the watchdog and all of its servers? Other users may be using this system as well. No activity (e.g.: collections, performance monitoring, provisioning) will occur until the system is restarted." You are then prompted to reply yes or no.
Note
wdclient Command
This section provides the description, syntax, and options (listed alphabetically) for the wdclient subcommands. These subcommands are diagnostic tools. This section also describes the column format of the output of each of the subcommands.
Note
The following are the wdclient subcommands:
–
–
–
–
–
–
wdclient group Subcommand
This section provides the description and syntax for the wdclient group subcommand.
Description
The wdclient group subcommand lists the servers in the specified server group. Server groups provide a convenient way to start or stop a group of servers with a single command.
Syntax
wdclient
[-host<hostname>]group<group_name>where:
-host
<hostname> is an optional parameter. <hostname> is the name of the remote host on which the WatchDog is running.<group_name> is the name of a server group chosen from the list displayed by the wdclient groups command.
wdclient groups Subcommand
This section provides the description and syntax for the wdclient groups subcommand.
Description
The wdclient groups subcommand lists all the active server groups.
Syntax
wdclient
[-host<hostname>]groupswhere:
-host
<hostname> is an optional parameter. <hostname> is the name of the remote host on which the WatchDog is running.wdclient log Subcommand
This section provides the description and syntax for the wdclient log subcommand.
Description
The wdclient log subcommand displays the specified number of lines of the specified server log.
Syntax
wdclient
[-host<hostname>] [-poll<seconds>]log<log_name>[<lines>]where:
-host
<hostname> is an optional parameter. <hostname> is the name of the remote host on which the WatchDog is running.-poll
<seconds> is an optional parameter. <seconds> is the number of seconds. A number other than zero indicates that when new status data is available it will be displayed every <seconds> seconds, where <seconds> is the specified number of seconds. The default -poll value is zero (0).<log_name> is the name of a server log displayed by the wdclient logs command.
<lines> is an optional parameter. It is the number of lines (1 to 100) to be displayed from the end of the log. The default number of lines is 100.
Note
wdclient logs Subcommand
This section provides the description and syntax for the wdclient logs subcommand.
Description
The wdclient logs subcommand lists the names of all the logs.
Syntax
wdclient
[-host<hostname>]logswhere: -host
<hostname> is an optional parameter. <hostname> is the name of the remote host on which the WatchDog is running.wdclient restart Subcommand
This section provides the description and syntax for the wdclient restart subcommand.
Description
The wdclient restart subcommand restarts one or more servers. Any dependent servers will also be restarted.
Note
Syntax
wdclient
[-host<hostname>]restart{<server_name>|group<group_name>|all}where:
-host
<hostname> is an optional parameter. <hostname> is the name of the remote host on which the WatchDog is running.You must choose one of the following arguments:
<server_name> is the name of a server chosen from the list displayed by the wdclient status command. See Table 2-1, "Servers and Their Functions," for server descriptions.
group
<group_name> is the term group followed by the name of a server group chosen from the list displayed by the wdclient groups command.all is all servers.
wdclient start Subcommand
This section provides the description and syntax for the wdclient start subcommand.
Description
The wdclient start subcommand starts one or more servers. Other servers that depend on the specified server(s) may also start.
Note
Syntax
wdclient
[-host<hostname>]start{<server_name>|group<group_name>|all}where:
-host
<hostname> is an optional parameter.<hostname> is the name of the remote host on which the WatchDog is running.You must choose one of the following three arguments.
<server_name> is the name of a server chosen from the list displayed by the wdclient status command. See Table 2-1, "Servers and Their Functions," for server descriptions.
group
<group_name> is the name of a server group chosen from the list displayed by the wdclient groups command.all is all servers.
wdclient status Subcommand
This section provides the description, syntax, and information produced for the wdclient status subcommand.
Description
The wdclient status subcommand lists all the servers and their states. See Table 2-2, "Valid States," for the list of all the states.
Syntax
wdclient
[-host<hostname>] [-poll<seconds>]statuswhere:
-host
<hostname> is an optional parameter. <hostname> is the name of the remote host on which the WatchDog is running.-poll
<seconds> is an optional parameter. <seconds> is the number of seconds. A number other than zero indicates that when new status data is available it will be displayed every <seconds> seconds, where <seconds> is the specified number of seconds. The default -poll value is zero (0).Information Produced: Name Column
The Name column provides the name of each of the servers. Table 2-1 provides a list of the servers and a description of the function that each server provides.
Information Produced: State Column
The State column provides the current state of the server. Table 2-2 provides a description of each of the states in normal progression order.
Information Produced: Gen Column
The Gen column provides the generation of the server. Each time the server is started, the generation is incremented by 1.
Information Produced: Exec Time Column
The Exec Time column provides the date and time the server was last started.
Information Produced: PID Column
The PID column provides the UNIX process identifier for each server.
Information Produced: Success Column
The Success column provides the number of successful heartbeats since the server was last started. Heartbeats are used to verify that servers are functioning correctly.
Information Produced: Missed Column
The Missed column provides the number of missed heartbeats since the server was last started.
A few missed heartbeats could simply indicate the system was busy. However, more than a couple of missed heartbeats per day could indicate a problem. See the logs to diagnose the reason. If a server misses three heartbeats in a row, the server is automatically restarted.
Note
wdclient stop Subcommand
This section provides the description and syntax for the wdclient stop subcommand.
Description
The wdclient stop subcommand stops one or more servers. Other servers that depend on the specified servers will also stop.
Note
Syntax
wdclient
[-host<hostname>]stop {<server_name>|group<group_name>|all}where:
-host
<hostname> is an optional parameter. <hostname> is the name of the remote host on which the WatchDog is running.You must choose one of the following arguments.
<server_name> is the name of a server chosen from the list displayed by the wdclient status command. See Table 2-1, "Servers and Their Functions," for server descriptions.
group
<group_name> is the name of a server group chosen from the list displayed by the wdclient groups command.all is all servers.
wdgui Command
This section provides the description and syntax for the wdgui command. This graphical interface to the WatchDog is a diagnostic tool that combines the functionality of the wdclient status and wdclient log commands. This section also describes the column format of the output when you click each of the tabs.
Description
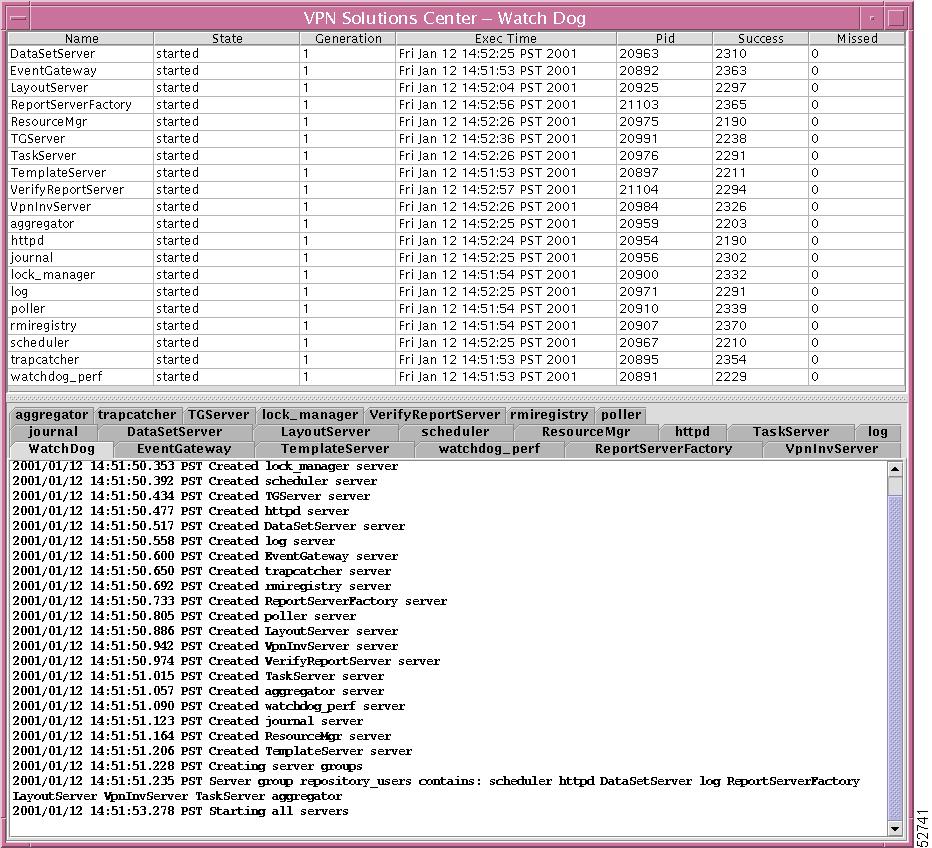
The wdgui command activates the WatchDog user interface. See Figure 2-1, "VPN Solutions Center—Watch Dog."
The top of the screen provides a list of the names of servers. You can drag and drop the columns of information to rearrange them. The columns of information about the servers are described in the following sections:
The bottom of the screen provides tabs for each of the servers. Click the tab of the server that you want to track and you will get up to the most current 250 lines of detailed log information.
Syntax
wdgui [&]
Note
Figure 2-1 VPN Solutions Center—Watch Dog
Name Column
The Name column provides the name of each of the servers. Table 2-3 provides a list of the servers and a description of the function that each server provides.
Note
State Column
The State column provides the current state. Table 2-4 provides a description of each of the states in normal progression order.
Generation Column
The Generation column provides the generation of the server. Each time the server is started, the generation is incremented by 1.
Exec Time Column
The Exec Time column provides the date and time that the server was last started.
Note
Pid Column
The Pid column provides the UNIX process identifier for each server.
Success Column
The Success column provides the number of successful heartbeats since the server was last started. Heartbeats are used to verify that servers are functioning correctly.
Note
Missed Column
The Missed column provides the number of missed heartbeats since the server was last started.
A few missed heartbeats could indicate that the system was busy. However, more than a couple of missed heartbeats per day could indicate a problem. See the logs to diagnose the reason. If a server misses three heartbeats in a row, the server is automatically restarted.
Note
wdperf Command
This section provides the description, syntax, and report information for the wdperf command. This section also describes the reports that are generated by executing this command and the common information in these reports:
•
•
•
This graphical interface to the WatchDog provides information about system performance and resource utilization.
Note
Description
The wdperf command is a monitoring tool for MPLS VPN Solution that provides reports indicating the % CPU utilization, the % Memory usage, and the amount of virtual memory used by each of the system's servers and user-defined tasks. The reported values are based on performance data gathered by the WatchDog.
Syntax
wdperf [%cpu | %mem | vmem] [&]
or
wdperf {%cpu | %mem | vmem} [<date> | start] [&]
where:
%cpu is a parameter that causes the Average % CPU Utilization per Hour report to be displayed. This is the default option.
%mem is a parameter that causes the Average % Memory Utilization per Hour report to be displayed.
vmem is a parameter that causes the Average Virtual Memory Utilization per Hour report to be displayed.
<date> is an optional parameter that specifies the date for which performance data will be displayed. The default date is the current date. The format of the date is either: mm/dd/yy or mm/dd/yyyy, where:
•
•
•
start is an optional parameter that causes the earliest available performance data to be displayed (that is, the repository creation date).
& is an optional parameter that causes wdperf to be run as a background process.
Note
Report Information
For a description of the reports created by the wdperf command, first see explanations of the generic report fields in the "Status Row" and "Filter Information" sections in Chapter 14, "Reports Overview." Additionally, each report has the following information:
Results Area
The columns of information are as follows:
•
•
Detail Area
The information in this area is:
pid = <####>
where: <####> is the Process identifier of the server or task (process) that you highlight in the Results Area.start time = localized date, time, and time zone when the server or task (process) that you highlight in the Results Area started.
Note
Bottom Task Bar
From left to right, the bottom task bar includes the following items:
•
•
Note
•
–
–
–
•
–
–
–
•
Average, Minimum, and Maximum % CPU Utilization per Time Period
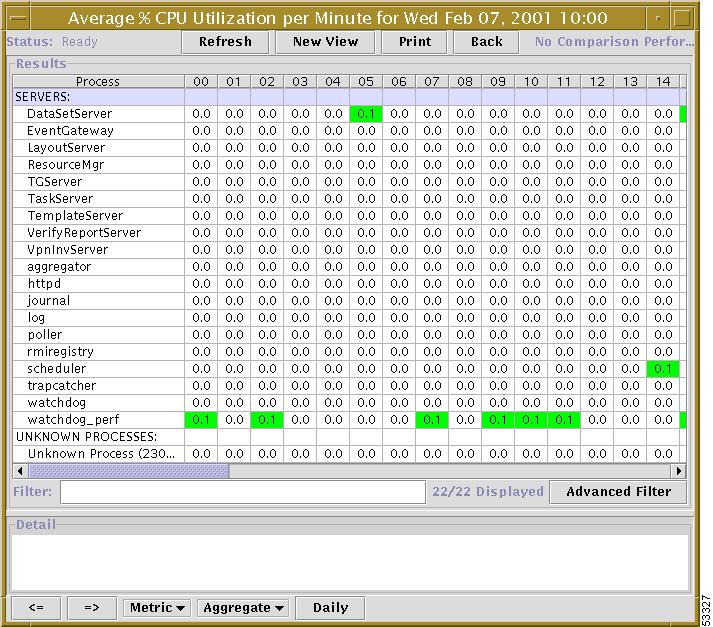
These reports display the percentage of the CPU that is being occupied by each of the WatchDog's processes. Values less than 20% are displayed in green, those between 20% and 50% are displayed in yellow, and those greater than 50% are displayed in red.
The Average % CPU Utilization per Hour report for the current date is the default report if you do not specify another Metric on the command line, as specified in the "Syntax" section, and maintain the default Aggregate selection on the bottom task bar.
See a sample of the % CPU Utilization report, as shown in Figure 2-2, "% CPU Utilization Report.
Some processes in MPLS VPN Solution launch children processes as an Unknown Process. The command line command that launches the Unknown Process can be selected in the top window, and its related arguments (args) are listed in the Detail pane.
From this report, you can use the controls in the bottom task bar to navigate to reports displaying other metrics, aggregates, and display periods.
Figure 2-2 % CPU Utilization Report
Average, Minimum, and Maximum % Memory Usage per Time Period
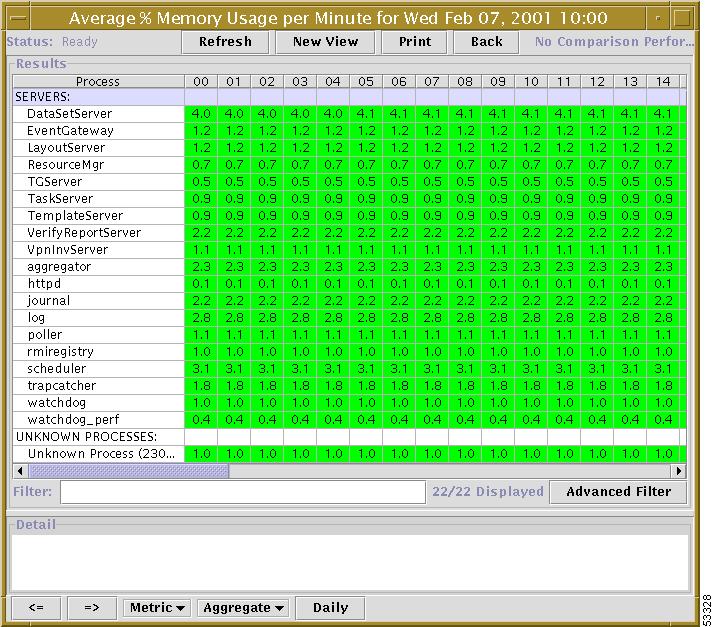
These reports display the percentage of the machine's physical memory that is being used by each of the WatchDog's processes. Values less than 20% are displayed in green, those between 20% and 50% are displayed in yellow, and those greater than 50% are displayed in red.
The Average % Memory Utilization per Hour report for the current date is the report that is displayed if you specify %mem on the command line and maintain the other defaults on the command line, as specified in the "Syntax" section, and the default Aggregate selection on the bottom task bar.
See a sample of the % Memory Utilization report, as shown in Figure 2-3, "% Memory Utilization Report."
From this report, you can use the controls in the bottom task bar to navigate to reports displaying other metrics, aggregates, and display periods.
Figure 2-3 % Memory Utilization Report
Average, Minimum, and Maximum Virtual Memory Usage per Time Period
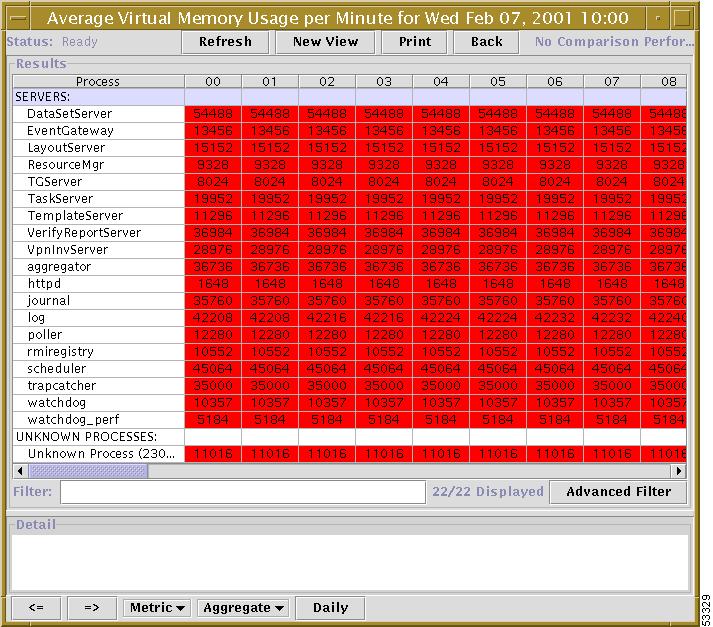
These reports display the amount of virtual memory (in kilobytes) allocated to each of the WatchDog's processes. Values are displayed in various color shades to highlight memory usage trends.
The Average Virtual Memory Utilization per Hour report for the current date is the report that is displayed if you specify vmem on the command line and maintain the other defaults on the command line, as specified in the "Syntax" section, and the default Aggregate selection on the bottom task bar.
See a sample of the Virtual Memory Utilization report, as shown in Figure 2-4, "Virtual Memory Utilization Report."
From this report, you can use the controls in the bottom task bar to navigate to reports displaying other metrics, aggregates, and display periods.
Figure 2-4 Virtual Memory Utilization Report
 Feedback
Contact Cisco
- Open a Support Case

- (Requires a Cisco Service Contract)
This Document Applies to These Products
- Collaboration Endpoints - Retired Products
- Conferencing - Retired Products
- Contact Center - Retired Products
- Optical Networking - Retired Products
- Routers - Retired Products
- Security - Retired Products
- Servers - Unified Computing (UCS) Retired Products
- Storage Networking Retired Products
- Switches - Retired Products
- Video - Retired Products
- Wireless - Retired Products