![]()
Monitoring Cisco MSX Service Status in Cisco MSX GUI
The Cisco MSX GUI has:
-
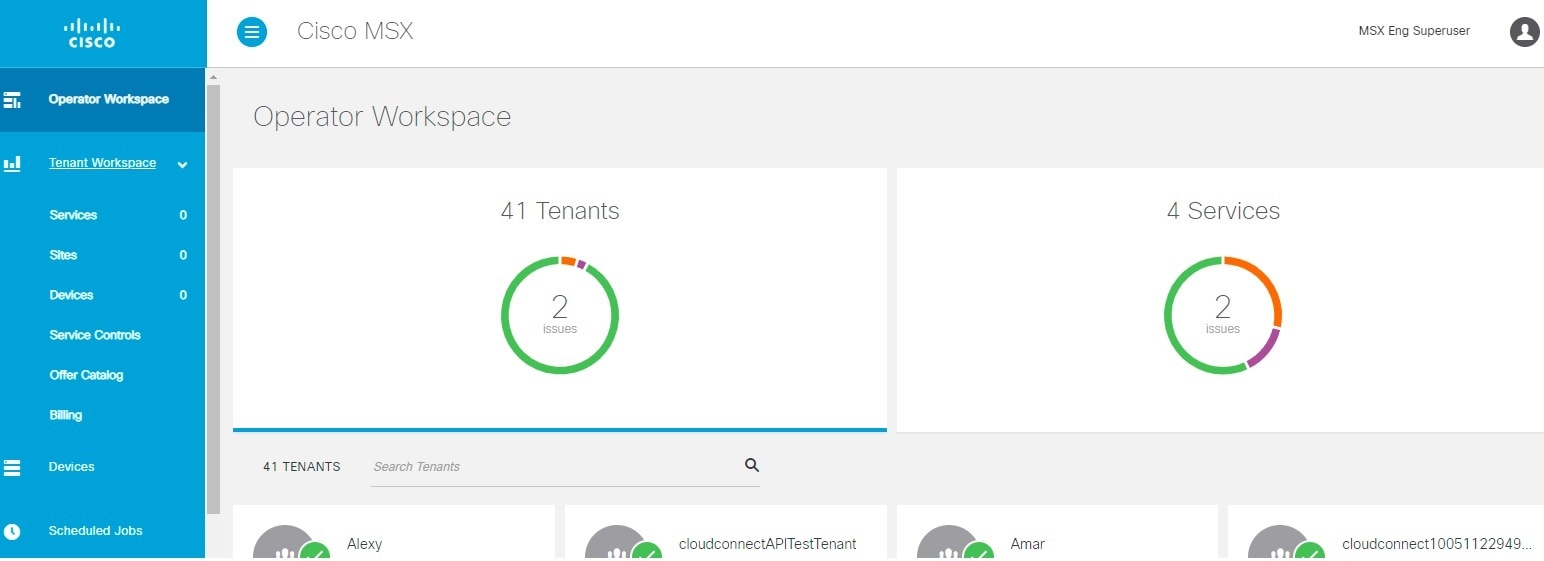
The Operator Workspace is only visible to operator users. It lists all tenants that the operator is managing and the services they have subscribed to.
Click on a tenant's tile to see details specific to a tenant in the Tenant Workspace GUI.
-
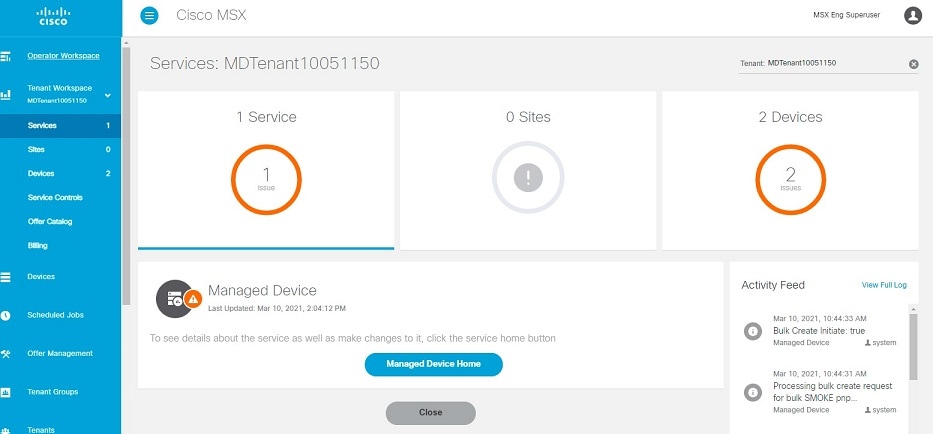
The Tenant Workspace, which allows tenants to access the information related to their subscribed services.
 Note |
Only users with operators permission can view the Operator Workspace. |
The figure below shows the Operator Workspace:
Note |
Only a user with the permissions to manage this Tenant can access the Tenant’s Workspace. |
The figure below shows the Tenant Workspace:
Viewing Tenant Workspace
A Tenant Workspace allows tenants to access the information related to their subscribed services.
|
Menu Name |
Displays | ||
|---|---|---|---|
|
Services |
Display all services subscribed by a tenant, service status, and other service metrics. | ||
|
Sites |
Display an overview of the tenant’s sites, site status, and allows access to site details.
|
||
|
Devices |
Display an overview of the tenant’s devices, device status, and allows access to device details.
|
||
| Service Controls | Display the custom service controls that are used to manage the services. | ||
| Offer Catalog | Display existing subscriptions and allows subscribing to new services. | ||
| Billing | Display billing information about the tenant’s subscriptions. | ||
| Settings | Configure service-level settings. |
Monitoring Cisco MSX Service Status
The displayed status of a service is based on the lifecycle status of the service, or the health status when the lifecycle status of a service is provisioned.
| Service Overall Status Indication | Service Status |
|---|---|
| Purple | In Progress |
| Red | Critical |
| Orange | Poor |
| Yellow | Fair |
| Grey | Unknown |
| Green | Good |
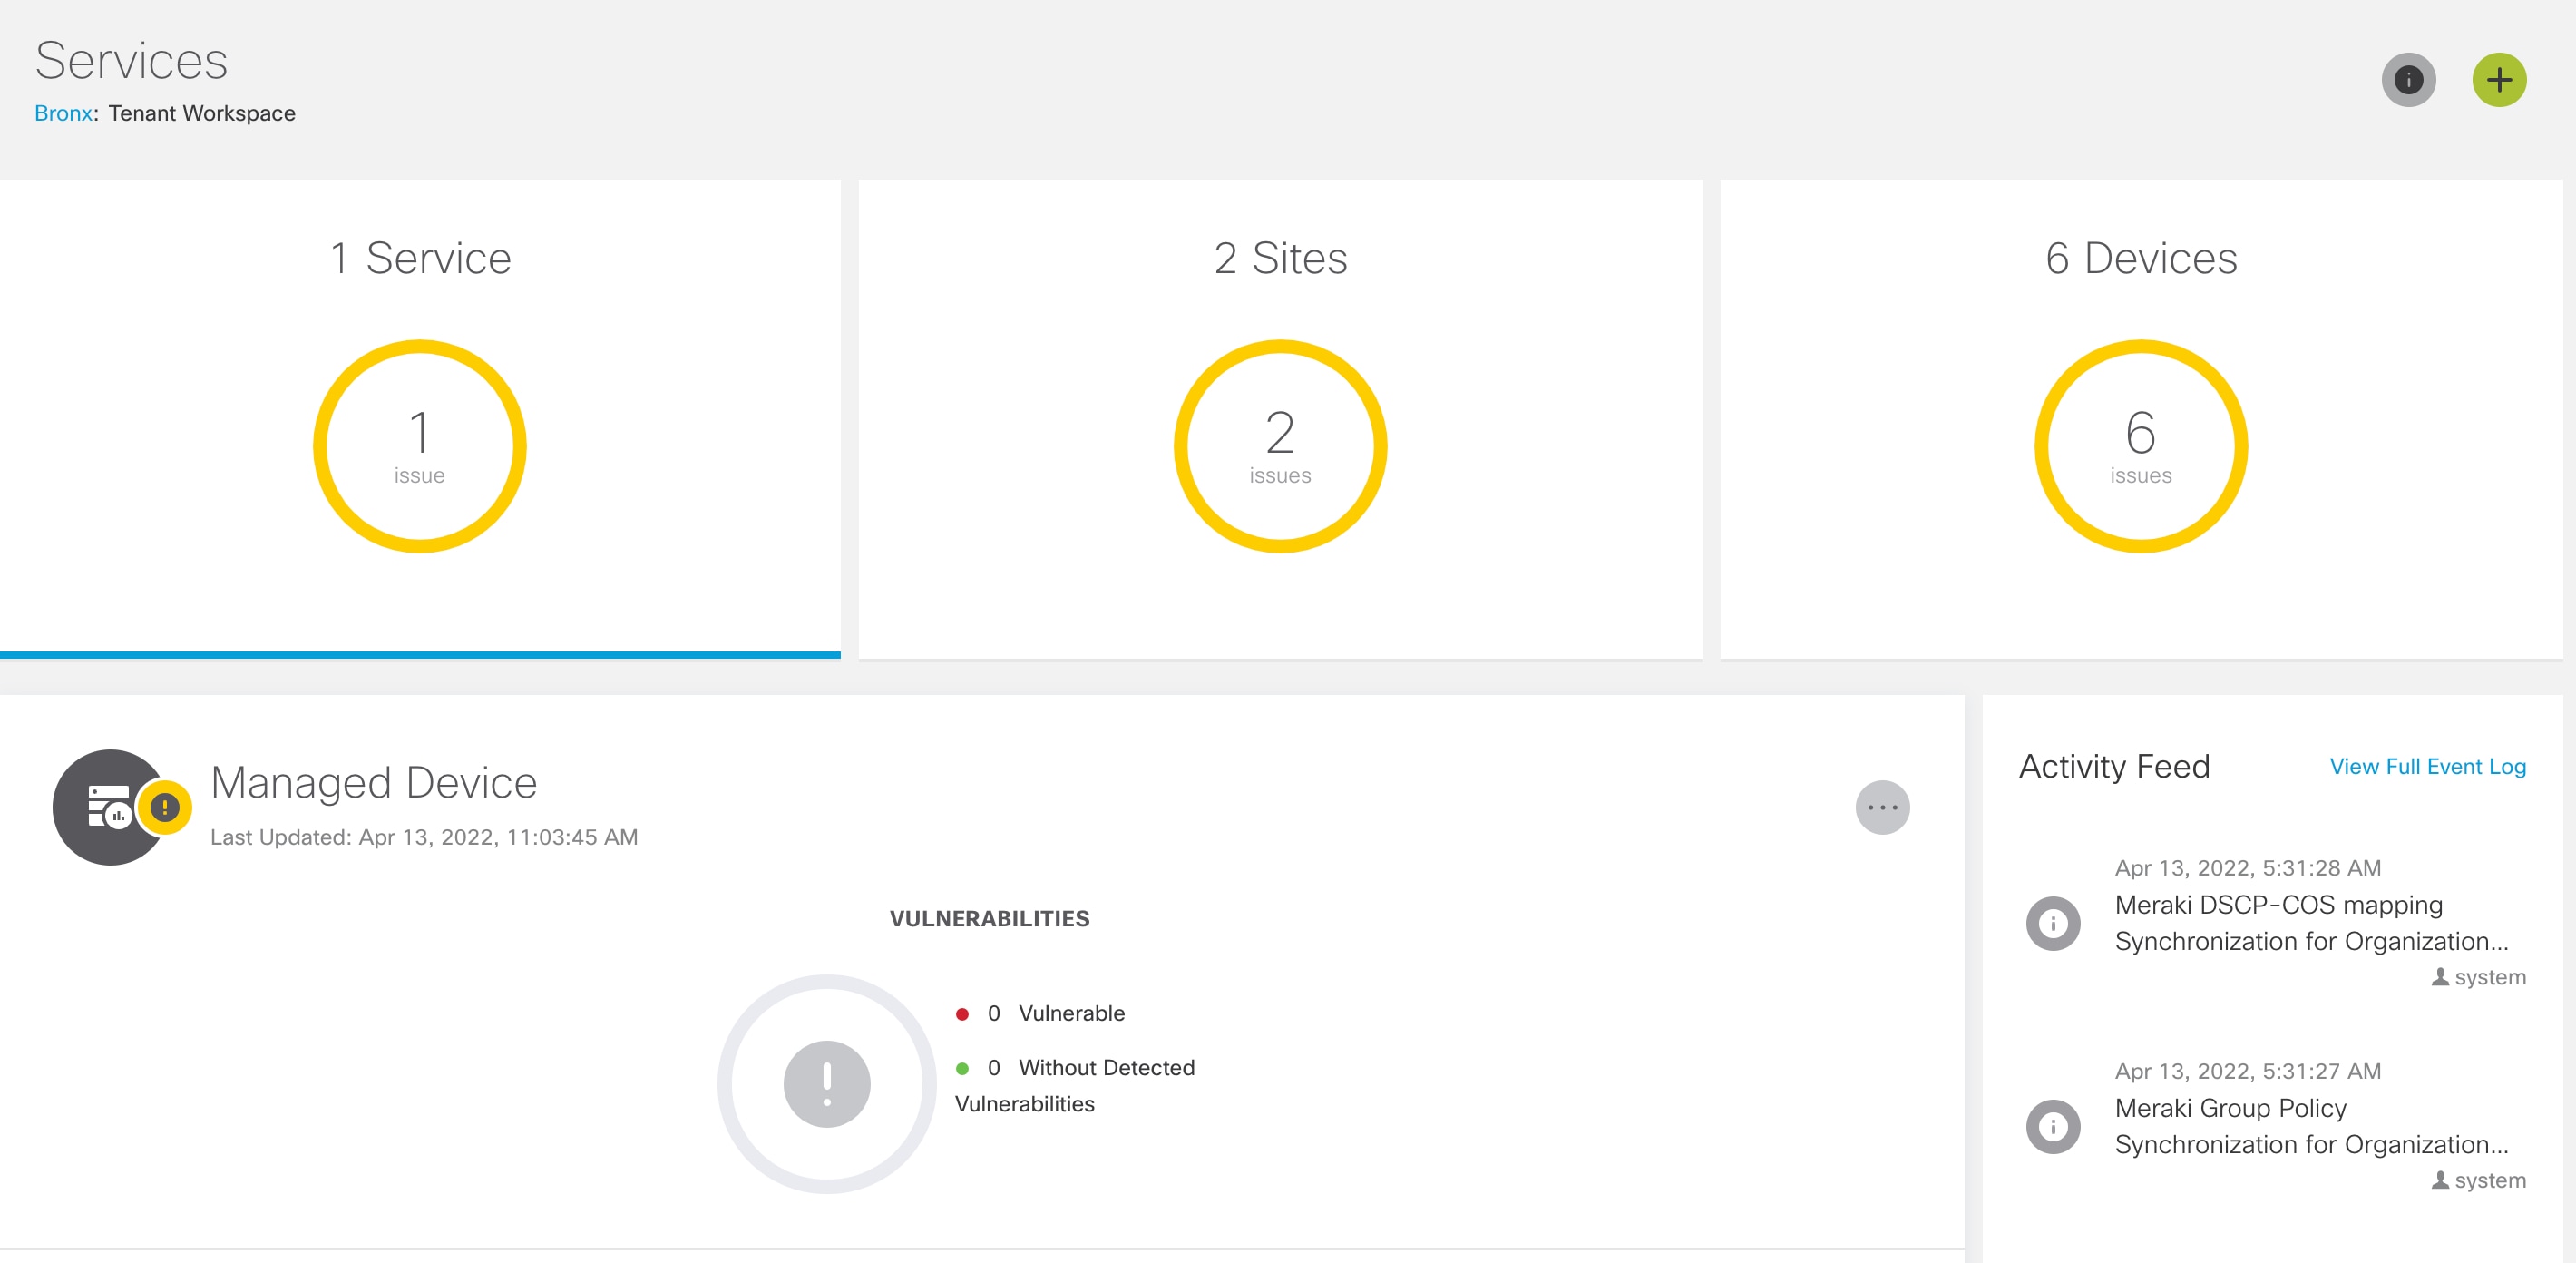
The figure below displays the aggregated service status:
Using this procedure, you can view the service status.
Procedure
| Step 1 |
Log in to the Cisco MSX portal using your credentials. |
| Step 2 |
From the left pane, choose Tenant Workspace > Services. |
| Step 3 |
To view the overall status of a service, click to expand a particular service panel. The service and the overall status of the sites using the services are displayed. Also, the list of devices being used for the selected service is displayed. |
Monitoring Cisco MSX Site Status
The Cisco MSX platform provides site status updates based on the health status of the devices attached to the site, not the overall device status. The site status are categorized as critical, poor, fair, good, unknown and in progress. The device health status are categorized as Up, Down, and Unknown.
The status of devices in the Cisco MSX system are updated periodically. The health updates are triggered by monitor microservice. The device beat constantly pings the device and the monitor microservice queries the data produced by the beat to update the health status.
The table below describes the site status calculation:
|
Device Condition |
Site Status |
Site Overall Status Icon |
|---|---|---|
|
No device. |
Good |
Green |
|
All devices are Up. |
Good |
Green |
|
All devices are down. |
Critical |
Red |
|
All devices are unknown. |
Unknown |
Grey |
|
Devices with different health status. |
Values correspond to the device with the highest severity number. |
|
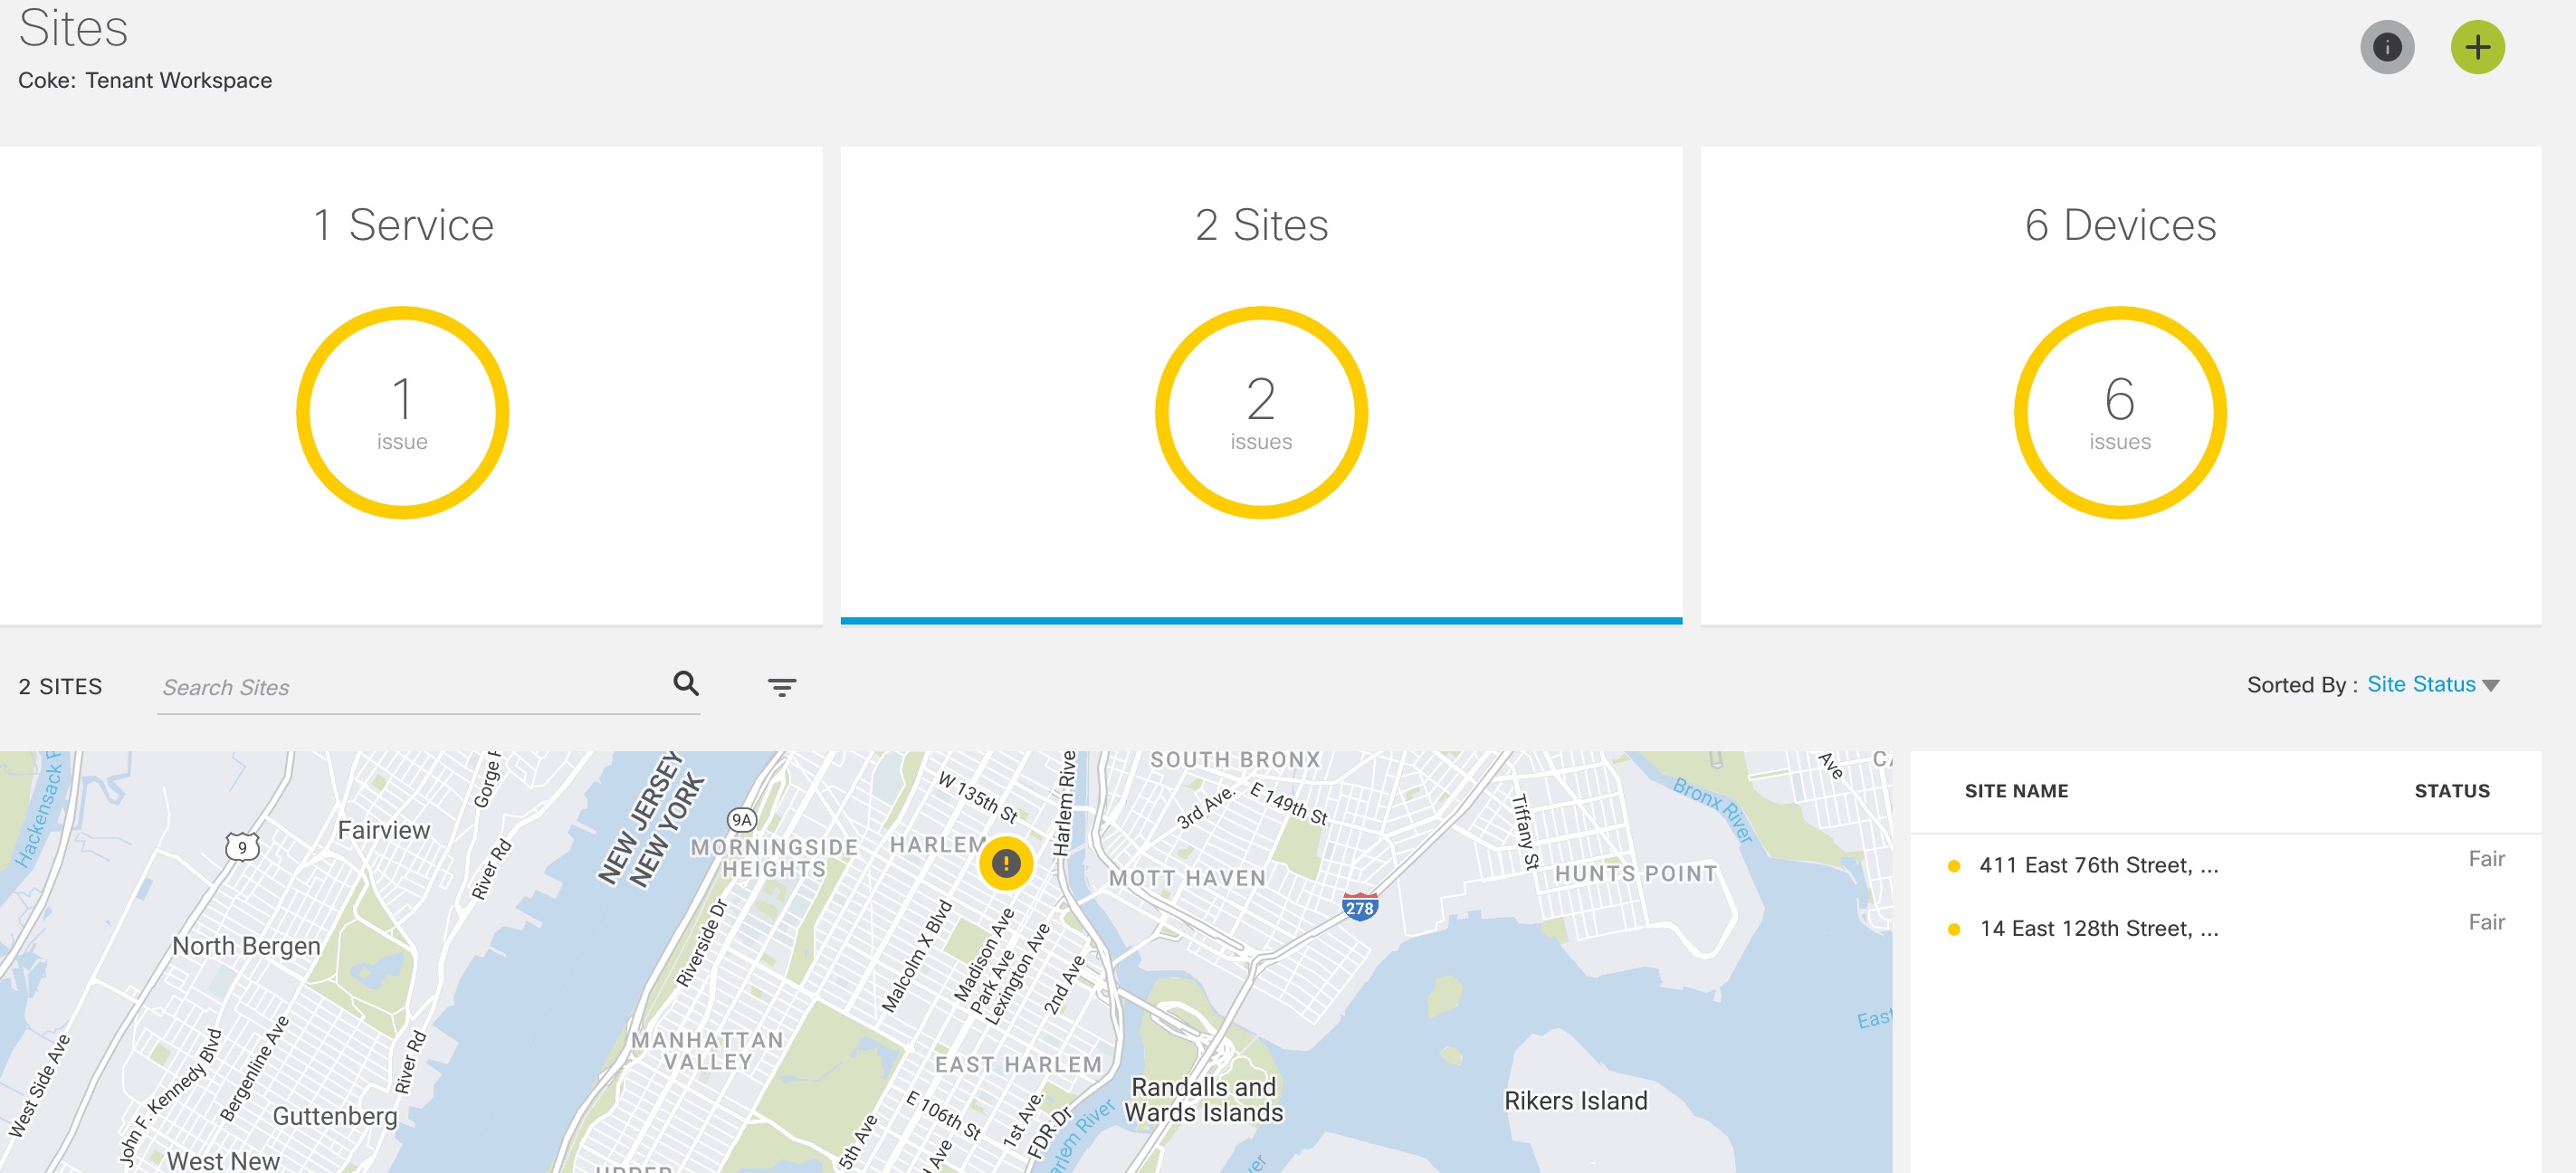
The figure below displays the status of the individual site and aggregated sites:
Using this procedure, you can view the site status.
Procedure
| Step 1 |
Log in to the Cisco MSX portal using your credentials. |
| Step 2 |
From the left pane, choose Tenant Workspace > Sites. The Sites Overview window is displayed. |
| Step 3 |
To view the status of one site, hover the mouse pointer over the Site icon on the map view. The site name and its corresponding status are displayed. |
| Step 4 |
Click the Site icon to land on the Site Overview window. Alternatively, you can use the list view or the tile view to access Site Overview window. The list view of the sites appear on the right pane and its corresponding site status are also indicated. Hover the mouse pointer on the Sites to know the aggregate site status data. |
Monitoring Cisco MSX Device Status
The Devices menu option in the Tenant Workspace provides the devices' overall state. The Devices menu displays both mapped (latitude and longitude defined) or unmapped devices.
The overall device state is calculated based on various status, such as device lifecycle status, device health status, tunnel status, pnp status, sync status.
Within Cisco MSX, the state of the device is categorized as critical, poor, fair, good, unknown, and in progress. An overall state looks into the available statuses (lifecycle, device health, or other status) for a device and picks the device overall status indication and maps it to the below overall status.
| Overall Status | In Progress | Critical | Poor | Fair |
Unknown |
Good |
|---|---|---|---|---|---|---|
| Device Overall Status Indication | Purple | Red | Orange | Yellow | Grey | Green |
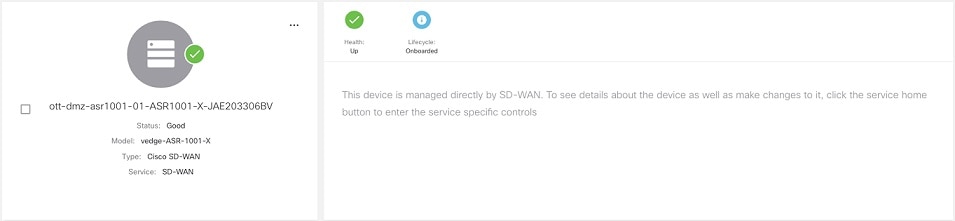
The following figure illustrates overall device state, device health, and lifecycle status for an SD-WAN device.
Using this procedure, you can view the device status.
Procedure
| Step 1 |
Log in to the Cisco MSX portal using your credentials. |
| Step 2 |
From the left hand pane, choose Tenant Workspace > Devices. The Devices Overview window is displayed with overall status of the devices. 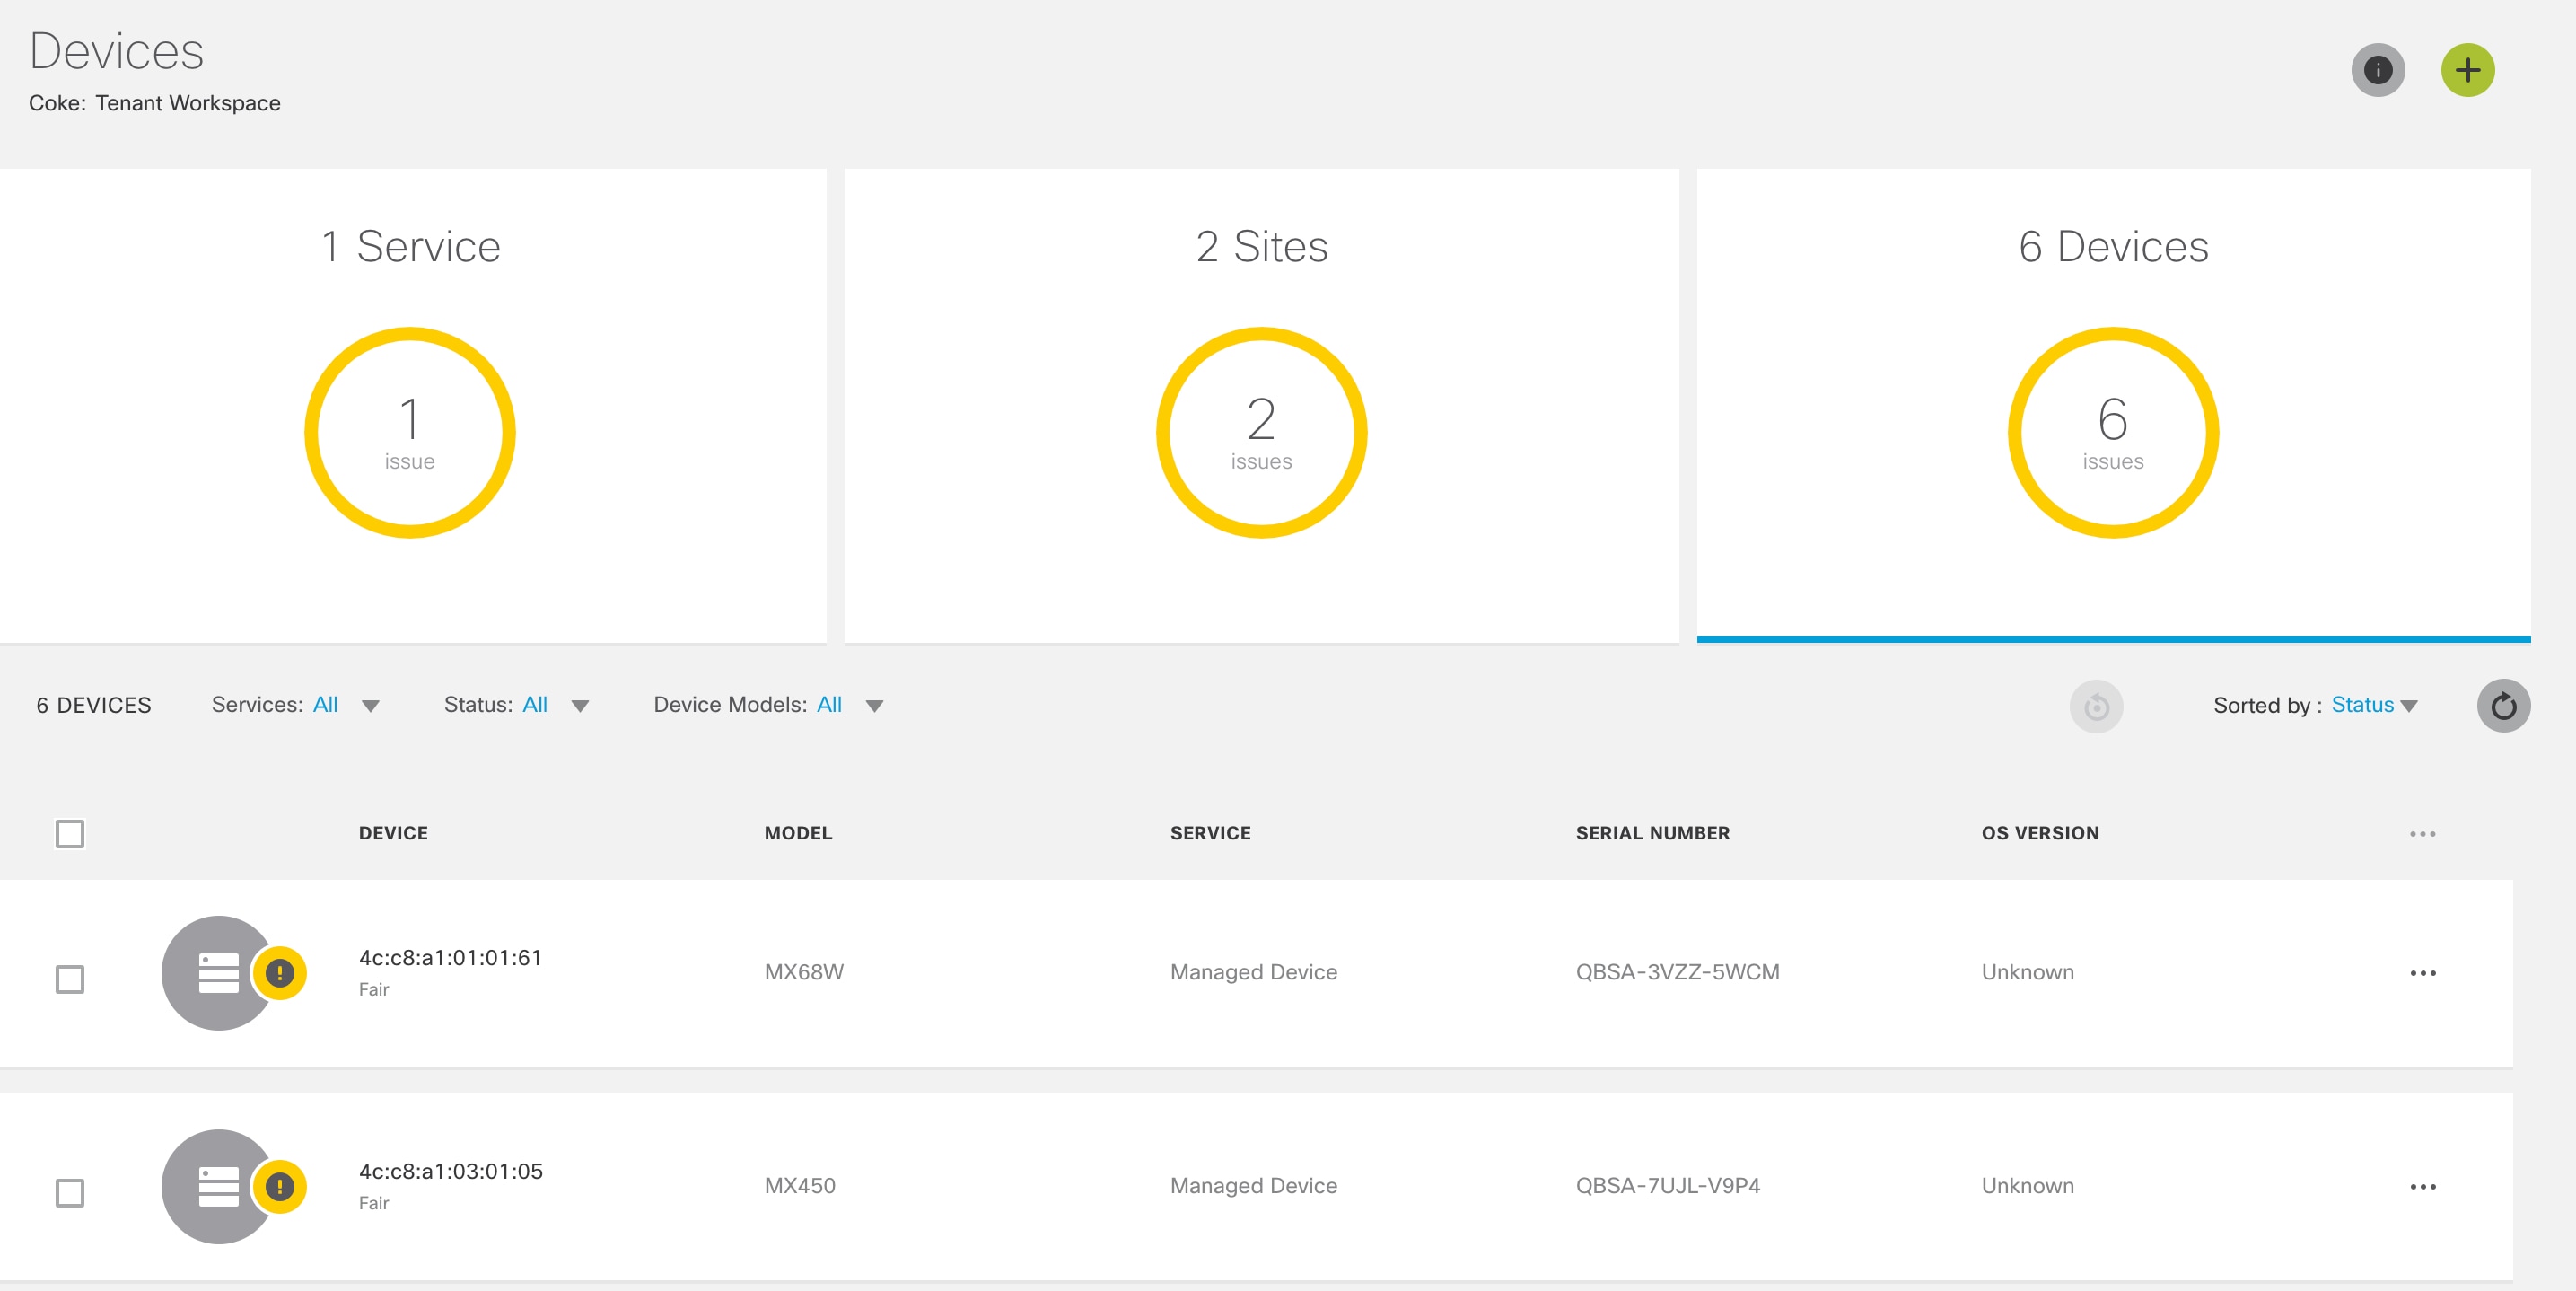
|
| Step 3 |
To view the status of a device, hover the mouse over the device and click to view the device summary. The device view expands and its overall status is displayed. |
| Step 4 |
Click Device Details to view additional details of the device. |
Viewing an Event Log
Using this procedure, you can view an event log.
Procedure
| Step 1 |
Log in to the Cisco MSX portal using your credentials. |
| Step 2 |
From the left pane, click Event Log. The Event Log window is displayed. |
| Step 3 |
From the Event Log screen, filter the event log records. Select the available tenant from the drop-down. You can filter these events by severity and time frame. To list event logs for a specific duration, select the Custom Range and specify the dates. The figure below displays the Event Logs window: 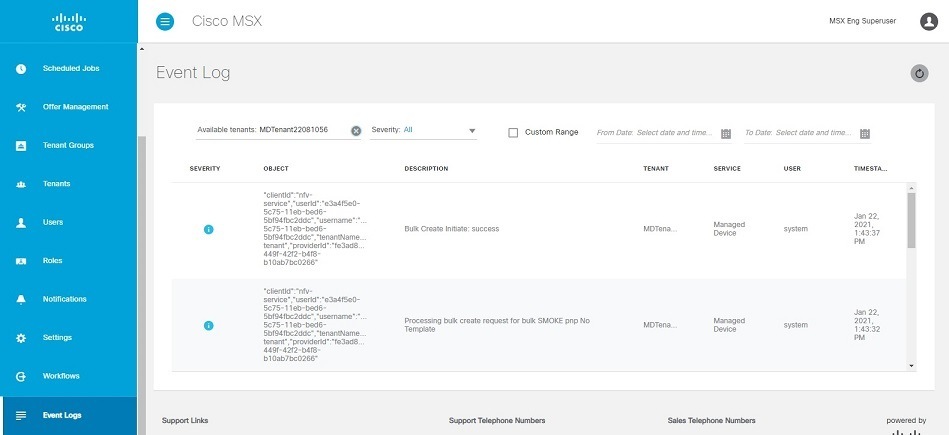
|
Page-Level Actions
The following table lists the page-level actions available for various services in Cisco MSX:
|
Cisco MSX Services |
Page-Level Actions Available with Documentation Links |
|---|---|
|
Managed Device |
|
|
Enterprise Access |
|
|
SD-WAN |
Add Site |
Monitoring Service Panel
The Service Panel in the Tenant Workspace allows tenants to see the next steps that they can perform for their subscribed services. After the services are set up and the network has connectivity, the panel also shows the services-related metrics.
Service-Specific Actions
Tenants can perform additional operations for the subscribed services from the service panel using the ellipsis (...) and the (+) options. Use the table below to know more about the service-specific actions:
|
Cisco MSX Services |
Service-Level Actions Available with Documentation Links |
|---|---|
|
Managed Device |
|
|
Enterprise Access |
|
|
SD-WAN |
|
![]()
 Feedback