Cisco Tidal Enterprise Scheduler 6.2 Performance Tuning Guide
Available Languages
Table of Contents
Cisco Tidal Enterprise Scheduler 6.2 Performance Tuning Guide
Master and Client Manager DB Configuration
Monitoring Scheduling Activity
Monitoring the Ov erall Me ssage Sy stem
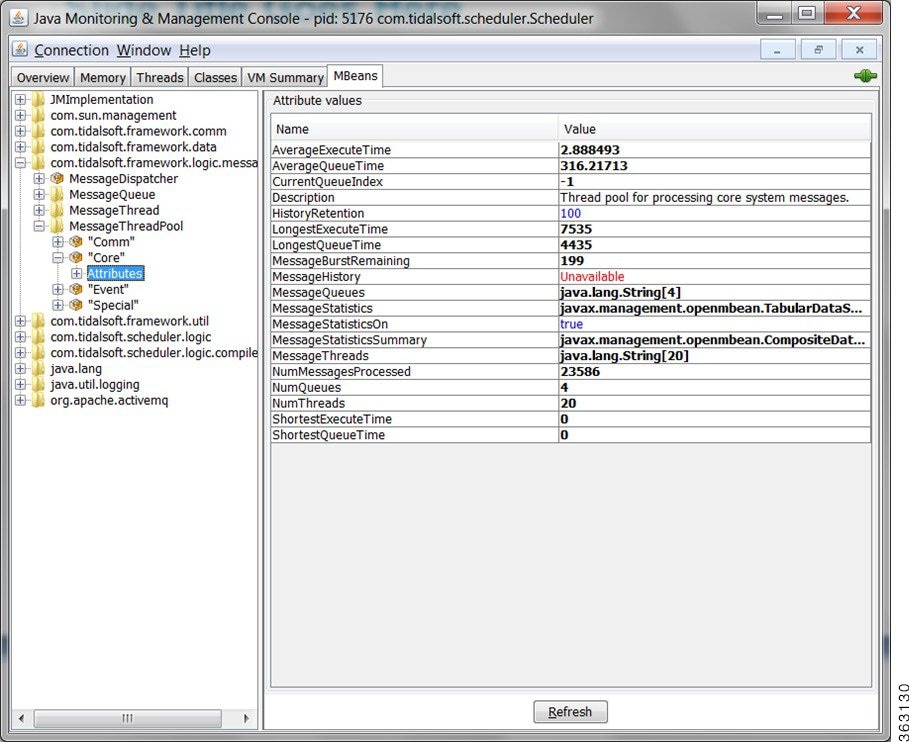
Monitoring a Me ssage Th read Po ol
Monitoring the Queue Manager Compiler
Monitoring the Me ssage Qu eue Co mpiler
Monitoring Adapter/Agent Connections
Viewing Al l Co nnections and St atuses
Monitoring Ad apter Co nnections via JConsole
Viewing the Cache Sy nc Lo gging
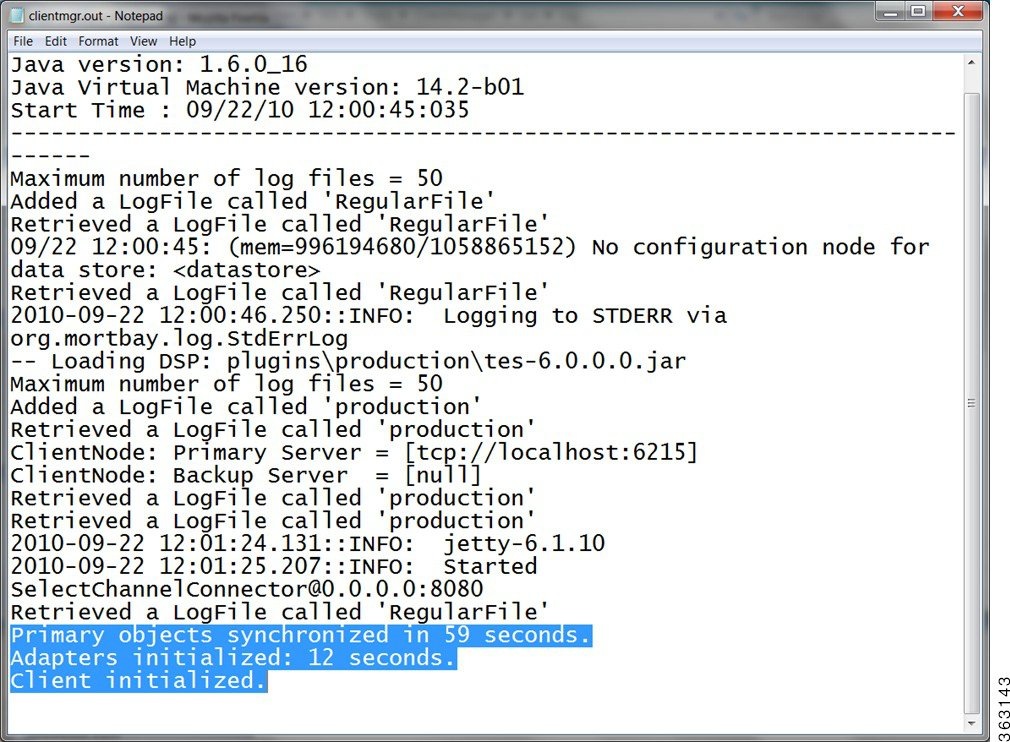
Viewing the Client Manager Output Log
Size-Based Guidelines for Tuning Your Environments
Optimizing TES Performance
The purpose of this document is to help you troubleshoot performance issues with Tidal Enterprise Scheduler. Optimization and tuning is an exact science which is why it is critical to be able to recognize which parts of the system are being stressed (monitoring) and then knowing what parameters should be adjusted to reduce that stress (tuning).
TES 6.2 Hardware Requirements
Master Configuration

Note For each adapter instance use the following guidelines for RAM allocation:
1 GB of extra RAM for Small and Medium configurations
2GB of extra RAM for Large configuration
Master and Client Manager DB Configuration
Minimum size required by Master and Client Manager Databases:
As the number of jobs or logs increases, DBA should tune the DB accordingly
Transporter Configuration
Note All Memory, CPU, and Disk requirements are for TES related components only, and does not take into account any additional OS/application requirements.
Performance Matrix
The tables below help you link common catalysts that impact performance with the areas that need to be monitored/tuned to get better performance.
For example, in the table above, if you are experiencing performance problems with large schedules, the items you should tune or monitor would be the CPU, the memory, your JMS, and the Cache Write.
Monitoring with JConsole
JConsole is a diagnostic tool that comes with the standard JDK. It allows you to connect directly to a running JVM and monitor many performance metrics, including memory/CPU usage. JConsole can also be used to access diagnostic modules exposed by each individual application called MBeans. Both the Master and Client Manager expose MBeans.
Connecting JConsole
Before connecting JConsole to either the Client Manager or Master, make sure the following property is set in clientmgr.props or master.props.
If you are running JConsole on the same machine as the JVM you are connecting to, the JVM will be listed in JConsole.
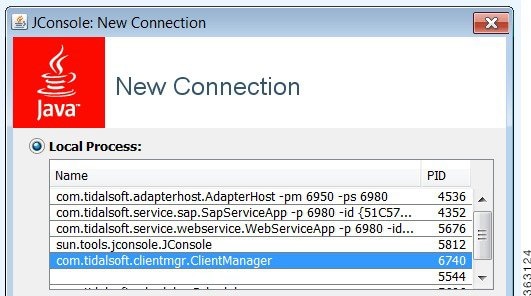
If you are connecting JConsole to a JVM running on a remote machine, type in the remote JVM's machine host name and port (the default CM port is 1100).
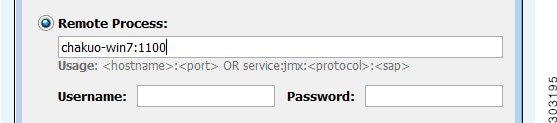
Note You can change the default port for the JVM by setting the following property in clientmgr.props or master.props.
JmxRmiPort=1200
Viewing a System Overview
The Overview tab of JConsole provides an overview of JVM's memory, threads, and CPU usage.
To view a system overview of the vital stats for the JVM, select the Overview tab of the console.
Figure 1-1 Viewing Vital Stats for JVM

Viewing Memory Usage
To view memory usage, select the Memory tab of the console.
The memory tab provides more detailed information about JVM's memory use, allowing you to determine if the JVM has sufficient memory for the application that is running.
Note For a normal running JVM, you should see memory use increase and decrease in the short term. However, if you see that memory use is increasing in the long term, it may indicate a memory that will eventually result in an out-of-memory termination.
Figure 1-2 Viewing Memory Usage

Viewing Active Threads
To view active threads and potential deadlocks, select the Threads tab of the console.
This screen provides stack traces for every thread in the JVM. A stack trace shows exactly what a thread is doing at the time of the trace. This screen allows you to automatically detect thread deadlocks.
Figure 1-3 Viewing active threads

Monitoring Scheduling Activity
Viewing MBeans
For viewing custom monitoring modules (MBeans), select the MBeans tab of the console.
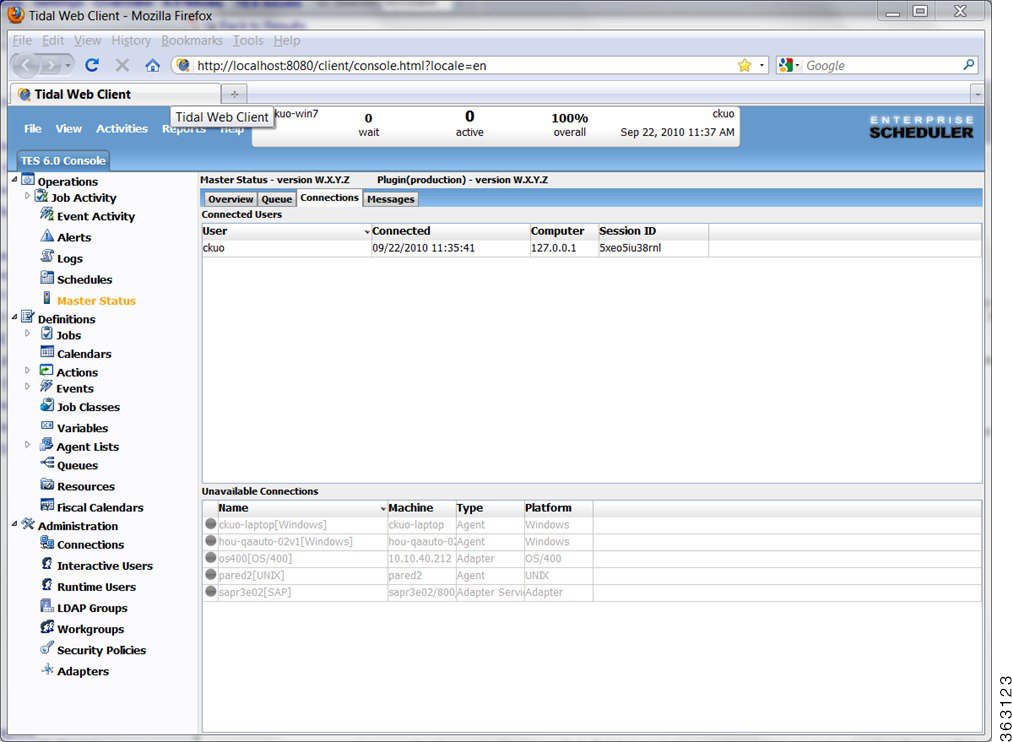
Viewing Connected Users
For viewing connected users, click the Connections tab on the Master Status pane.
Figure 1-6 Viewing connected users
Viewing Job Activity
For viewing current job activity, select Operations > Job Activity from the Navigation tree to view the Job Activity pane.
Figure 1-7 Viewing Job Activity

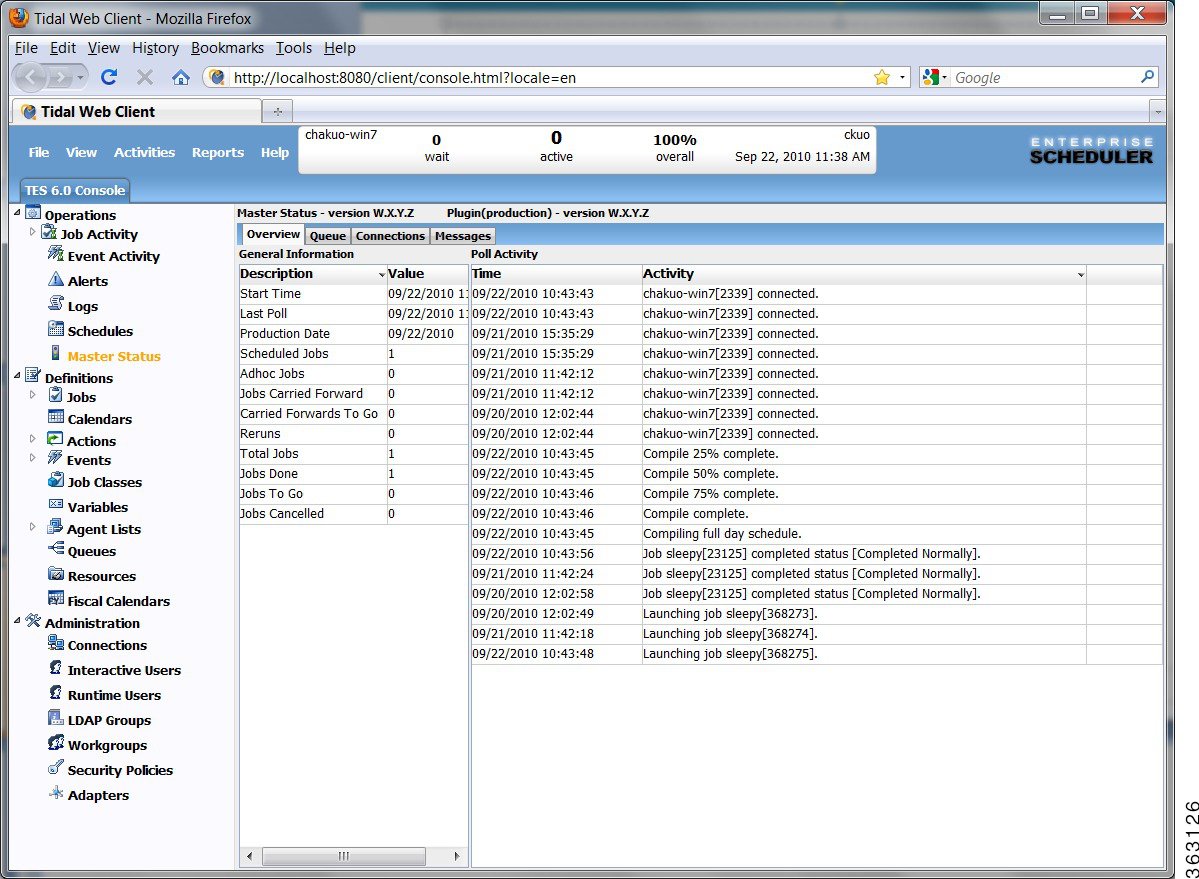
Viewing Master Status
For viewing an overview of the master status, select Operations > Master Status from the Navigation tree to view the Master Status pane, and then click Overview.
Figure 1-8 Viewing the Master Status
Viewing Queue Activity
For viewing queue activity, choose Operations > Master Status from the Navigation tree to view the Master Status pane, and then click Queue.
Figure 1-9 Viewing Queue Activity

Viewing Event Activity
To view event activity, choose Operations > Event Activity from the Navigation tree to view the Event Activity pane.
Figure 1-10 Viewing Event Activity

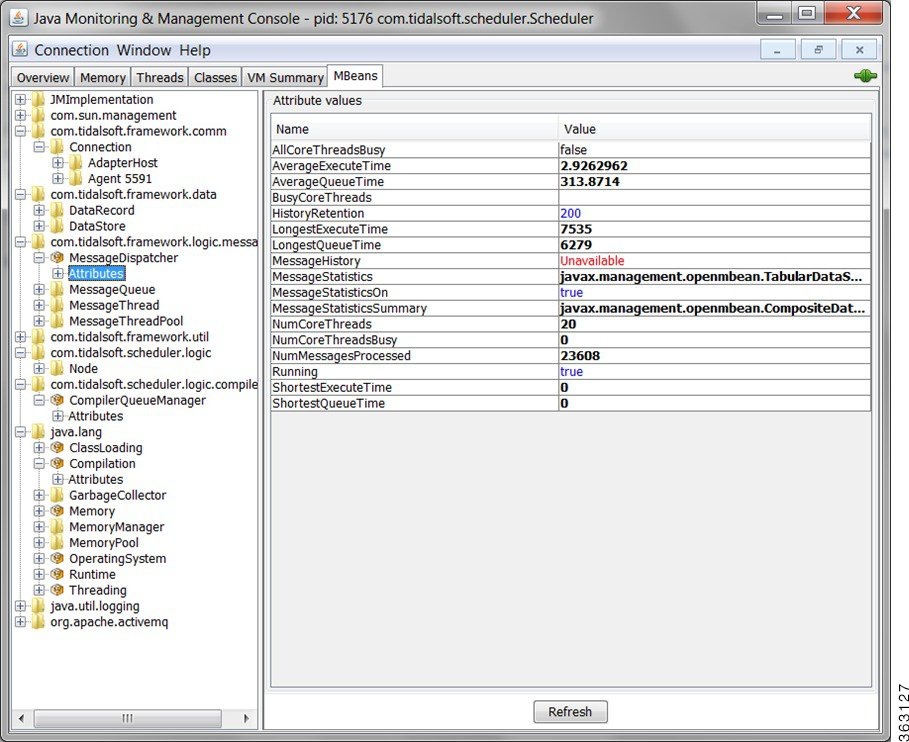
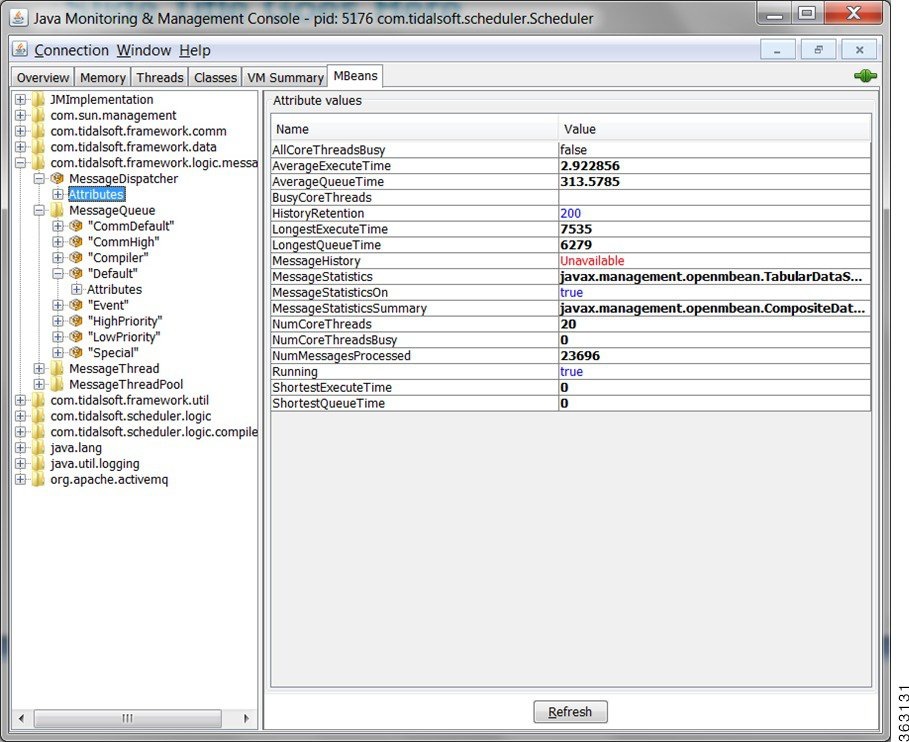
Monitoring the Overall Message System
For monitoring the overall message system, click the MBeans tab on the Java console, and then select Attributes from the tree to view the attribute values.
Figure 1-11 Monitoring the overall message system
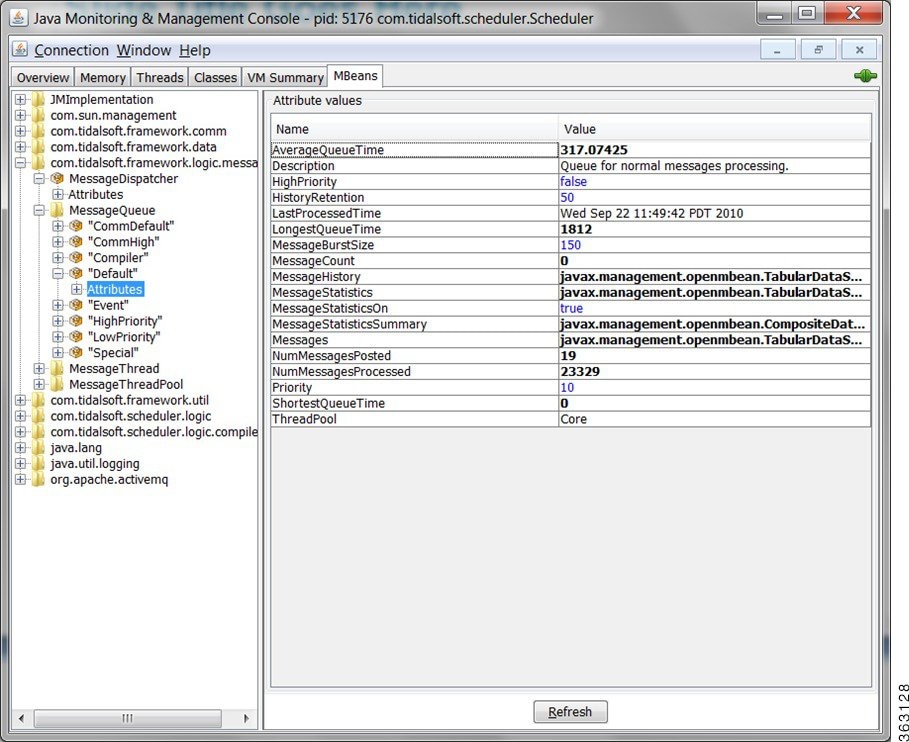
Monitoring a Message Queue
For monitoring a message queue, click the MBeans tab on the Java console, and then choose MessageQueue > Attributes from the tree to view the attribute values associated with the message queues.
Figure 1-12 Monitoring a message queue
Monitoring Schedule Compiling
Master Status-Compile Status
For monitoring the master compile status, choose Operations > Master Status from the Navigation tree to view the Master Status pane, and then click Overview. You can view the compile percentage in the Poll Activity pane as displayed below.
Figure 1-15 Viewing the Master compile status

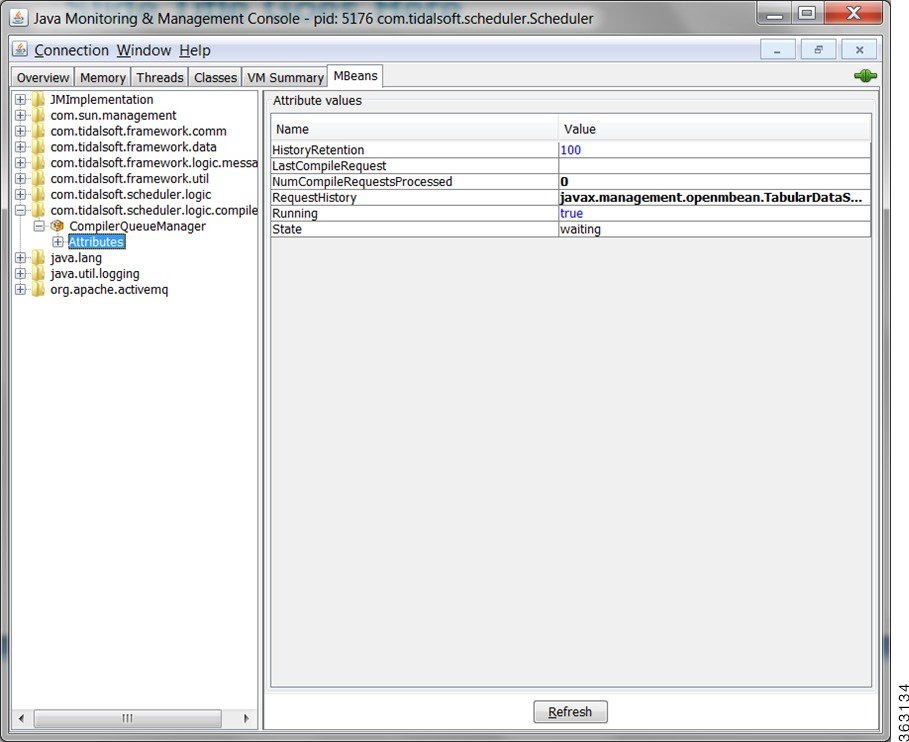
Monitoring the Queue Manager Compiler
For monitoring the queue manager compiler, select the MBeans tab on the Java console, and then select CompilerQueueManager > Attributes from the tree to view the attribute values associated with the queue manager compiler.
Figure 1-16 Monitoring the queue manager compiler
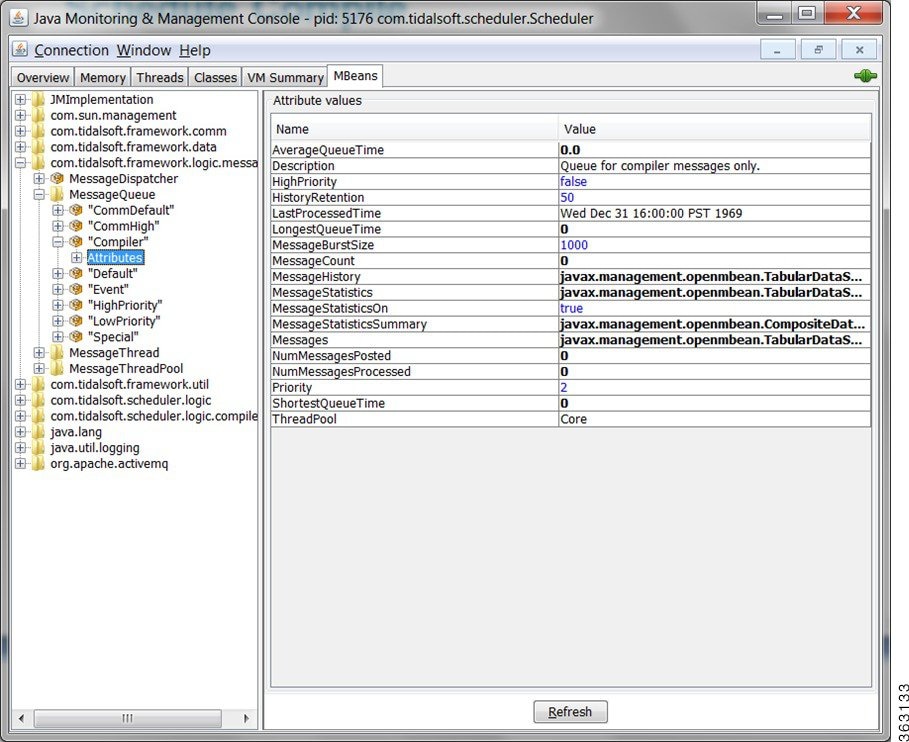
Monitoring the Message Queue Compiler
For monitoring the queue message compiler, select the MBeans tab on the Java console, and then choose MessageQueue > Attributes from the tree to view the attribute values associated with the queue message compiler.
Figure 1-17 Monitoring the message queue compiler
Monitoring Adapter/Agent Connections
Viewing All Connections and Statuses
To view all connections and their statuses, choose Administration > Connections from the Navigation tree to view the Connections pane.
Figure 1-18 Viewing All Connections and their statuses

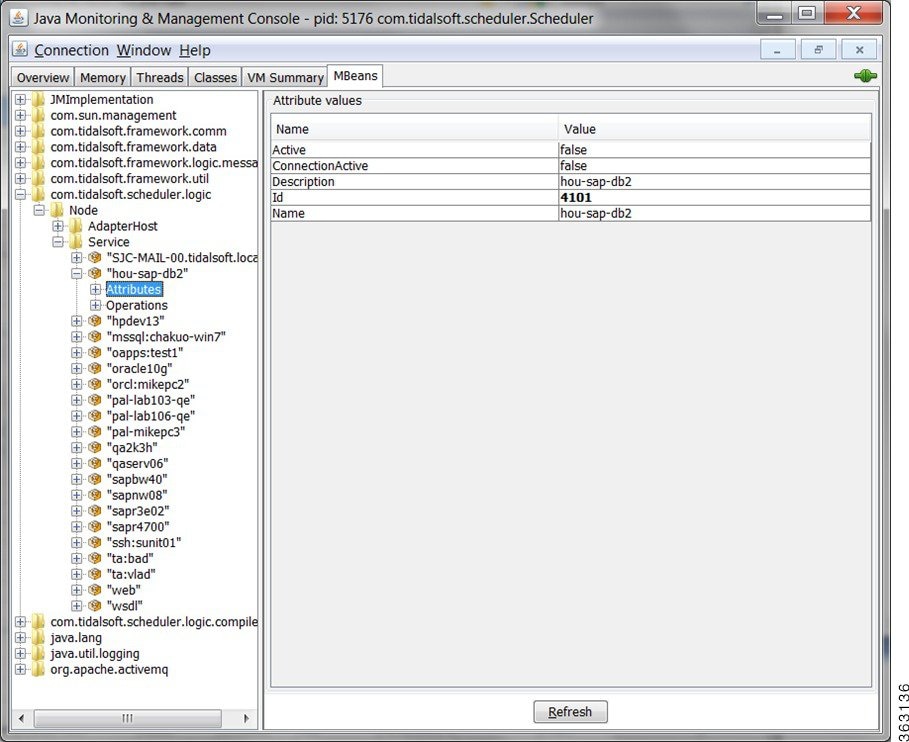
Monitoring Adapter Connections via JConsole
For monitoring the adapter connections, select the MBeans tab on the Java console, and then choose Node > Service > Attributes from the tree to view the attribute values associated with the adapter connection.
Figure 1-19 Viewing adapter connections via JConsole
Monitoring the Cache Sync
To monitor the Cache sync, open DSP.props and set the cache logging level to FINE as displayed below.
Figure 1-20 Monitoring the Cache sync

Configuration and Tuning
This section will walk you through how to tune the application (either Master or Client Manager) to get better performance.
Memory
These parameters tune the amount of memory the application has to use to get work done. If an application does not have enough memory to work with, it could have very poor performance or in the worst case get out of memory errors and fail.
CPU
The system CPU is not readily tunable from our application or the JVM itself, however, know that the CPU is an important resource that directly impacts performance. If a system does not have enough CPUs or CPU power, applications can run very slowly across the board. Upgrade your system to more CPUs or faster CPUs if the system monitor consistently shows the CPU meter very high.
JMS
Both the Master and Client Manager rely on the Java Message Service (JMS) for internal and cross communication with each other. You can think of JMS as the communication link between the Master and Client Manager. That is why JMS can greatly impact performance, especially if there is a lot of data moving back and forth between the Master and Client Manager., such as the primary and secondary cache synchronization.
JMS sessions process all messages such as during the use of one worker thread per session. The following threads are affected:
- MinSessionPoolSize – minimum number of ActiveMQ sessions kept pooled. Having sessions available to handle requests reduces the cost of allocating sessions on demand.
- MaxSessionPoolSize – maximum number of ActiveMQ sessions kept pooled.
Note If more sessions are needed to process messages, the system will still allocate them. This setting only limits the number of sessions allowed to be pooled.
- MaxConcurrentMessage – maximum number of ActiveMQ messages allowed to be processed concurrently. This setting is important for increasing throughput and utilizing all the cores on a system when there are many messages waiting in the ActiveMQ queues.
The following Message Brokers handle all JMS traffic:
- MessageBroker.MemoryLimit – how much memory (in MB) to allocate to ActiveMQ for storing in-flight messages. If queues become full, ActiveMQ will page messages to disk, which is more expensive than keeping them in memory.
- MessageBroker.TempLimit – how much memory (in MB) to allocate to ActiveMQ for storing temporary messages. If queues become full, ActiveMQ will page messages to disk, which is more expensive than keeping them in memory.
- MessageBroker.StoreLimit – how much disk space (in MB) to allocate to ActiveMQ for storing in-flight messages when memory is full.
The following master.props properties are what you would tune for DSP to Master message traffic for all DSP connections:
The following master.props properties are what you would tune for DSP to Master message traffic per DSP connections:
- ClientConnection.MinSessionPoolSize (2)
- ClientConnection.MaxSessionPoolSize (5)
- ClientConnection.MaxConcurrentMessages (5)
The following master.props properties are what you would tune for Remote Master to Master message traffic per Remote Master:
- RemoteMasterClient.MinSessionPoolSize (2)
- RemoteMasterClient.MaxSessionPoolSize (5)
- RemoteMasterClient.MaxConcurrentMessages (5)
The following master.props properties are what you would tune for Master to Remote Master message traffic per Remote Master:
- RemoteMasterServer.MinSessionPoolSize (2)
- RemoteMasterServer.MaxSessionPoolSize (5)
- RemoteMasterServer.MaxConcurrentMessages (5)
The following tes-6.0.dsp properties are what you would tune for Master to DSP message traffic:
- ClientNode.MinSessionPoolSize (5)
- ClientNode.MaxSessionPoolSize (10)
- ClientNode.MaxConcurrentMessages (10)
The following tes-6.2.dsp properties are what you would tune for Fault Monitor to DSP message traffic:
- FTNode.MinSessionPoolSize (2)
- FTNode.MaxSessionPoolSize (5)
- FTNode.MaxConcurrentMessages (5)The following tes-6.2.dsp properties are what you would tune for Cache Read connections shared among all threads:
- DataCache.ReadConnectionsMin (2) – minimum number of JDBC connections kept pooled to read from the data cache. Having connections always available to handle read requests reduces the cost of allocating connections on demand.
- DataCache.ReadConnectionsMax (4) – maximum number of JDBC connections allowed to be allocated concurrently to read from the data cache. If this number is exceeded, read requests will be queued and blocked. Recommend increasing to handle more concurrent users.
The following tes-6.2.dsp properties are what you would tune for Cache Write connections shared among all threads:
- DataCache.WriteConnectionsMin (4) – minimum number of JDBC connections kept pooled to write to the data cache. Having connections always available to handle write requests reduces the cost of allocating connections on demand.
- DataCache.WriteConnectionsMax (8) – maximum number of JDBC connections allowed to be allocated concurrently to write to the data cache. If this number is exceeded, write request will be queued and blocked. Recommend increasing to handle more data update activity between the Master and DSP.
The following tes-6.2.dsp properties are what you would tune for Cache Tuning tradeoff between performance and memory/disk usage:
- DataCache.PageCacheSize (50000) – number of pages (of size DataCache.PageSize) in memory allocated to the data cache. The in-memory data cache allows for the fastest possible read/write access. Thus, for very large data caches, it is recommended that the data cache be given as much memory as possible.
- DataCache.PageSize (4096) – size (in bytes) of each page in the data cache. The data cache stores records in page-size chunks. Larger pages may improve read/write access when the data cache needs to fetch records from disk, with the added cost of a larger data cache in-memory and on disk. Another factor to keep in mind is the OS disk block size. Usually, it is recommended to keep the data cache page size the same as the OS disk block size.
- DataCache.CacheSizeDefault (1000) – number of objects each table in the data cache is allowed to keep in memory. More objects equals faster read/write access from and to the data cache.
The following tes-6.2.dsp properties are what you would tune for Cache Syncing, which affects the data sync between the master database and Client Manager (DSP) cache.
- CacheSynchronizer.Purge (N) – Y to purge leftover deleted records during sync. Leftover records may exist in the cache if the Master deletes the records from its database when the Client Manager is not connected.
- CacheSynchronizer.NumThreads (4) – number of concurrent threads spawned to sync the cache. More threads increase throughput, but use more CPU and memory. Recommend to set at or below number of physical cores on machine.
- CacheSynchronizer.StreamCommitSize (1000) – number of records committed to the cache in a batch. Larger batches improve throughput, but use more memory.
The following master.props properties are what you would tune for the connections used to read/write to the master database:
Master Messaging
Master messaging impacts only the Master, but it has a big impact on the performance of the Master and thus indirectly the Client Manager as well. The Master is designed to be a heavily multi-threaded application. By tuning the messaging parameters, the Master is bettter able to utilize the threading capabilities of the system.
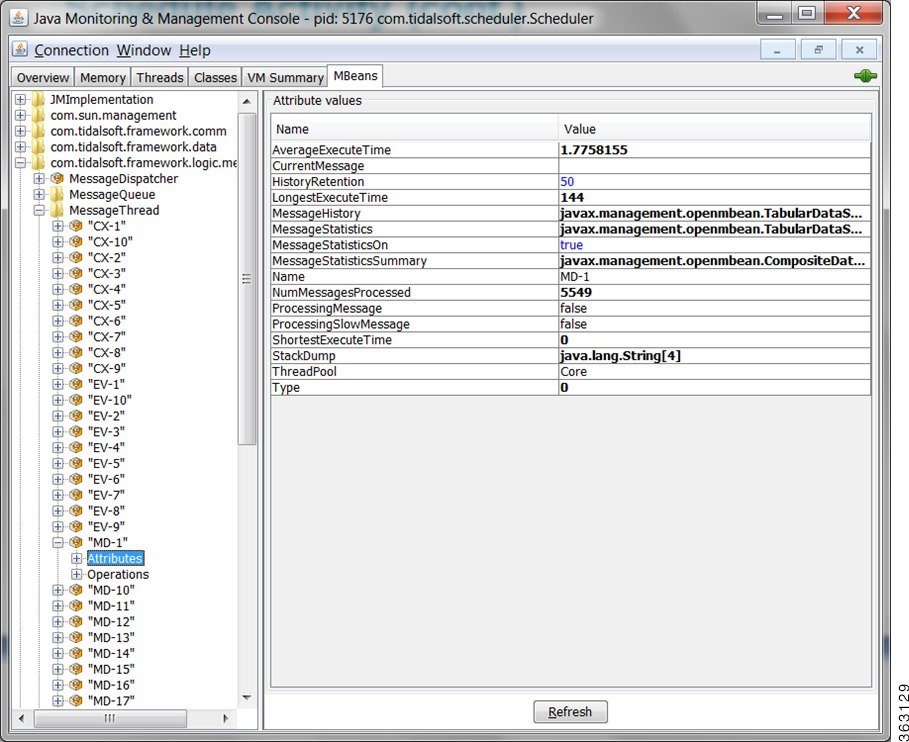
All work in the Master is performed by the following message threads:
Before a message is sent to an object, it is first posted to one of the application’s message queues. Each queue or set of queues is allocated for a specific type of message. For example, the default queues are for general messages, the compiler queue is for compile messages, and the communication queues are for communication messages. Each queue has a priority that determines how often its messages get processed. Higher priority queues have their messages processed more frequently than lower priority ones.
Message threads are the workhorse of the application. They are responsible for pulling messages out of queues and then executing them. Depending on the application configuration, there may be anywhere from a dozen to a hundred threads running inside the application. Generally speaking, more threads equal better performance, since each CPU can execute a thread at the same time as another CPU. So, technically, a dual core system can process twice as many messages as a single core system. However, in reality, because each thread eats up a bit of memory and CPU, performance is expected to degrade when there are too many threads for the system to handle.
A message thread pool groups together a set of messages threads with a set of message queues. The intent is to force threads from a pool to only process messages for queues from the same pool. This guarantees if threads in one pool are busy, messages in another pool will still get processed by free threads in that pool.
To configure the Master messaging:
- MessageThreads = general workhorse threads
- SpecialMessageThreads = adapter-related threads
- EventMessageThreads = event-related threads
- CommThreads = communication threads
Note As a best practice, retain no more than 20 M message log records for better performance.
Transporter Performance
Transporter Job Read Options
Configurations have been made available to provide improved performance for unfiltered job reads. Multiple options are available for flexibility. Configuring these options may require tuning based on the customer environment. For tuning purpose, it would best to run TP in debug mode with an open console so that you can view how the reads are performing.
To run TP in debug mode, include XPORTER_DEBUG=YES in the Transporter.props file and run the transporter.cmd script located in bin.
The REST call job.getList has been replaced with the following options:
Parameters Configured via Transporter.props
Only one of the following parameters should be set to true at a time:
The READ_BATCHES parameter applies to READJOBS_PAGINATED or READJOBS_BATCHES.
If none of these parameters is set, the default configuration for read is (READ_BATCHES=500, READJOBS_BATCHES=true)
The READ_BATCHES parameter is used when reading paginated or batched reads.
The READJOBS_PAGINATED parameter determines whether to read jobs in pages.
The READJOBS_BATCHES parameter determines whether to read jobs in batches.
The READJOBS_ALL parameter determines whether to read all, given the min and max job ID.
READJOBS_PAGINATED configures the client manager to return job data in pages, with the batches based on the READ_BATCHES value.
For example, READ_BATCHES=1000 and READJOBS_PAGINATED=true, tells the Client Manager to return job data in batches of 1000. This approach reduces the overhead on the Client Manager as data is sent in smaller batches. Increasing the READ_BATCHES value will reduce the number of requests sent to the Client Manager since the jobs are returned in larger batches.
Note This approach may have less benefit given many jobs (i.e. 50K or more). The batching is done at the Client Manager level.
READJOBS_BATCHES reads jobs based on a given range of job IDs, where the range is specified via READ_BATCHES.
For example, if you have 50,000 job records whose job IDs start at 1 and ends at 50000, and you have set READ_BATCHES=1000 and READJOBS_BATCHES=true, requests will be sent to the Client Manager to query job records in ranges, until no more records are returned, as follows.
If all the job IDs are sequential and start at 1, then each batch request will result in roughly 1000 records. However, if there are large gaps in the job IDs, due to mass job deletes for example, the request may return fewer results depending on where the job record ID falls in that range. While executing the read and running Transporter in the debug mode, if you find that very few or 0 records are returned given a READ_BATCHES configuration, then increasing this value will be necessary to reduce the number of requests that return 0 or few results.
Note This approach appears to be more beneficial when there are many job records (50K or more).
READJOBS_ALL reads all jobs based on the first and last job ID. The result is that all jobs will be read in a single request. This approach is different from the job.getList call in that while both return all jobs, this request adds a query condition to the request, which seems to produce better performance. However, because all records are returned in a single request, the Client Manager will need to process all the records to send to Transporter.
Note If there are many job records, the overhead on the Client Manager may be too high.
Size-Based Guidelines for Tuning Your Environments
Small, medium, and large configurations require parameters to be tuned differently. Set the parameters as indicated in this section.
Small Configuration
CacheSynchronizer.NumThreads=2
DataCache.ReadConnectionsMin=5
DataCache.ReadConnectionsMax=10
DataCache.WriteConnectionsMin=5
DataCache.WriteConnectionsMax=10
DataCache.ConnectionPoolMinSize=5
DataCache.ConnectionPoolMaxSize=10
DataCache.StatementCacheSize=750
ClientNode.MinSessionPoolSize=5
ClientNode.MaxSessionPoolSize=10
ClientNode.MaxConcurrentMessages=10
JVMARGS=-Xms2048m –Xmx8192m -XX:PermSize=1024m -XX:MaxPermSize=1024m
ClientSession.MinSessionPoolSize=5
ClientSession.MaxSessionPoolSize=10
ClientSession.MaxConcurrentMessages=10
DataSource.MinSessionPoolSize=5
DataSource.MaxSessionPoolSize=10
DataSource.MaxConcurrentMessages=10
MessageBroker.MemoryLimit=2048
MessageBroker.StoreLimit=32768
ClientConnection.MinSessionPoolSize=10
ClientConnection.MaxSessionPoolSize=50
Medium Configuration
CacheSynchronizer.NumThreads=4
DataCache.ReadConnectionsMin=10
DataCache.ReadConnectionsMax=20
DataCache.WriteConnectionsMin=10
DataCache.WriteConnectionsMax=20
DataCache.PageCacheSize=131072
DataCache.ConnectionPoolMinSize=10
DataCache.ConnectionPoolMaxSize=20
DataCache.StatementCacheSize=1500
ClientNode.MinSessionPoolSize=10
ClientNode.MaxSessionPoolSize=20
ClientNode.MaxConcurrentMessages=10
JVMARGS=-Xms4096m –Xmx20480m -XX:PermSize=2048m -XX:MaxPermSize=2048m
ClientSession.MinSessionPoolSize=10
ClientSession.MaxSessionPoolSize=20
ClientSession.MaxConcurrentMessages=10
DataSource.MinSessionPoolSize=10
DataSource.MaxSessionPoolSize=20
DataSource.MaxConcurrentMessages=10
MessageBroker.StoreLimit=65536
ClientConnection.MinSessionPoolSize=10
ClientConnection.MaxSessionPoolSize=100
ClientConnection.MaxConcurrentMessages=1
Large Configuration
CacheSynchronizer.NumThreads=8
DataCache.ReadConnectionsMin=50
DataCache.ReadConnectionsMax=100
DataCache.WriteConnectionsMin=50
DataCache.WriteConnectionsMax=100
DataCache.PageCacheSize=1048576
DataCache.ConnectionPoolMinSize=20
DataCache.ConnectionPoolMaxSize=40
DataCache.StatementCacheSize=7500
ClientNode.MinSessionPoolSize=50
ClientNode.MaxSessionPoolSize=100
ClientNode.MaxConcurrentMessages=10
JVMARGS=-Xms6144m -Xmx24576m -XX:PermSize=3072m -XX:MaxPermSize=3072m
ClientSession.MinSessionPoolSize=50
ClientSession.MaxSessionPoolSize=100
ClientSession.MaxConcurrentMessages=10
DataSource.MinSessionPoolSize=50
DataSource.MaxSessionPoolSize=100
DataSource.MaxConcurrentMessages=10
MessageBroker.MemoryLimit=1024
MessageBroker.StoreLimit=65536
ClientConnection.MinSessionPoolSize=10
ClientConnection.MaxSessionPoolSize=100
ClientConnection.MaxConcurrentMessages=1


 Feedback