
First Published: 2024-02-23
Americas Headquarters
Cisco Systems, Inc.
170 West Tasman Drive
San Jose, CA 95134-1706
USA
http://www.cisco.com
Tel: 408 526-4000
800 553-NETS (6387)
Fax: 408 527-0883
New and Changed Information
The following table provides an overview of the significant changes up to the current release. The table does not provide an exhaustive list of all changes or of the new features up to this release.
| Feature | Description | Release | Where Documented |
|---|---|---|---|
|
Panduit PDU integration |
Panduit PDU Integration in Nexus Dashboard Insights enables you to monitor energy usage and unlock sustainability insights for sites and individual devices connected to a Panduit PDU. |
6.4.1 |
This document is available from your Nexus Dashboard Insights GUI as well as online at www.cisco.com. For the latest version of this document, visit Cisco Nexus Dashboard Insights Documentation.
Integrations
About Integrations
Navigate to Admin > Integrations.
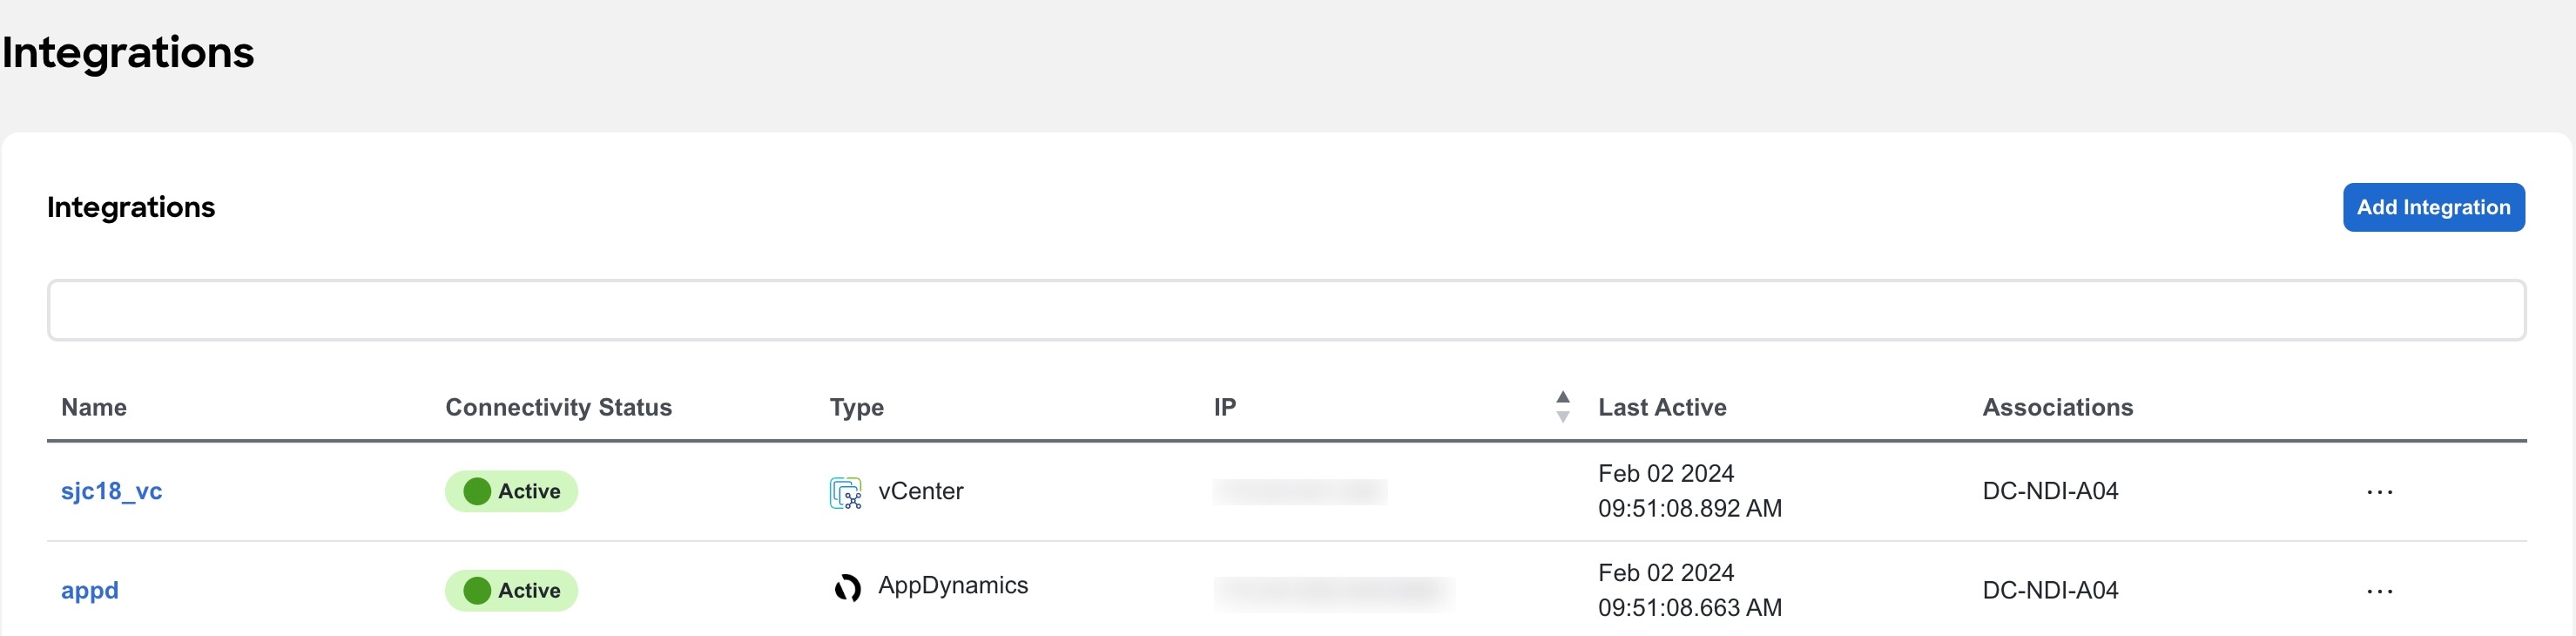
All the integrations are listed in a tabular form with the following fields:
-
Name
-
Connectivity Status
-
Type
-
IP
-
Last Active
-
Associations
The connected status indicates that the controller is active to fetch data. The down status indicates that the Nexus Dashboard Insights will not fetch data from the controller. Use the filter bar to search for a specific integration. You can filter based on the name and type of integration.
-
Click Add Integration to add a new integration.
-
Click the ellipse icon to perform to edit or delete an integration.
-
Click the integration names to view further details about the integration. .

DNS Integration is not clickable and do not have any further information to display apart from the data available in the table.
Guidelines and Limitations
-
In Nexus Dashboard Insights, Integrations are supported on both Management and Data networks.
-
By default, Nexus Dashboard Insights will use Data network to connect to the Integrations such as vCenter server, DNS, AppDynamics, Nexus Dashboard Orchestrator. If you want to use Management network, you can add a specific route in Nexus Dashboard from Admin > System Settings > General > Routes. The route can be a /32 pointing to Integrations or a larger subnet that includes it.
AppDynamics Integration
About AppDynamics Integration
Cisco Nexus Dashboard Insights provides insights to monitor the most common and complex challenges in the maintenance of infrastructure operations, which involves monitoring, troubleshooting, identification and resolving the network issues.
AppDynamics provides application performance management (APM) and IT operations analytics that helps manage the performance and availability of applications in the data center. It also provides the required metrics for monitoring, identifying, and analyzing the applications that are instrumented with AppDynamics agents.
AppDynamics hierarchy consists of the following components:
-
Network Link—Provides the functional means to transfer data between network entities.
-
Node—A working entity of an application and is a process running on a virtual machine.
-
Tier—Grouping of nodes into a logical entity. Each tier can have one or more nodes.
-
Application—A set of tiers make up an application.
-
Controller—A controller consists of a set of accounts with each account comprising a list of applications. Each account in the controller is an instance.
Integrating AppDynamics allows Nexus Dashboard Insights to collect operational data and metrics of the applications monitored by AppDynamics, and then correlate the collected information with the data collected from the site nodes.
In a scenario where an application communicates through the site, AppDynamics provides various metrics about the application and the network, which can be used to isolate the cause of the anomaly. The anomaly can be in the application or the underlying network. This in turn allows network operators to monitor the network activity and detect anomalies.
The AppDynamics agents are plug-ins or extensions, hosted on the application. They monitor the health and performance of the network nodes and tiers with minimal overhead, which in turn report to the AppDynamics controller. The controller receives real-time metrics from thousands of agents and helps troubleshoot and analyze the flows.
Nexus Dashboard Insights connects to the AppDynamics controller and pulls the data periodically. This data from AppDynamics controller, rich in application specific information is fed to Nexus Dashboard Insights, thereby providing Cisco Nexus Dashboard Insights for the traffic flowing through the site nodes.
From AppDynamics, you can create your own health rule on the available metrics, which contributes to the overall anomaly score of the entity.
The integration of Nexus Dashboard Insights with AppDynamics enables the following:
-
Monitoring and presenting AppDynamics hierarchy in Nexus Dashboard Insights.
-
Gathering and importing network related metrics into Nexus Dashboard Insights.
-
Presenting statistics analytics, flow analytics, and topology view on the data collected from AppDynamics controller.
-
Detecting anomaly trends on metrics collected from AppDynamics controller and raising anomalies on detection of such events.
-
The AppDynamics integration uses API server and multiple instances of Telegraph data collecting container to support load balancing of the onboarded controllers.
-
Fabric flow impact calculation for AppDynamics anomalies.
Onboarding for SaaS or Cloud Deployments
Starting from Nexus Dashboard Insights release 6.0.2, you can connect to AppDynamics controller using a proxy for SaaS or cloud deployments. For onboarding an AppDynamics Controller running on cloud, Nexus Dashboard Insights uses proxy configured on Cisco Nexus Dashboard to connect to AppDynamics Controller.
Guidelines and Limitations
-
After Nexus Dashboard Insights upgrade, AppDynamics takes about 5 minutes to report the information in AppDynamics GUI.
-
The health and count of AppDynamics business transactions displayed in the application details do not match the flow count in Nexus Dashboard Insights.
-
Nexus Dashboard Insights does not support fabric topologies as transit-leaf does not have the VRF deployed and flow table in transit-leaf will not export the flow record to Nexus Dashboard Insights. Hence Nexus Dashboard Insights will not stitch the path fully and will not display complete path summary with all the information.
-
To connect an HTTPS AppDynamics controller using an HTTP proxy you must configure HTTPS proxy in Nexus Dashboard with the HTTP proxy server URL address.
-
To connect an HTTP AppDynamics controller using an HTTP proxy you must configure HTTP proxy in Nexus Dashboard with the HTTP proxy server URL address.
-
Scale limits for AppDynamics integration:
-
Number of apps: 5
-
Number of tiers: 50
-
Number of nodes: 250
-
Number of net links: 300
-
Number of flow group: 1000
-
Installing AppDynamics
Before you begin using Nexus Dashboard Insights Integrations, you must install AppDynamics Application Performance Management and Controller. See Getting Started for details.
Onboard AppDynamics Controller
For Cisco Nexus Dashboard Insights and AppDynamics integration, the Cisco Nexus Dashboard’s data network must provide IP reachability to the AppDynamics controller. See the Cisco Nexus Dashboard Deployment Guide.
Before you begin
-
You must have installed AppDynamics application and controller.
-
You must have administrator credentials for Nexus Dashboard Insights.
-
You must have user credentials for AppDynamics controller.
-
You must have configured proxy on Nexus Dashboard to connect to AppDynamics controller using a proxy. See section Cluster Configuration in the Cisco Nexus Dashboard User Guide
Procedure
-
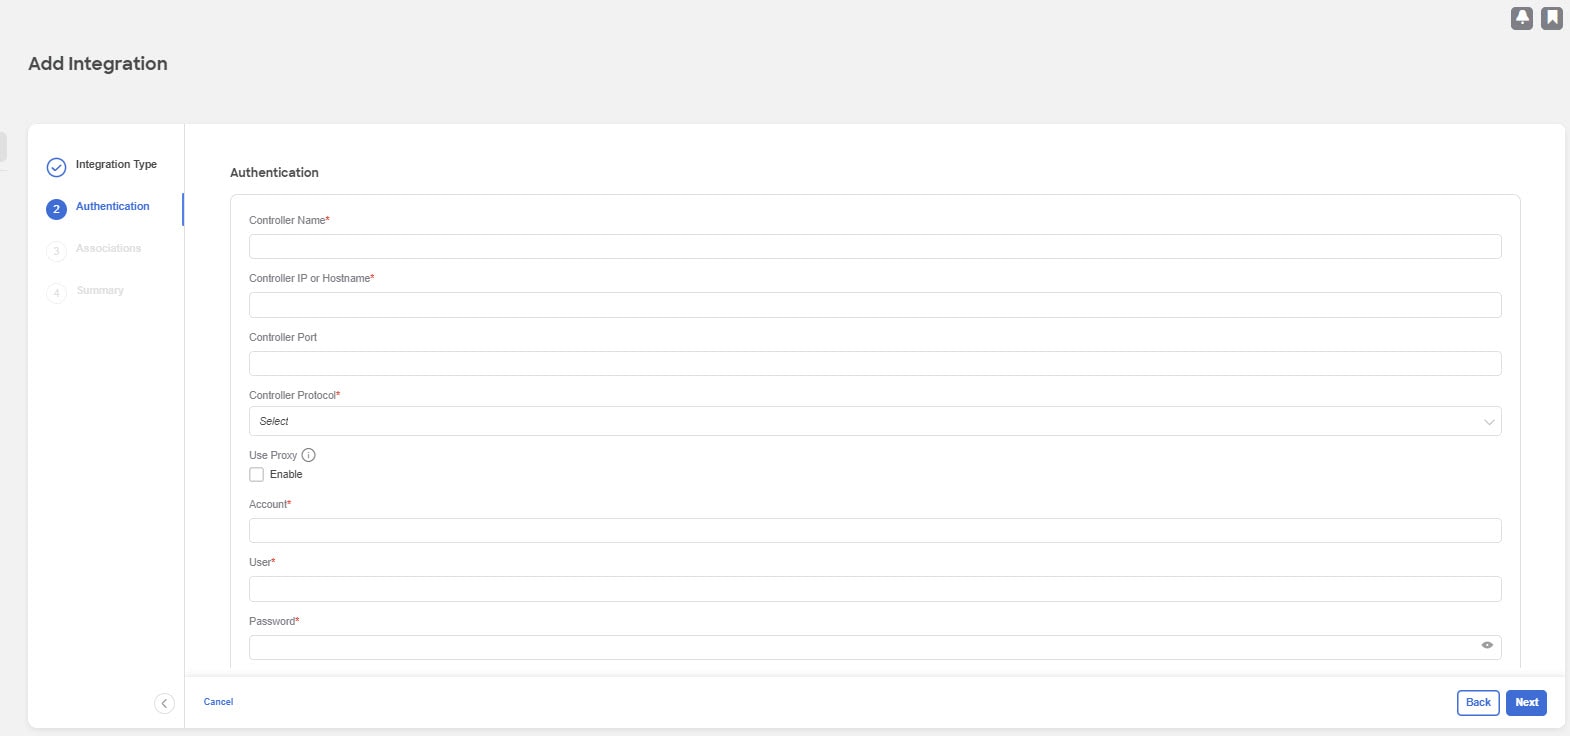
Click Admin > Integrations > Add Integration.
-
Select App Dynamics for Integration Type.
-
AUTHENTICATION
-
Enter Controller Name, Controller IP or Hostname, Controller Protocol and Controller Port. Controller Name can be alphanumeric and spaces are not allowed.
AppDynamics Controller Name cannot be the same name as Nexus Dashboard site name.
-
Check the Enable checkbox to connect to AppDynamics controller using a proxy. The proxy must be configured on Nexus Dashboard.
-
Enter AppDynamics Account Name, User Name, and Password.
-
-
ASSOCIATIONS
-
Select a site or multiple sites. You can view the number of anomalies for each severity level, SW Analytics, Flow Collection, and the Anomaly Trend for each site before selecting it.
-
Click Select.
-
-
The Summary displays an overview of the Integration created.
-
Click Submit to add the integration. The post completion success screen allows you to Add Another Integration or View Integrations.
When the Status is Connected, the onboarding for the controller is complete.
Cisco Nexus Dashboard Insights and AppDynamics Integration Dashboard
The AppDynamics Dashboard allows you to onboard controllers and presents a view of the Top Applications by Anomaly Score along with various metrics. Once a controller is onboarded, data related to applications monitored by that controller is pulled by Nexus Dashboard Insights. It can take up to 5 minutes for the first set of data to appear on the GUI. The AppDynamics health state information provided for each entity is aggregated and reported by Nexus Dashboard Insights on the dashboard.
The AppDynamics dashboard displays the overview of the applications monitored by the AppDynamics controller.
-
Controller Connectivity — Represents the number of integrations that are Up or Down.
-
Anomalies by Severity — Nexus Dashboard Insights runs statistical analytics on the metrics received from the AppDynamics controller. Click the number on Anomalies by Severity for Anomalies.
-
Top Applications by Anomaly Score displays top six out of all the applications based on the anomaly score.
-
Application widget displays the top application by anomaly score. This includes the anomaly score of the application as computed in Nexus Dashboard Insights, health state of tiers and nodes as reported by AppDynamics. Click the widget for additional details about the monitored application.
AppDynamics Integration Application
Detailed information including operational, statistics, and metrics, for each tier or application is also presented.
-
Summary lists the anomaly score, controller name, account, application name, number of tiers, number of nodes, throughput, TCP loss, and errors.
-
*Anomaly in the summary to display additional details.
-
Analyze Anomaly details displays estimated impact application, recommendations, mutual occurrences, and other details affected by the anomaly.
-
View Report displays the flow groups affected where each flow group can correspond to multiple fabric flows. View reports also display the proxy/entity IP address, node source, and node destination IP address.
-
Number of Tiers lists the available tiers. Click each tier from the list to display health score, number of nodes, and usage statistics.
-
Number of Nodes lists the available nodes. Click each node from the list to display statistics about the node.
-
Application Name displays additional details such as general information of the application, controller name, controller IP, account name, health of the tier, health of the node, business transaction health, and usage analytics.
-
 icon on the right top corner is to open AppDynamics Application details. This page displays application statistics details such as anomaly score, application tiers summary, application nodes summary, network charts for the node communication, and summary table of anomalies.
 -
Application Network Links table shows how the different components of AppDynamics application network flow map are communicating among each other. Detailed information about a network link, including flow counts and anomalies are used for further analysis.
-
AppDynamics Application View - Double-click each row in the summary for the particular AppDynamics monitored application.
AppDynamics Application View
AppDynamics Application View presents an overview of the application health state including tier health, node health, and business transaction health.
-
Application Statistics displays the graphical representation of the flow properties and a timeline graph representing the properties.
-
Tiers displays the health state of the tiers in the application. Click each row in the tier section for the side panel to display additional tier usage details.
-
Nodes displays the health state of the nodes in the application. Click each row in the node section for the side panel to display additional node usage details.
-
Application Network Links displays the link summary for the nodes.
-
Network Connection displays additional flow connection details.
-
Browse Network Flows to navigate to Browse Flow Records with the flow properties set in the filter.
-
Anomalies summarizes the anomalies with severity and other essential details of the anomaly. Click each row in the Anomalies section for the side pane to pop up with additional details of the anomaly.
-
Analyze for in-depth analysis, mutual occurrences, estimated impact, lifespan, and recommendations on the anomaly.
Topology View
The topology view represents the stitching between nodes where these nodes are connected to the site.
The topology view include application nodes and leaf nodes. Toggle between show or not show to view/hide the nodes with anomaly score. The anomaly score is represented by the dot in the topology.
The topology view represents a hierarchical view of Application > Node > Leaf and the links between them with a logical or network view of how various objects are related.
AppDynamics Anomalies
From AppDynamics application, you can create your own health rule on the available metrics, which contributes to the overall anomaly score of the entity. If the health rules are violated and a violation is generated by the AppDynamics controller, then Nexus Dashboard Insights pulls these health violations and generates anomalies on these violations.
The anomalies in the summary table include the following:
-
Anomalies raised on the metrics from the AppDynamics controller.
-
Health violation on the network metrics that the AppDynamics controller raised.
-
Anomalies at the application level and node level.
If there is an anomaly on the interface of application(s) impacted by the interface, then an anomaly is identified and shown.
Depending on the anomaly score and the level at which the anomaly occurs, the corresponding flows impacted are identified. Information related to the flow metrics with the leaf nodes information enable statistics analytics, pin point the source of the anomaly, whether it is the application or network, and the impacted entities.
The fabric flow impact calculation for AppDynamics anomalies calls flow APIs to fetch the fabric flows corresponding to the AppDynamics flow groups that were affected by the anomaly. Nexus Dashboard Insights displays the top 100 fabric flows ordered by the anomaly score for AppDynamics anomalies.
vCenter Integration
About VMware vCenter Server Integration
Integrating VMware vCenter server allows Nexus Dashboard Insights to collect data and metrics of the virtual machines and hosts monitored by VMware vCenter, and then correlate the collected information with the data collected from the Cisco ACI or Cisco NDFC fabric.
Data collected from vCenter includes
-
Virtual machine data
-
Network data
-
Virtual machine NIC data
-
Host data
-
Datastore data
-
Standard switch information
-
DVS information
-
vCenter Alarms
Nexus Dashboard Insights collects data from vCenter every 15 minutes. A system anomaly is raised if Nexus Dashboard Insights is unable to reach vCenter.
vCenter Anomalies
In Nexus Dashboard Insights, the alarms from vCenter are displayed as anomalies. The following types for anomalies are generated for vCenter Integration in the category vCenter.
-
Host, VM, and Datastore alarms from vCenter
-
Baseline anomalies for checks such as CPU, memory, storage
-
Threshold anomalies
Prerequisites
-
You have installed VMware vCenter 6.5 and later.
-
You have read-only privileges for VMware vCenter.
Guidelines and Limitations
-
Number of VMs supported for VMware vCenter integration is 1000.
-
Number of vNIC hosts supported for VMware vCenter integration is 10,000.
-
In Nexus Dashboard Insights release 6.3.1.44 and later multiple vCenters per site are supported.
Add vCenter Server Integration
-
Click Admin > Integrations > Add Integration.
-
Select vCenter Server for the Integration Type.
-
AUTHENTICATION
-
Enter Controller Name, Controller IP or Hostname, and Controller Port. Controller Name can be alphanumeric and spaces are not allowed.
-
Enter vCenter Username and Password.
-
-
ASSOCIATIONS
-
Select a site. You can view the number of anomalies for each severity level, SW Analytics, Flow Collection, and the Anomaly Trend for each site before selecting it.
-
Click Select.
-
-
The Summary displays an overview of the Integration created.
-
Click Submit to add the integration. The post completion success screen allows you to Add Another Integration or View.
vCenter Virtual Machine Dashboard
Select Virtual Machines. Select the timeline.
The dashboard presents the Top Virtual Machines by CPU plotted on a timeline. From the drop-down list, select CPU, memory, storage, or network usage to view the graphical representation of the top virtual machines based on drop-down list selection.
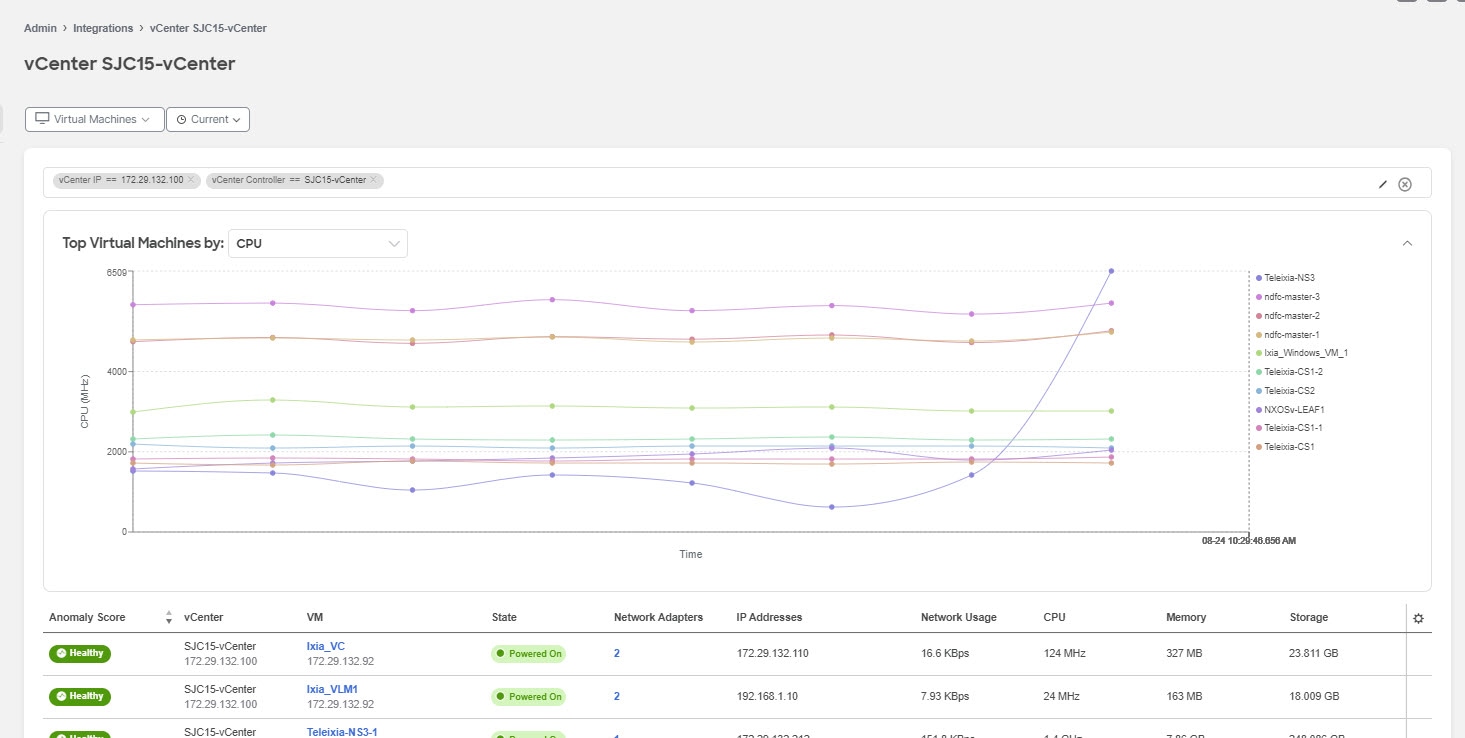
Use the filter bar to filter by vCenter IP, vCenter Controller, VM, Host, State, Status, Guest OS, DNS Name, Datacenter, Network Adapters, Network Usage, CPU, Memory, and Storage.
The Virtual Machines table displays the following information:
-
Anomaly Score
-
vCenter IP address
-
Virtual machine IP address
-
State
-
Network Adapters
-
IP address
-
Network Usage
-
CPU
-
Memory
-
Storage
The Gear icon can be used to customize the columns to be displayed in the table.
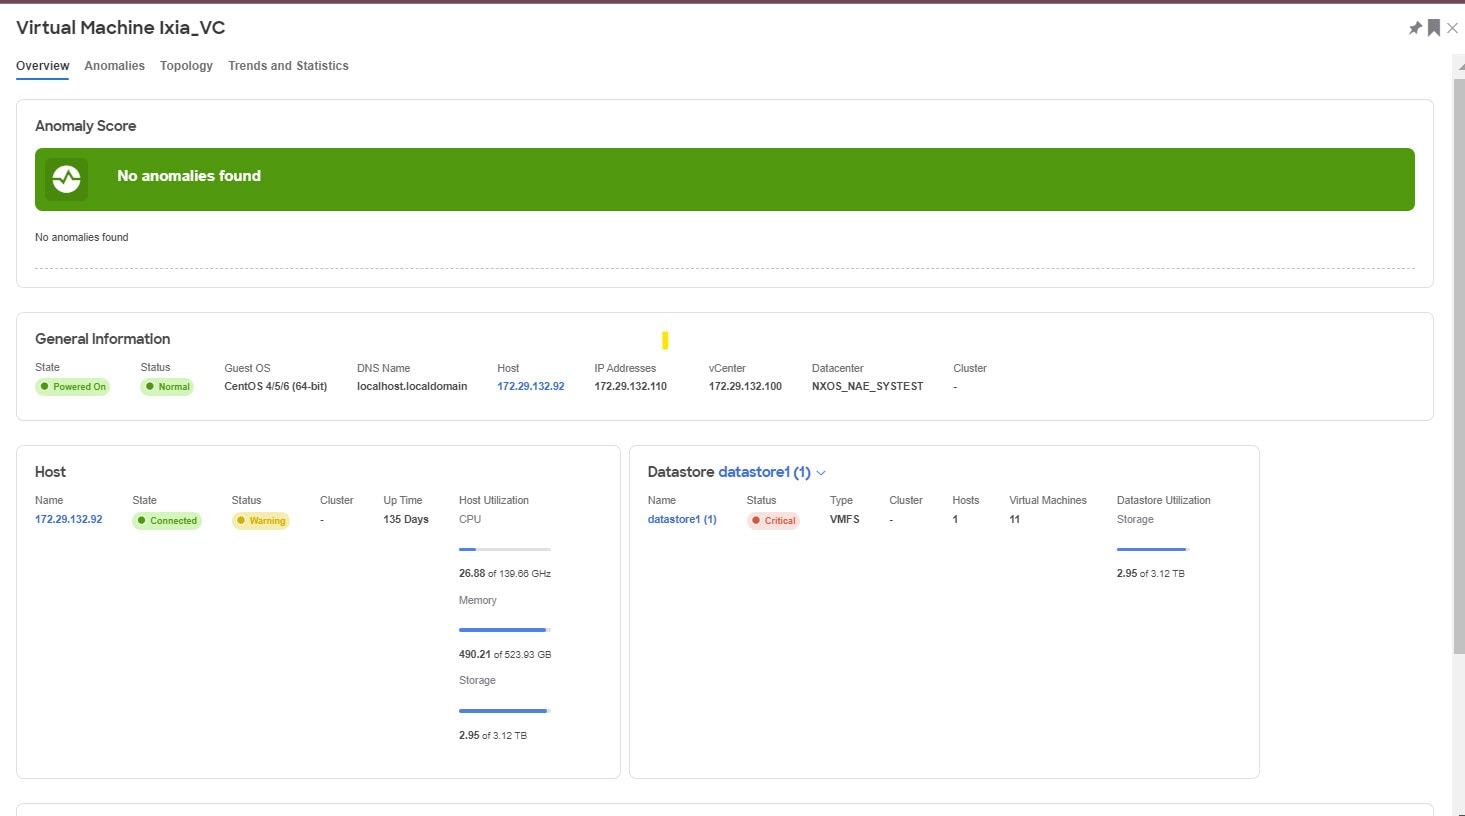
Select any entry in the table to display the additional details:
-
Anomaly score categorized by Critical, Major, Minor and Warning.
-
General Information like State, Status, Guest OS, DNS Name, Host, IP Addresses, VCenter, Datacenter, and Network Adapters.
-
Usage graphs for CPU, Memory, Storage and Network.
-
Storage which displays the number of Datastores.
Virtual Machine Details
Virtual machine details can be navigated to in two ways:
Click any VM name in the table to view details
OR
Click the icon (Expand Icon) after clicking any row in the table to view details
The details mentioned below consist of all the data available in both the views of Virtual Machine Details.
Overview
The overview section displays the following information:
-
Host IP address to view details for the selected host.
See vCenter Hosts Dashboard for more information.
-
The "+" under IP addresses to view all the addresses for the virtual machine.
-
The usage graph can be viewed as separate graphs for each type of virtual machine or as a cumulative graph of all virtual machines.
Datastore
Click the datastore name to view the Status, Type, Cluster, Hosts, Virtual Machines and the Usage graph for the datastore selected.
Network Adapters
They can be filtered based on the Adapter MAC, Port Group, Type, Virtual Switch, Adapter State, and Physical Adapters.
Adapter State
The adapter state shows details for network adapters.
Port Group
Click any port group to view the Type, Virtual Switch, VLAN, Hosts, and Virtual Machines. Select any of the port groups to view more details.
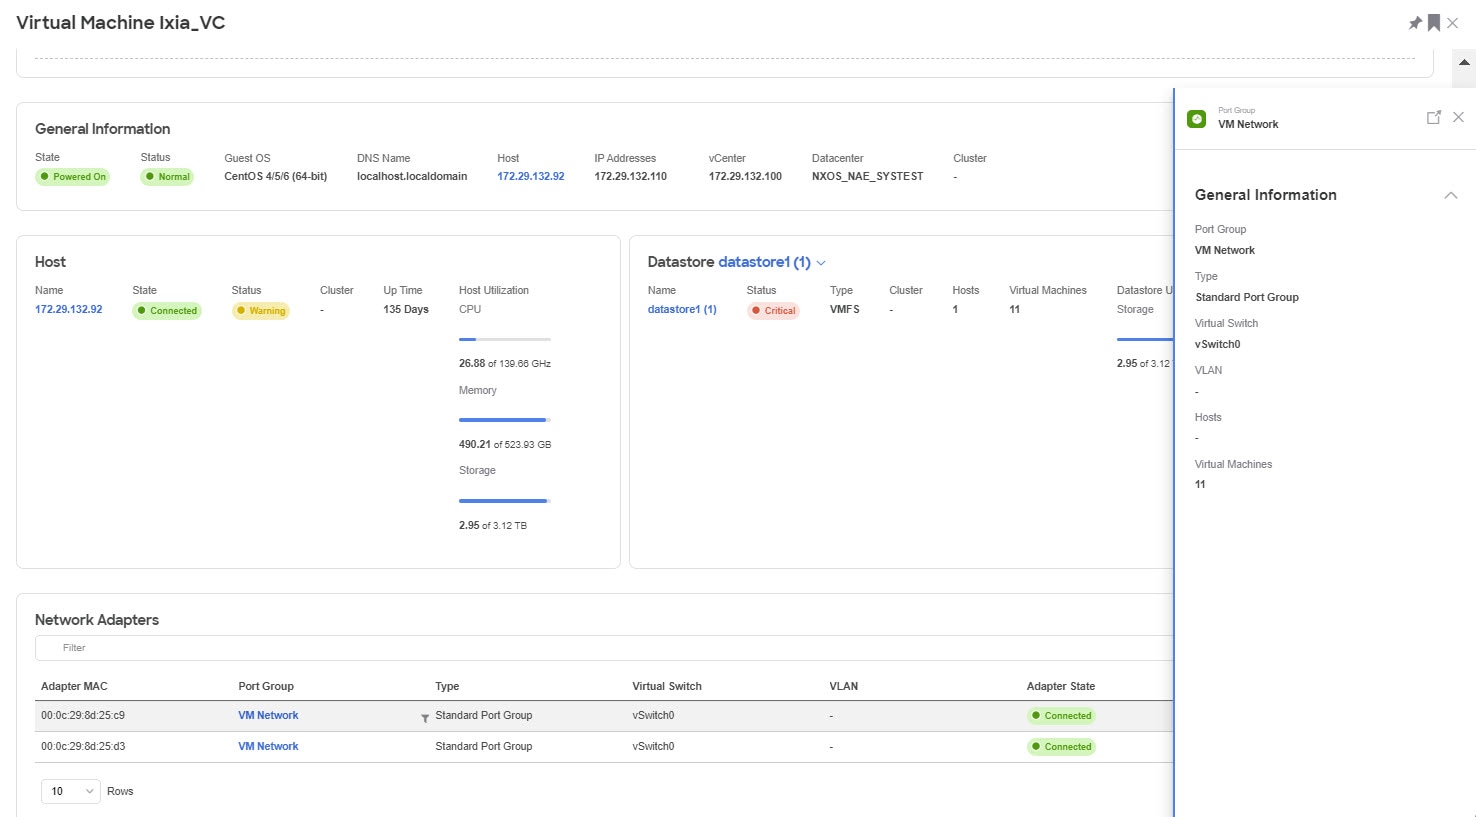
The information available for the port group listed is the same as the information available from Overview.
Alerts
Alerts displays the alarms from vCenter. In Nexus Dashboard Insights, the alarms from vCenter are displayed as anomalies. From the Actions drop-down menu, select an action to configure properties on an anomaly. The alerts can be filtered based on the following:
-
Acknowledgement
-
Anomaly ID
-
Assignee
-
Category
-
Check Code
-
Comment
-
Description
-
Detection Time
-
Entity Name
-
Last Seen Time
-
Nodes
-
Severity
-
Status
-
Sub-category
-
Tags
-
Title
-
Verification Status
-
IP Address
-
MAC Address
-
Interface
-
VPC
-
EPG
-
VRF
-
BG
Topology
Topology represents a hierarchical view of virtual machine > host > leaf switch in the fabric and the links between them with a logical or network view of how various objects are related.
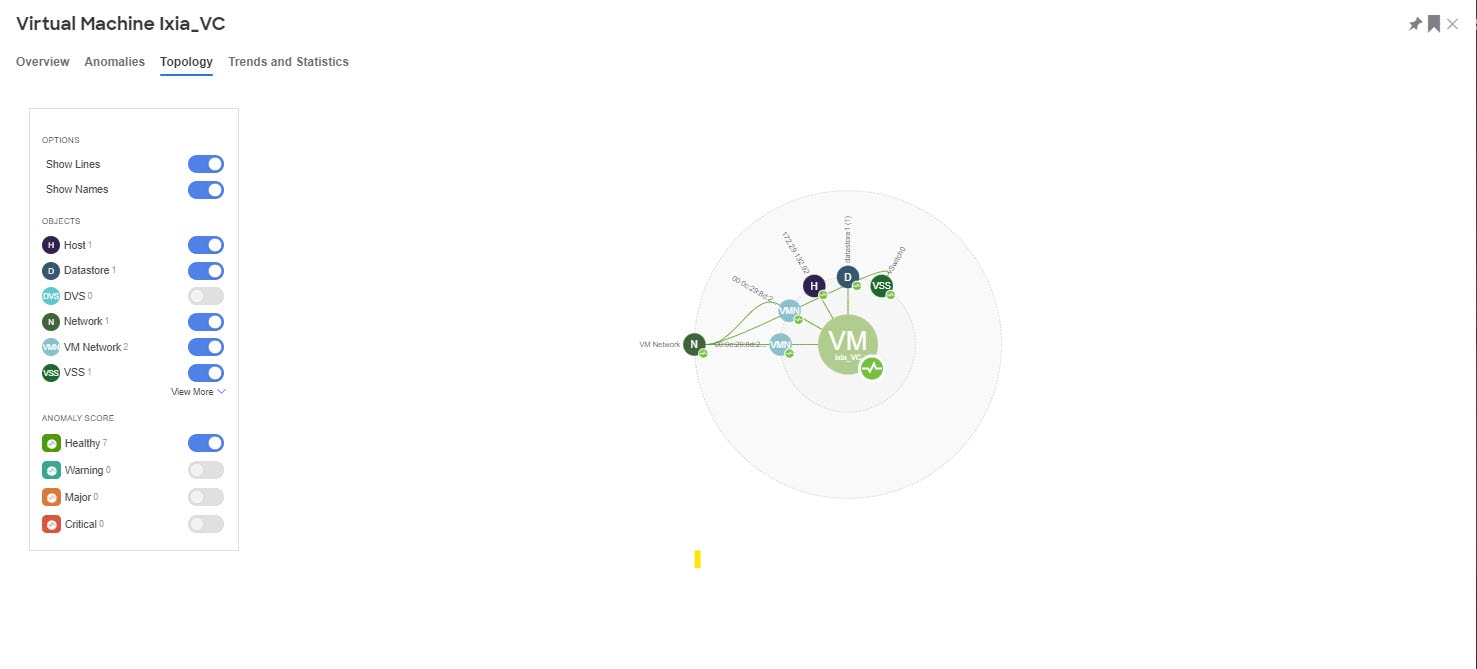
Topology can be filtered for the following different objects:
-
Host
-
Datastore
-
DVS
-
Network
-
VM Network
-
VSS
-
Leaf
-
Application
Click any of the nodes to view more information about it.
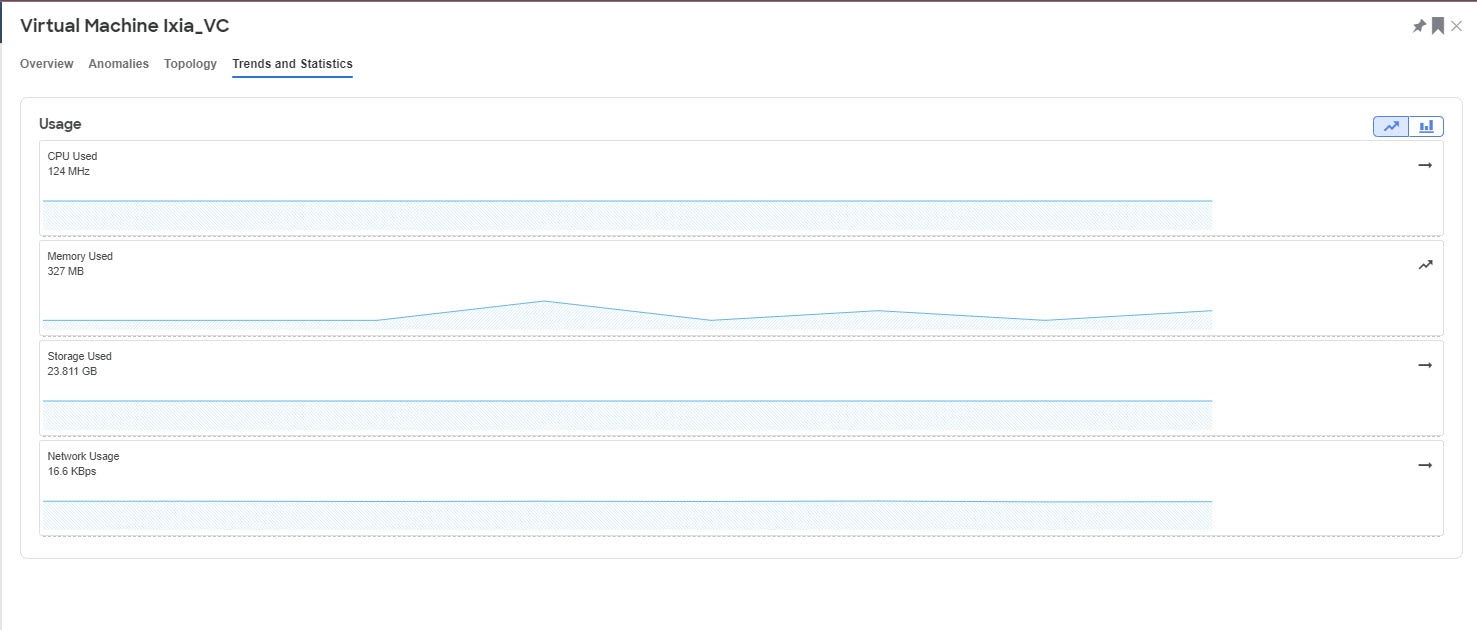
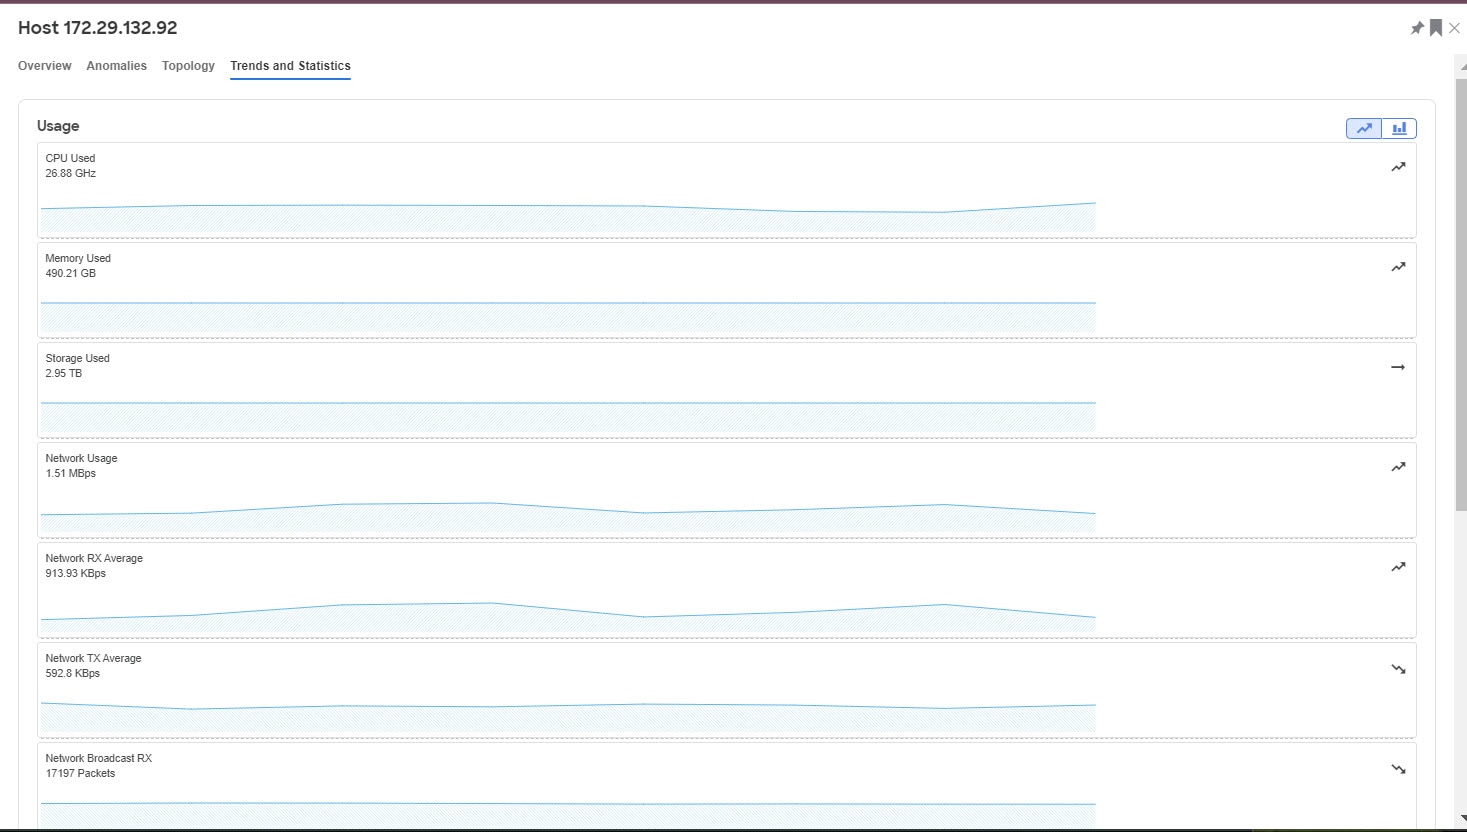
Trends and Statistics
This displays the usage graphs for CPU, Memory, Storage and Network. It can be viewed as separate graphs for each type of virtual machine or as a cumulative graph for all.
Anomalies
See Anomalies and Advisories for more information.
vCenter Hosts Dashboard
Select Hosts. Select the timeline.
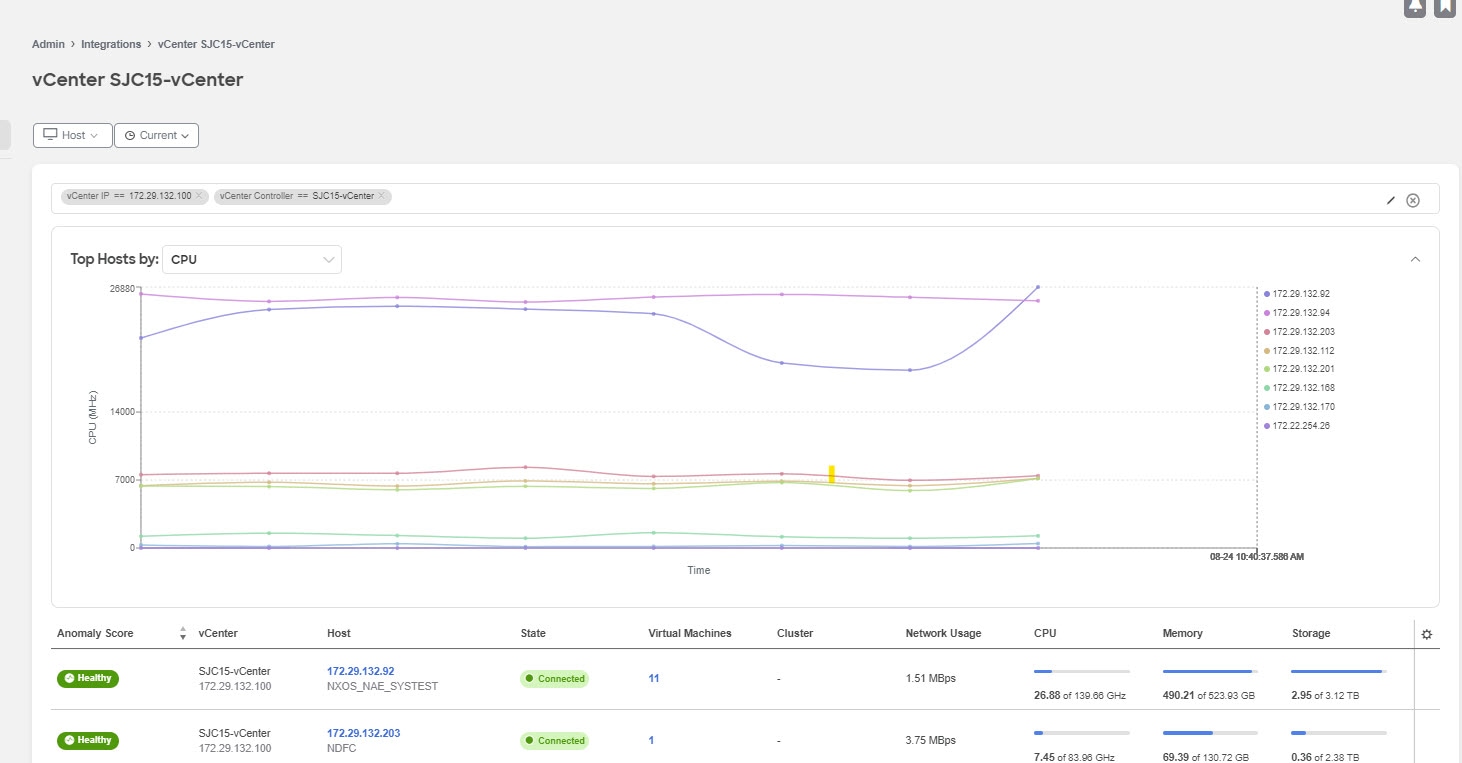
The dashboard presents the Top Hosts by CPU plotted on a timeline. From the drop-down list, select CPU, memory, storage, or network usage to view the graphical representation of the top virtual machines based on drop-down list selection.
Use the filter bar to filter by vCenter IP, vCenter Controller, VM, Host, State, Status, Guest OS, DNS Name, Datacenter, Network Adapters, Network Usage, CPU, Memory, and Storage.
Use the following operators for the filter refinement:
| Operator | Description |
|---|---|
|
== |
With the initial filter type, this operator, and a subsequent value, returns an exact match. |
|
!= |
With the initial filter type, this operator, and a subsequent value, returns all that do not have the same value. |
|
contains |
With the initial filter type, this operator, and a subsequent value, returns all that contain the value. |
|
!contains |
With the initial filter type, this operator, and a subsequent value, returns all that do not contain the value. |
The Hosts table displays the following information:
-
Anomaly Score
-
vCenter IP address
-
Host IP address
-
State
-
NVirtual Machines
-
Cluster
-
Network Usage
-
CPU
-
Memory
-
Storage
The Gear icon can be used to customize the columns to be displayed in the table.
Select any entry in the table to display the additional details:
-
Anomaly score categorized by Critical, Major, Minor and Warning.
-
General Information like State, Status, Guest OS, DNS Name, Host, IP Addresses, VCenter, Datacenter, and Network Adapters.
-
Usage graphs for CPU, Memory, Storage and Network.
-
Storage which displays the number of Datastores.
Hosts Details
Host details can be navigated to in two ways:
Click any host name in the table to view details
OR
Click the icon (Expand Icon) after clicking any row in the table to view details
The details mentioned below consist of all the data available in both the views of Host Details.
Overview
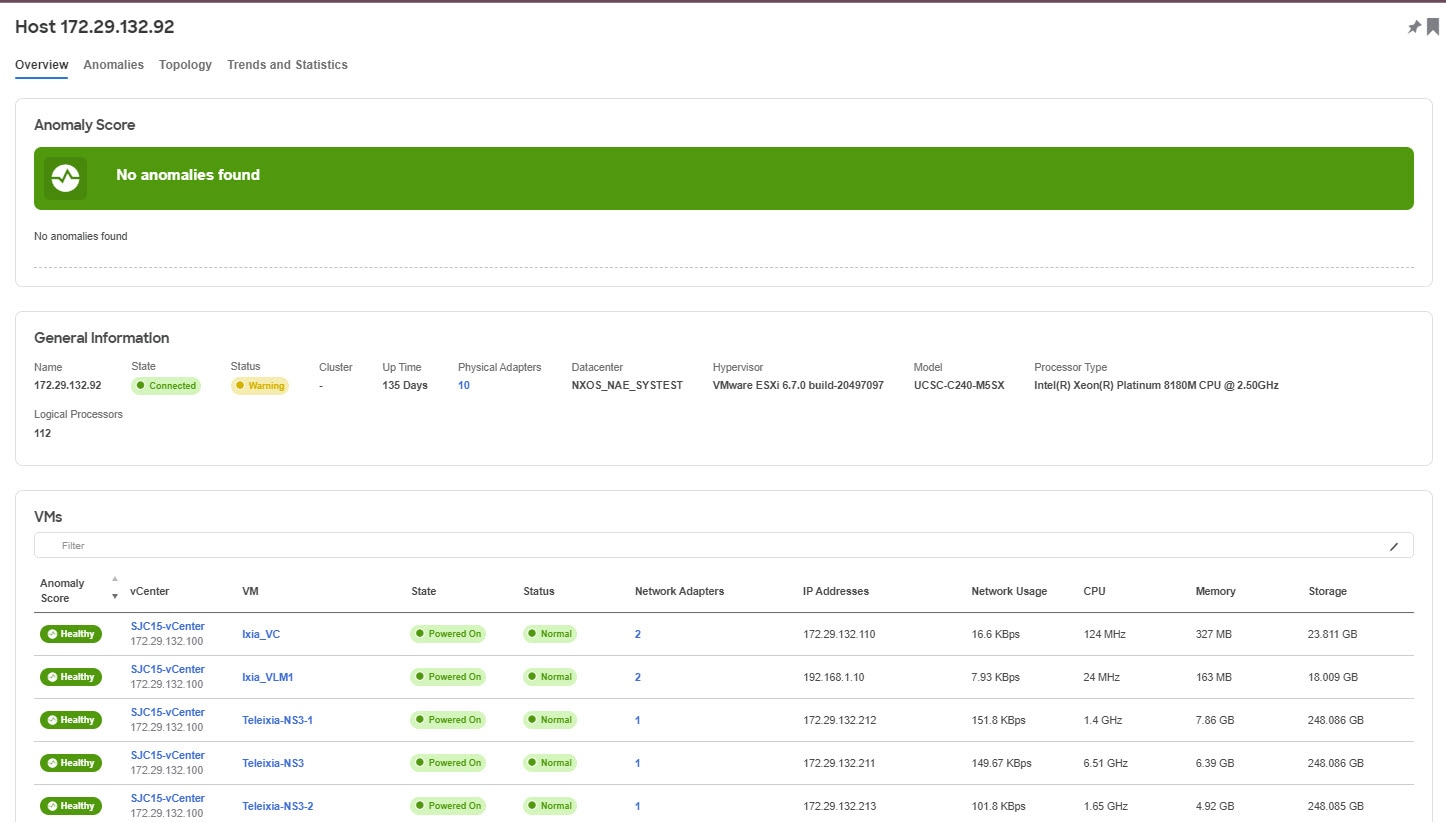
This displays the general information for the host along with the Anomaly Score, and tables listing the Virtual Machines, Datastores, Standard Switches, and Distributed Switches.
Physical Adapters
Click the number for Physical Adapters to view the entire list of adapters available. Select any of the adapters to view details like:
-
Link Status
-
Protocol
-
Interface
-
Node
-
Chassis ID
-
Management Address
-
Usage graphs for Network, Network Broadcast and Network Multicast
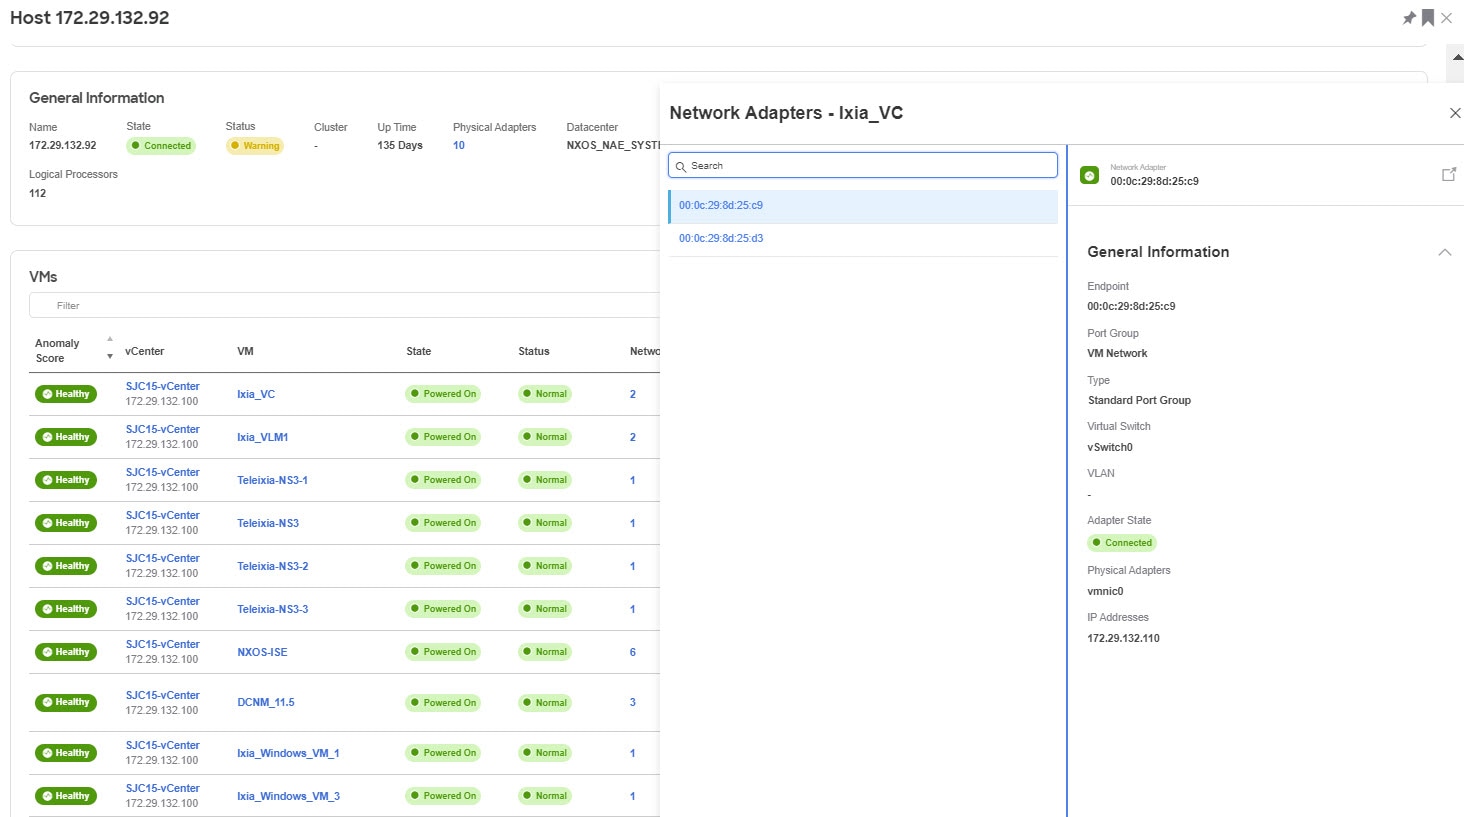
Network Adapters
Click the number for Network Adapters to view the entire list of adapters available. Select any of the adapters to view details like Endpoint address, Port Group, Type, Virtual Switch, VLAN, Adapter State, Physical Adapters, IP Addresses. Click on the Expand icon to view more details.
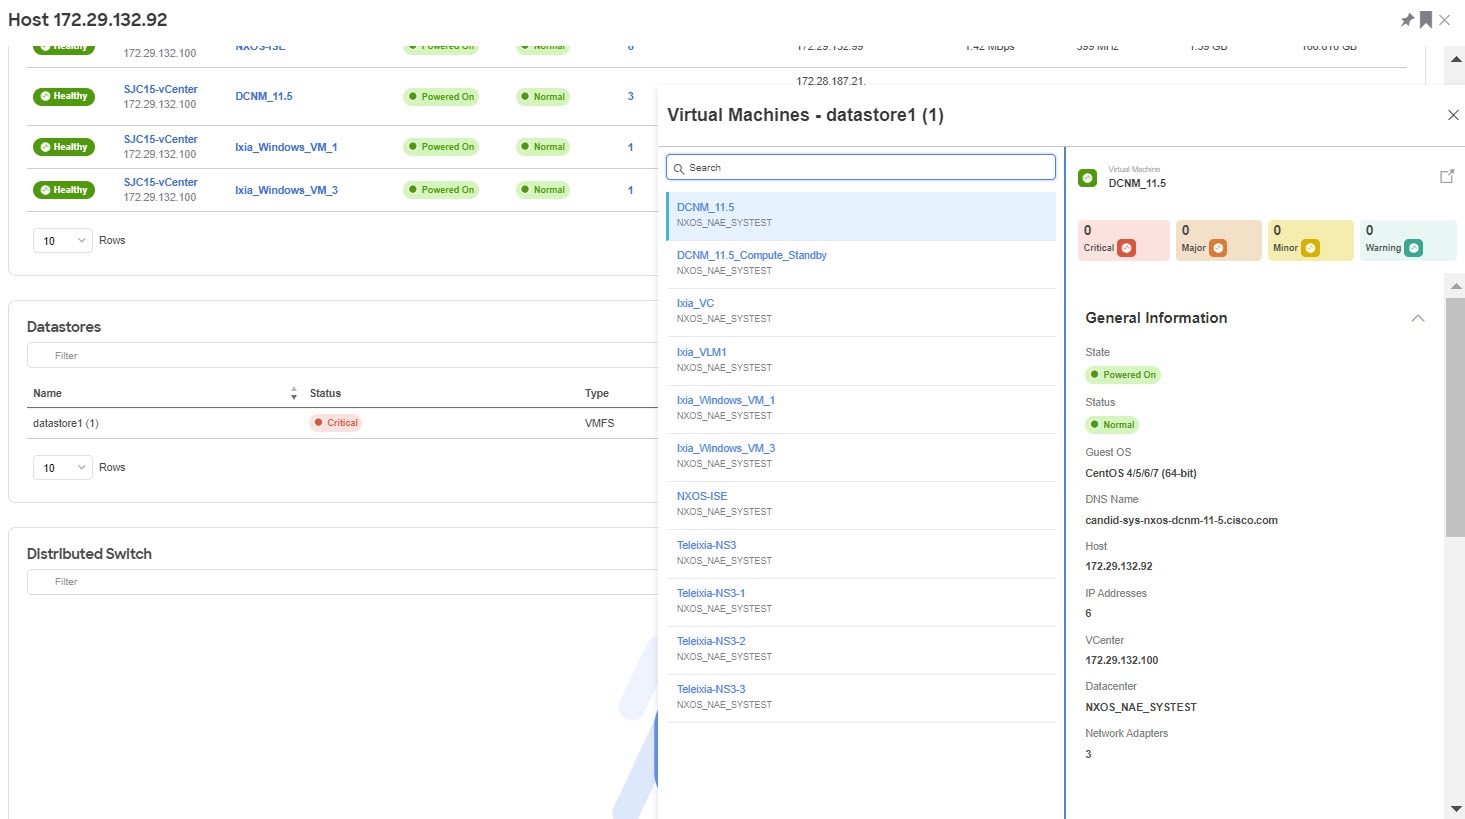
VMs
Click the number for VMs to view the entire list of virtual machines available. Select any of the virtual machines to view details.
Hosts
Click the number for hosts to view the entire list of hosts available. Select any of the hosts to view details.
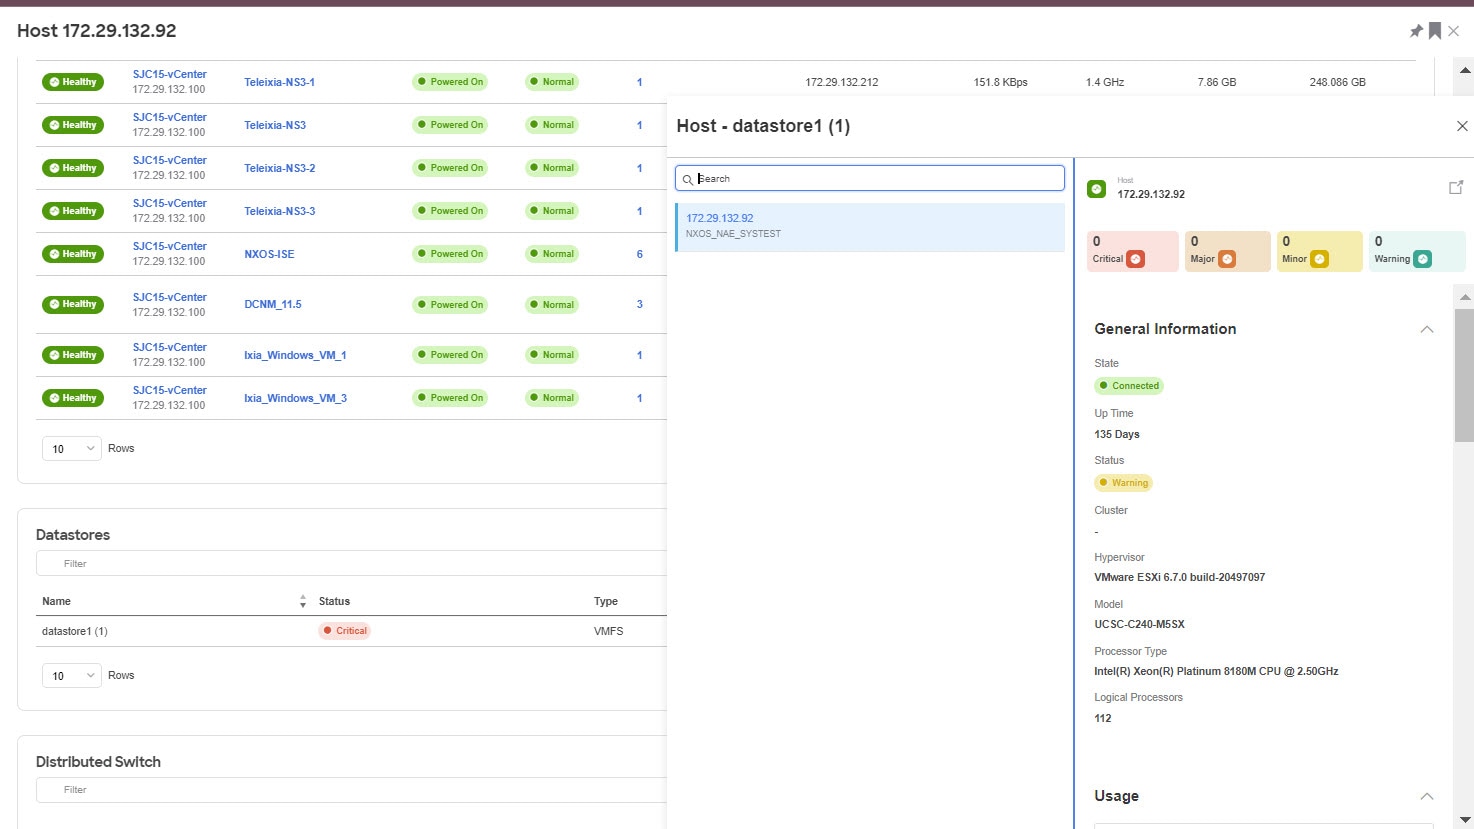
The information available for the host listed is the same as the information available from the Host Details screen.
Anomalies
Anomalies displays the list of anomalies. The anomalies can be viewed as grouped or ungrouped and can be viewed for a selected timeline.
See Anomalies and Advisories for more information.
Trends and Statistics
Trends and Statistics displays the usage graphs for Network, Network Broadcast and Network Multicast and can be viewed as separate graphs for each type of network or as a cumulative graph of all networks.
Alerts
Alerts displays the alarms from vCenter. In Nexus Dashboard Insights, the alarms from vCenter are displayed as anomalies. From the Actions drop-down menu, select an action to configure properties on an anomaly. The alerts can be filtered based on the following:
-
Acknowledgement
-
Anomaly ID
-
Assignee
-
Category
-
Check Code
-
Comment
-
Description
-
Detection Time
-
Entity Name
-
Last Seen Time
-
Nodes
-
Severity
-
Status
-
Sub-category
-
Tags
-
Title
-
Verification Status
-
IP Address
-
MAC Address
-
Interface
-
VPC
-
EPG
-
VRF
-
BG
Topology
Topology represents a hierarchical view of virtual machine > host > leaf switch in the fabric and the links between them with a logical or network view of how various objects are related.
Topology can be filtered for the following different objects:
-
Host
-
Datastore
-
DVS
-
Network
-
VM Network
-
VSS
-
Leaf
-
Application
Click any of the nodes to view more information about it.
DNS Integration
About DNS Integration
The Nexus Dashboard Insights Domain Name System (DNS) integration feature enables the name resolution feature to telemetry data. DNS integration can be associated at the Site level.
For DNS integration you can use any of the following 3 data source methods:
DNS File Upload
This method is simple because mappings do not change often. In the GUI, you can upload a file containing mappings. Use one of the supported formats (.csv and .json). Nexus Dashboard Insights verifies the integrity of the file. When required, you can also download or delete the file from the GUI.
If no VRF or Site name is specified, DNS will be applied to the sites for which the DNS server is configured based on the selections in Add Integrations and Associations section. If the DNS server is configured for multiple sites, then DNS will be applied to all the sites.
The DNS file upload size is limited to 1.8 MB.
Example CSV file
This section provides an example of a CSV file’s contents.
recordType  fqdn            ips         siteName    tenant          vrf
dnsEntry    WebSrv1.foo.com 10.101.11.1 ACI-Fab1    prod            vrf_prod
dnsEntry    WebSrv2.foo.com 10.101.11.2 ACI-Fab1    prod            vrf_prod
dnsEntry    WebSrv3.foo.com 10.101.11.3 ACI-Fab1    prod            vrf_prod
dnsEntry    WebSrv4.foo.com 10.101.11.4 ACI-Fab1    prod            vrf_prod
Example JSON file
This section provides an example of a JSON file’s contents.
[
    {
        "recordType": "dnsEntry",
        "fqdn": "WebSrv1.foo.com",
        "ips": [
            "10.101.11.1"
        ]
    },
    {
        "recordType": "dnsEntry",
        "fqdn": "WebSrv2.foo.com",
        "ips": [
            "10.101.11.2",
            "52::2"
        ]
    },
    {
        "recordType": "dnsEntry",
        "fqdn": "WebSrv3.foo.com",
        "ips": [
            "10.101.11.3",
            "52::3"
        ]
    },    {
        "recordType": "dnsEntry",
        "fqdn": "WebSrv4.foo.com",
        "ips": [
            "10.101.11.4",
            "10::101:0:4"
        ]
    }
]
DNS Query
Use this method one query at a time to retrieve data from the DNS server using reverse lookup. Reverse lookup zone(s) must be configured on the DNS server.
Nexus Dashboard Insights queries the DNS server at regular intervals and resolves IP addresses that are learned using endpoints.
Nexus Dashboard Insights allows one primary and multiple secondary DNS servers, the primary DNS server will be polled first. If the resolution does not succeed, the secondary servers will be polled thereafter.
DNS Zone Transfer
DNS Zone Transfer is also known as AXFR downloads. Nexus Dashboard Insights can retrieve zone data in bulk from the DNS server using AXFR downloads. This method is convenient for large quantities of data as you no longer have to work on one query at a time.
A zone transfer requires at least one DNS zone. If you configure a forward mapping zone, then all the A and AAAA records will be fetched from a DNS server, and if you configure a reverse mapping zone, then PTR records will be fetched. When onboarding the DNS server, you must provide a list of zones from which to fetch the data. Nexus Dashboard Insights will fetch the data from each zone configured from the DNS server.
TSIG (transaction signature) is a computer-networking protocol defined in RFC 2845. Primarily it enables the DNS to authenticate updates to a DNS database. For a secure transfer, Nexus Dashboard Insights allows you to configure the TSIG key for a zone to initiate the transaction. Configure the zone with the TSIG key, and an associated algorithm. In the Nexus Dashboard Insights GUI, the supported algorithms are displayed in a drop-down list.
When you delete an onboarded DNS server, all the zones will be un-configured automatically. A zone can be a forward mapping or a reverse mapping zone.
Guidelines and Limitations
-
DNS onboarding can be done at a site level.
-
Only one type of DNS integration method is supported in one site. For example, in a site, you cannot configure using DNS file uploads as well as DNS Zone Transfer methods.
-
Multiple DNS integration onboarding of the same type is allowed in a site. For example, multiple files can be onboarded, to a site using the DNS file uploads method.
-
If you perform DNS integration onboarding for multiple sites, you cannot also onboard a site in that group.
-
When a corrupted or malformed .CSV of .JSON file is uploaded to the DNS server, Cisco Nexus Dashboard Insights raises system anomalies. However, the Connectivity Status of the third-party onboarding server, remains in the initialized state and does not change to display a failed state. If the third-party onboarding server remains in the initialized state, check the system anomalies for any anomalies related to the specific integration.
-
The supported scale for DNS integration is 40,000 DNS entries. For vND application profiles, the supported scale for DNS integration is 10,000 DNS entries.
-
Data from DNS servers will be polled or refreshed every 3 hours. So, any changes in the mapping on the DNS server will reflect after the next polling cycle.
Configure DNS
The .json or .csv file used in this task must be uploaded in a specific schema. See the following section for the formats to use.
-
Click Admin > Integrations > Add Integration.
-
Select DNS for the Integration Type.
-
In the Authentication section, select one of the following DNS types to view the corresponding fields:
-
Zone Transfer - Enter the Name, DNS Server IP, DNS Server Port, and Zones. In the Zones area, enter the value for Zone Name. Optional values that can be entered are TSIG Key Name, TSIG Key Value, TSIG Algorithm. The TSIG Algorithm dropdown menu selections are hmac-sha1, hmac-sha256, hmac-sha512, hmac-md5.
-
Query Server - Enter the Name, DNS Server IP, DNS Server Port, and Secondary Servers.
-
Mapping File - Enter the Name, Description, and Upload a JSON or CSV file.
-
-
In the Associations area, click Add Associations to associate a site or multiple sites.
-
The Summary displays an overview of the Integration created.
-
Click Save to add the integration. The post completion success screen allows you to Add Another Integration or View Integrations.
Edit or Delete DNS Configuration
To edit your DNS configuration, click the Actions icon and click Edit. When you have completed editing, click Add.
To delete your DNS configuration, click the Actions icon and click Delete.
Formats for Files Used in DNS File Uploads
When configuring the DNS file uploads, .json and .csv formats are supported. Use the formats provided below for the files that you upload.
The fields in a DNS file upload can have optional VRF or Site name information. If you have a file that contains the site name, specifying the VRF is optional.
Format .json
[
  {
        "recordType": "dnsEntry",
        "fqdn": "host1.cisco.com",
        "ips": ["1.1.0.0"],
        "vrf": "vrf-1",
        "siteName": "swmp3",
   },
  {
        "recordType": "dnsEntry",
        "fqdn": "host2.cisco.com",
        "ips": ["1.1.0.1"],
        "vrf": "vrf-1",
        "siteName": "swmp3",
   }
 {
         "recordType": "dnsEntry",
         "fqdn": "host3.cisco.com",
         "ips": ["1.1.0.2"],
 },
]
Format .csv
recordType,fqdn,ips,siteName,vrf
dnsEntry,swmp3-leaf1.cisco.com,"101.22.33.44",swmp3,vrf-1
dnsEntry,swmp5-leaf1.cisco.com,"10.2.3.4,10.4.5.6,1.2.3.4",fabric2,vrf-2
dnsEntry,swmp4-leaf1.cisco.com, "1.1.1.1",,,
Panduit PDU Integration
Panduit PDU Integration
Panduit Power Distribution Unit (PDU) Integration in Nexus Dashboard Insights enables you to monitor energy usage and unlock sustainability insights for sites and individual devices connected to a Panduit PDU. Monitoring energy consumption gives you insight into how much electricity your devices and/or Panduit PDUs are using.
The workflow for integration of Panduit PDU consists of the following steps:
-
Install Panduit PDU collector and PDUs.
-
Add PDU collector to Nexus Dashboard Insights. The PDU collector collects telemetry from PDUs in your environment.
-
Associate PDUs to the PDU collector. The associated PDUs sends telemetry to the Panduit PDU collector, and Nexus Dashboard Insights displays PDU statistics in the Sustainability Report. See Sustainability Report.
Prerequisites
-
You have installed Panduit Collector and PDUs.
-
You have associated the PDUs to the collector.
-
You have configured a persistent IP address for PDU collector to stream telemetry information for one or multiple PDUs in your site in Nexus Dashboard. In Nexus Dashboard, navigate to Admin > System Settings > General > External Service Pools > Add Data Service IP Address to configure the persistent IP address.
-
You have configured the SNMP protocol in the PDU.
Guidelines and Limitations
-
After you onboard the PDU collector in Nexus Dashboard Insights, it will take at least 15 minutes for the number of number of devices powered by the PDU collector to be displayed in the Nexus Dashboard Insights GUI.
-
Once the number of number of devices powered by the PDU collector to be displayed in the Nexus Dashboard Insights GUI, the PDU data is updated every 15 minutes in Nexus Dashboard Insights.
-
Scale limits for Panduit PDU integration:
-
Maximum number of PDUs supported per Nexus Dashboard cluster - 1000
-
Maximum number of PDUs supported per fabric - 500
-
-
If you have not configured the PDU name in the Panduit PDU GUI, the PDU name is not displayed in the PDU table in Nexus Dashboard Insights.
Add PDU Integration
-
Navigate to Admin > Integrations > Add Integration.
-
Select Integration Type Panduit PDU.
-
Complete the following fields for PDU Collector.
-
Enter the name of the PDU Collector.
-
Enter the IP address of the PDU Collector.
-
Enter the username and password to authenticate the PDU Collector.
-
Select an online site to associate with the PDU Collector. A PDU Collector is associated with single site.
Snapshot site is not supported.
-
Click Next.
-
-
Complete the following fields for Add PDUs to add PDUs to the PDU collector.
-
The PDU collector version and status is displayed in the summary. Once the PDU collector is added successfully, you can add the PDUs to the collector.
-
Enter the IP address of the PDU.
-
Click Add to Collector.
-
-
Complete the following fields for PDU credentials.
Ensure that you have configured the SNMP protocol in the PDU.
-
Select the SNMP protocol version.
-
For SNMP protocol version 2, enter the community string and click Submit.
-
For SNMP protocol version 3, enter the user name.
-
Select the Authentication Type and Protocol.
-
Enter the Authentication password.
-
Select the Privacy Protocol and enter the password.
-
Click Submit.
-
After the PDU credentials are verified, the PDU is added to the collector and the PDU status is displayed in the table. In the table you can view details such as PDU status, PDU name, IP address of primary and secondary PDU, model, and serial number. For secondary PDU or Daisy-chained PDUs, you can view all the PDUs linked to the primary PDU.
-
Click Next.
-
-
Review the PDU information in the PDU Summary and click Done.
-
To add another PDU Collector click Add Another PDU Collector.
-
To view PDU Collector details, click View PDU Collector.
-
View PDU Integration
-
Navigate to Admin > Integrations. In the Integrations Dashboard you can view the list of Panduit PDUs associated with a site. For each PDU integration you can view the Name, Connectivity Status, Type, IP address, Last Active, and Associations.
-
Click PDU collector name to view additional details.
-
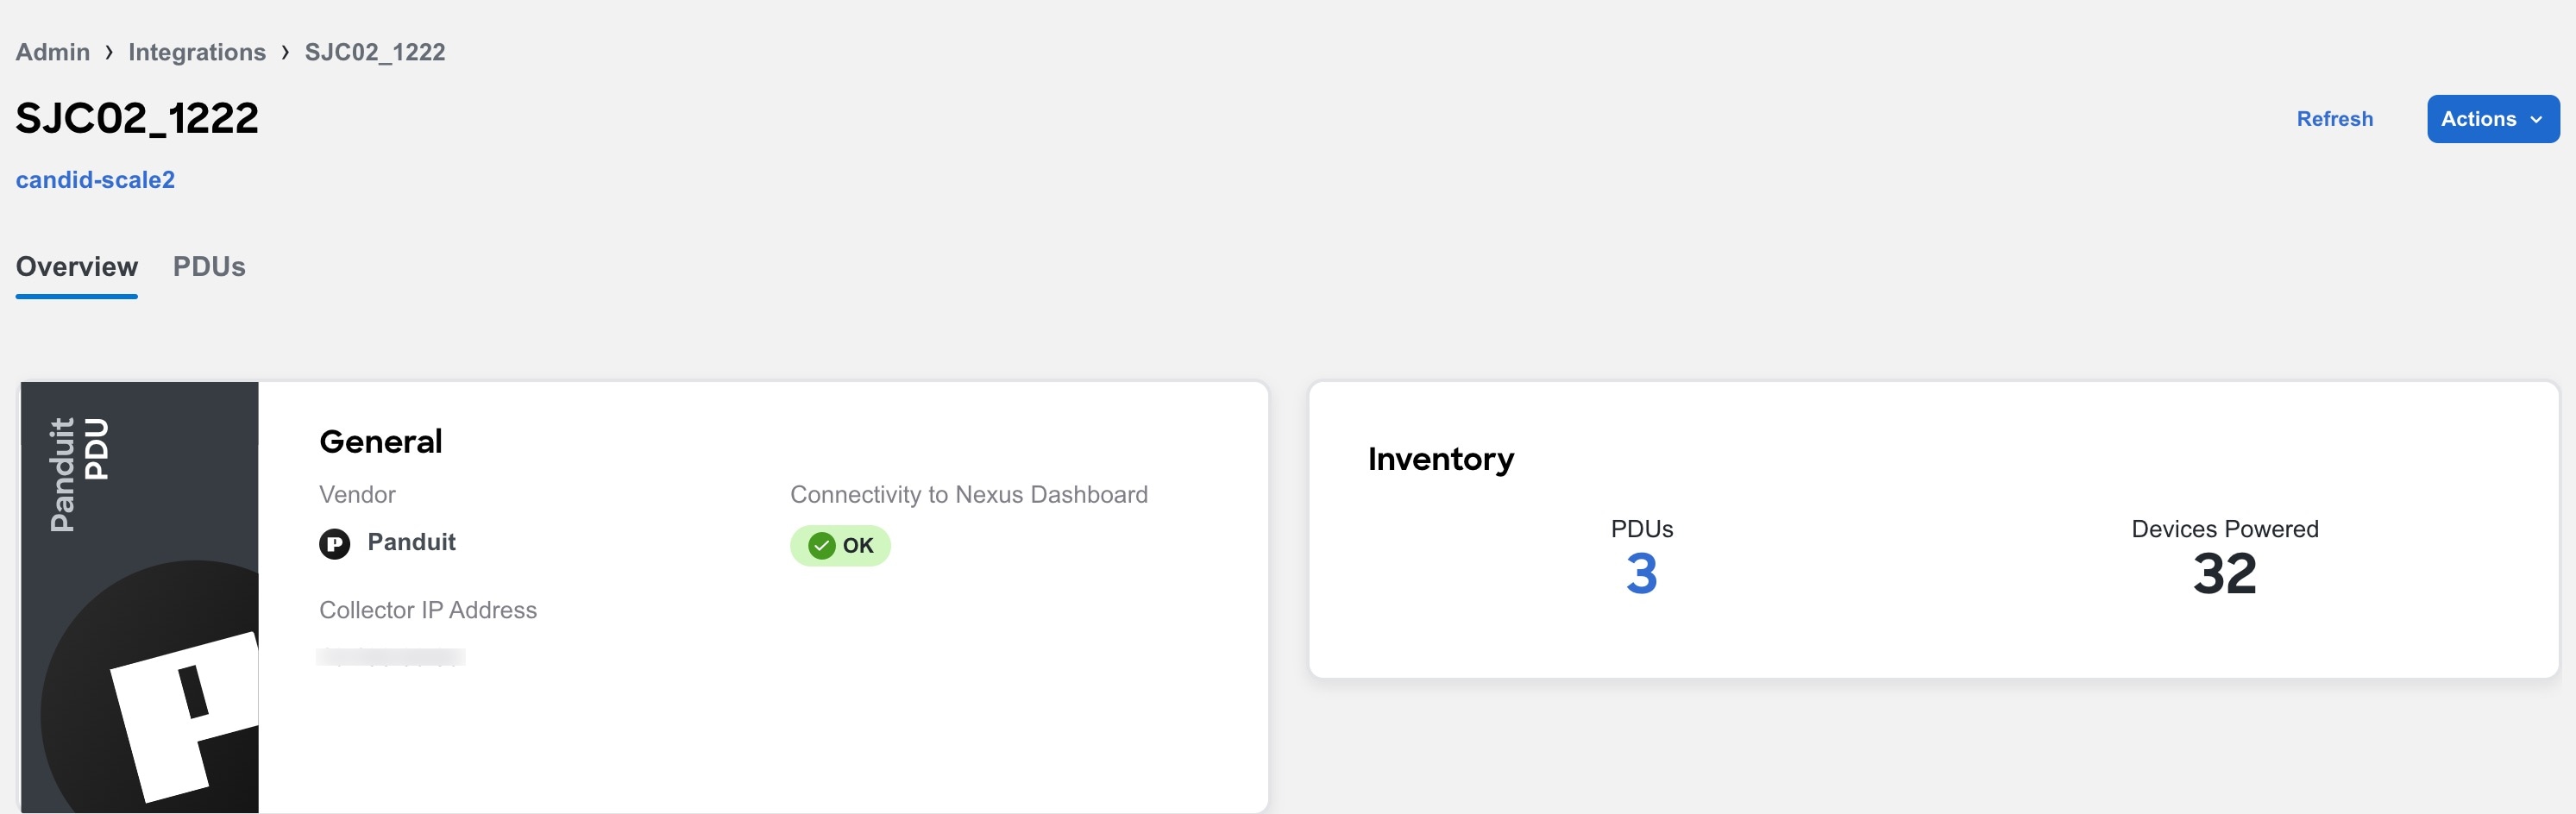
Click Overview to view information such as collector IP address, connectivity to Nexus Dashboard, number of PDUs associated with the PDU collector, and number of devices powered by the PDU collector.
-
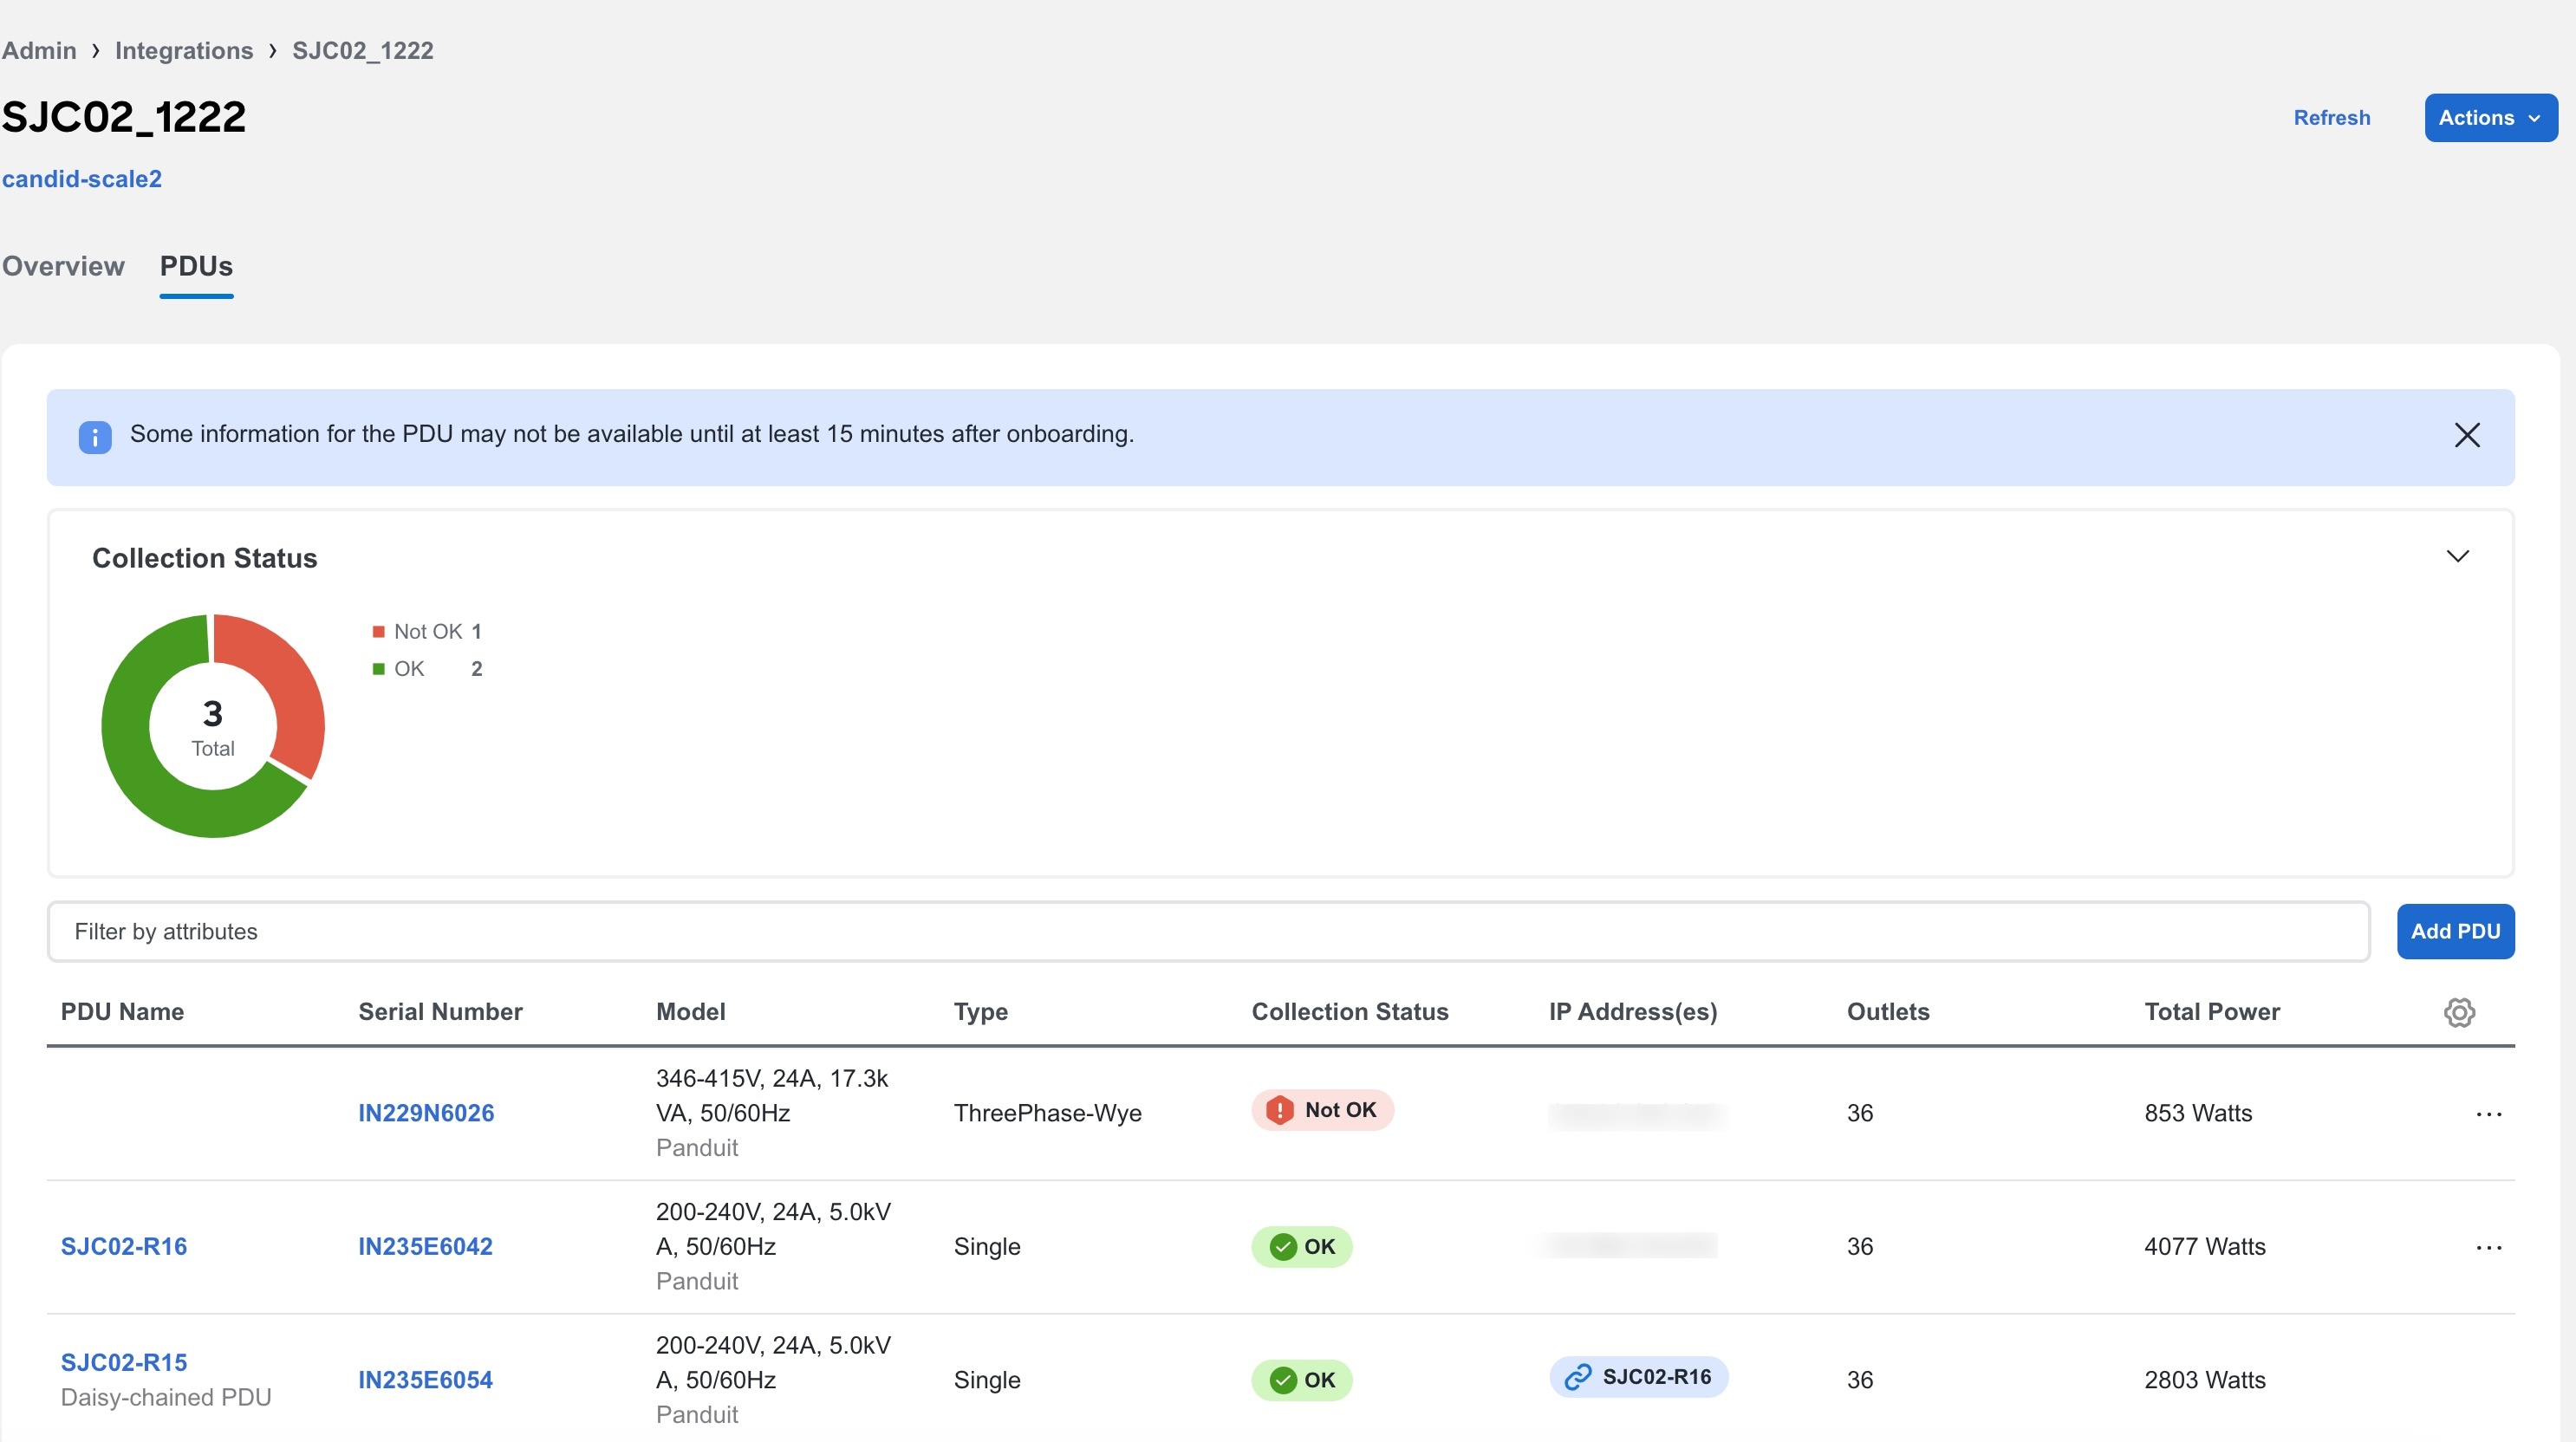
Click PDUs to view the onboarding status of the PDUs associated with the PDU collector as a doughnut chart.
-
Use the search bar to filter the PDUs by name, serial number, model, type, collection status, IP addresses, outlets, and total power.
-
The PDUs table displays the filtered PDUs. The PDU table displays the PDU name name, serial number, model, type ( single or three phase), collection status, IP addresses, outlets, and total power.
-
Click the column heading to sort the PDUs in the table.
-
Click the gear icon to configure the columns in the PDUs table.
-
Click the ellipse icon and click Remove from this Collector to remove the PDU.
-
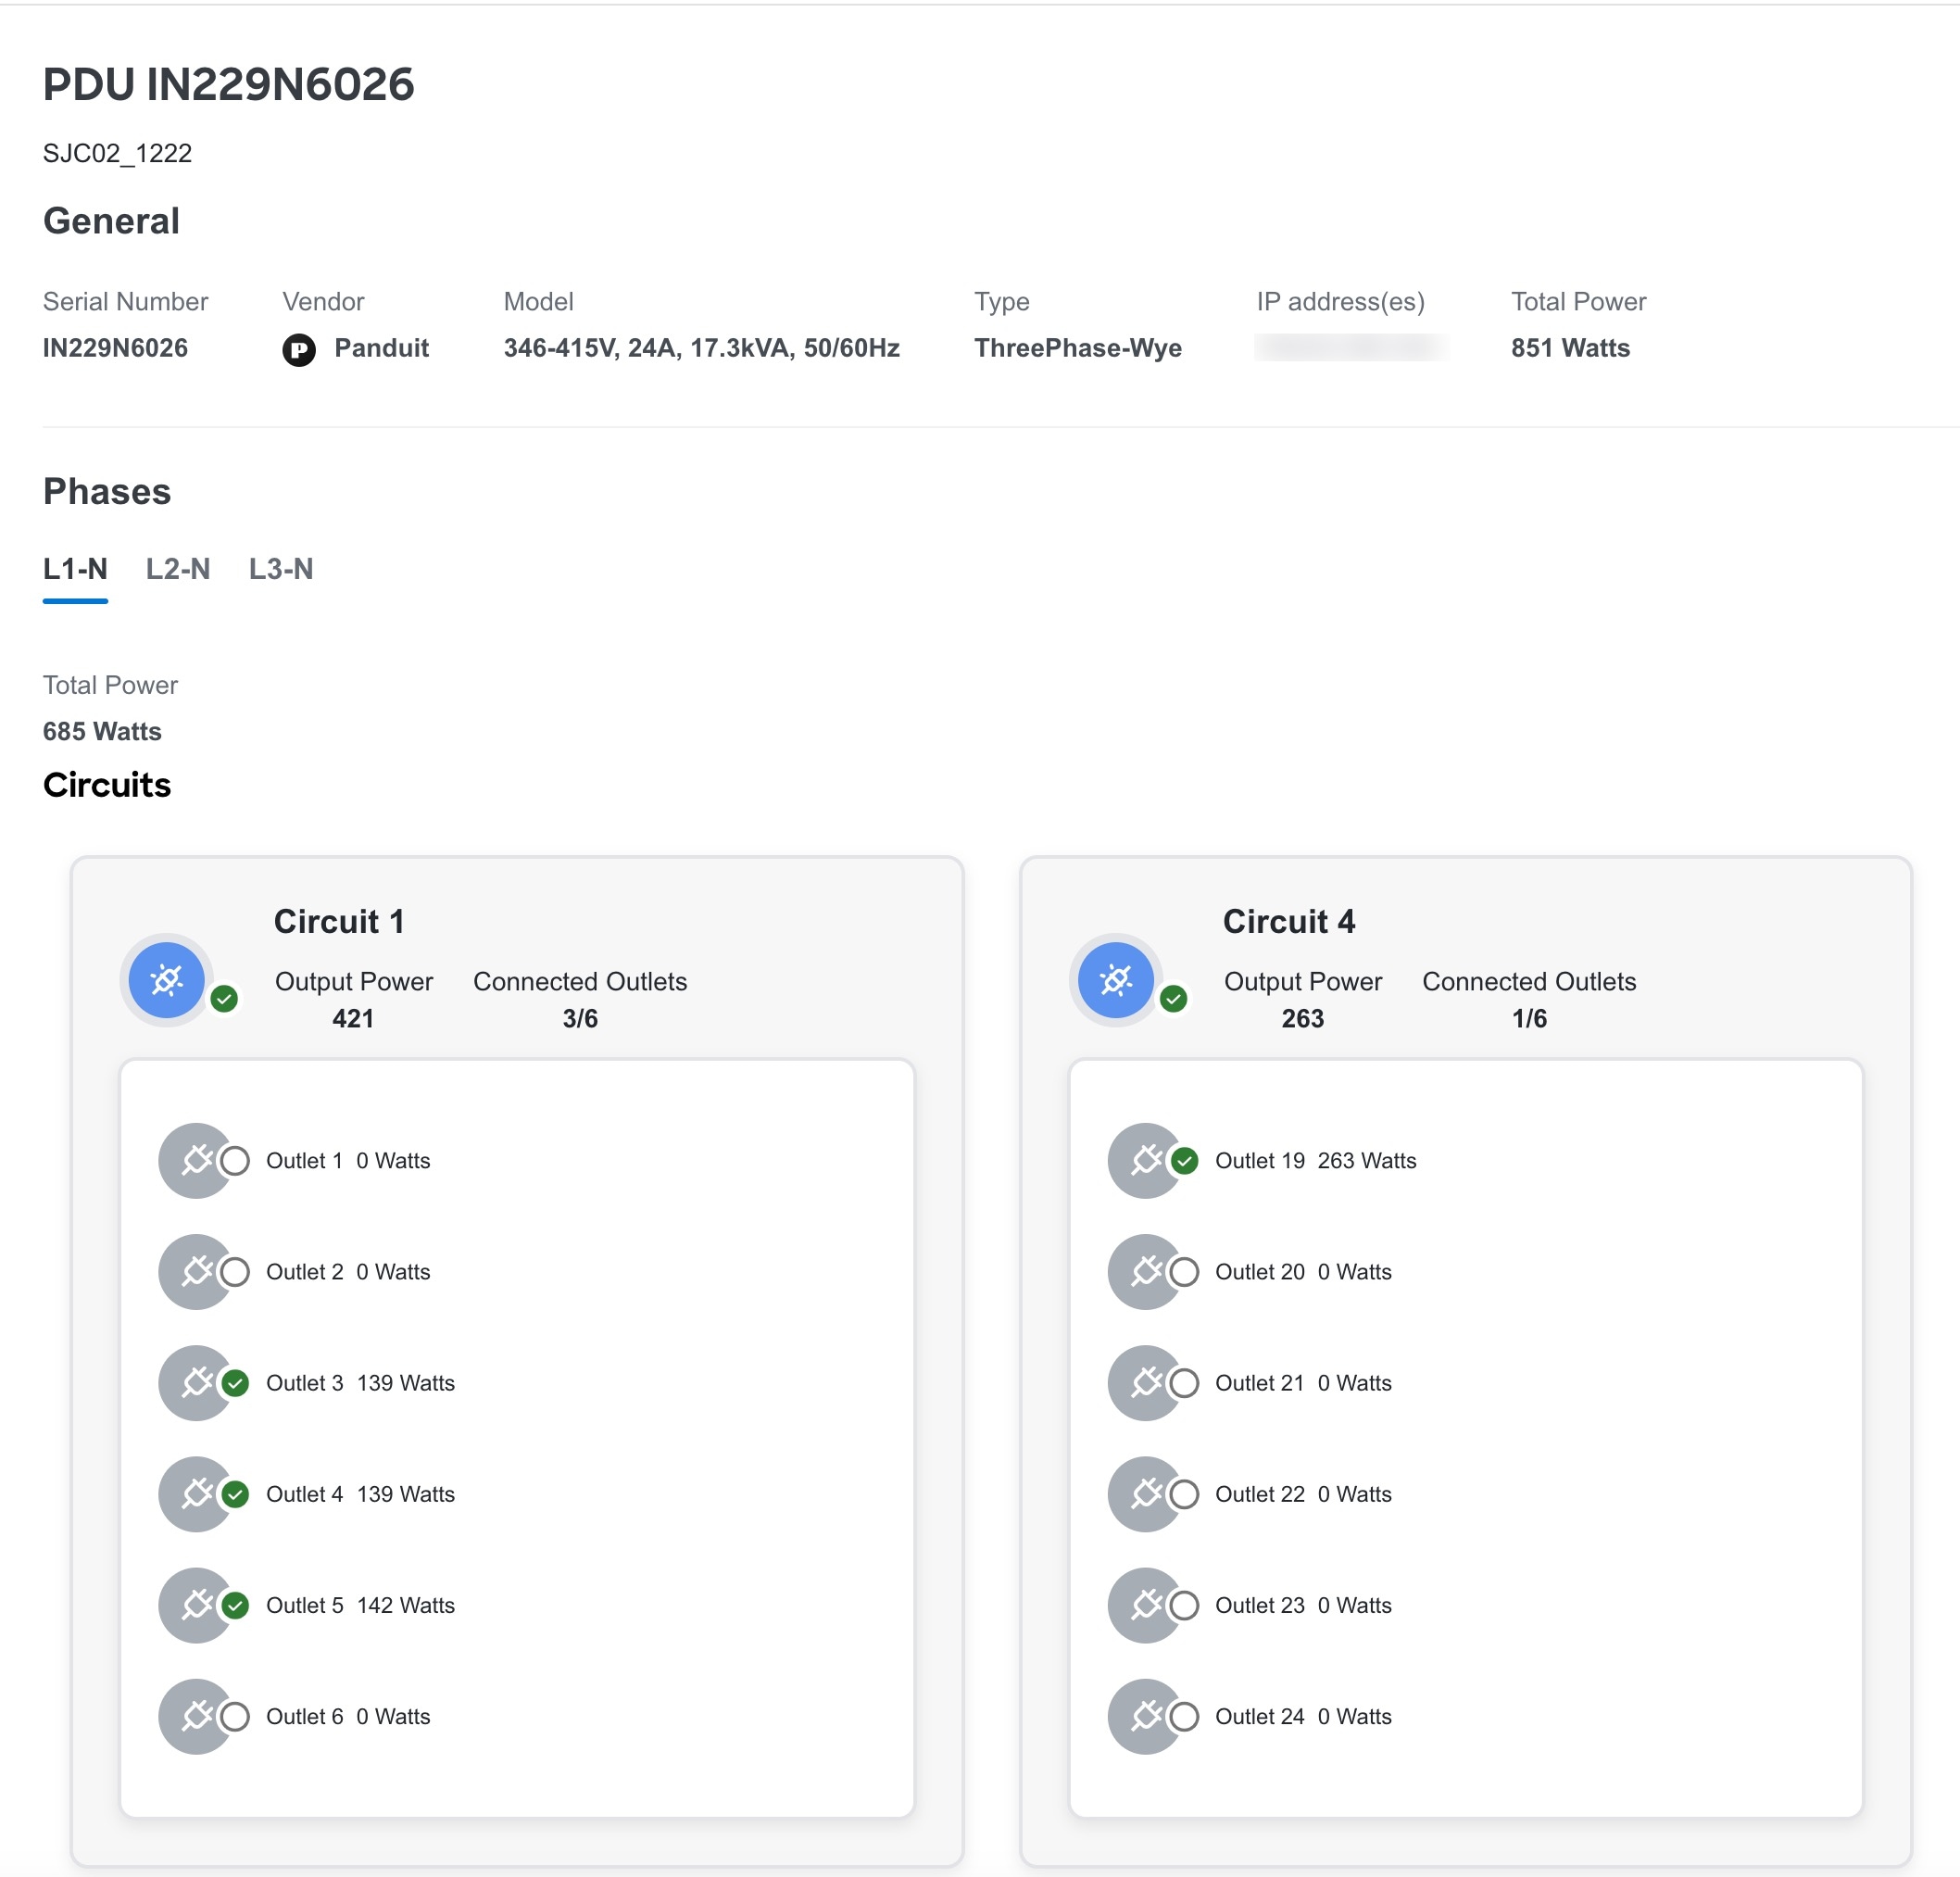
Click PDU name to view additional details such as general information, phases, and circuits. For Three Way type PDUs, you can the view the different phases.
Copyright
THE SPECIFICATIONS AND INFORMATION REGARDING THE PRODUCTS IN THIS MANUAL ARE SUBJECT TO CHANGE WITHOUT NOTICE. ALL STATEMENTS, INFORMATION, AND RECOMMENDATIONS IN THIS MANUAL ARE BELIEVED TO BE ACCURATE BUT ARE PRESENTED WITHOUT WARRANTY OF ANY KIND, EXPRESS OR IMPLIED. USERS MUST TAKE FULL RESPONSIBILITY FOR THEIR APPLICATION OF ANY PRODUCTS.
THE SOFTWARE LICENSE AND LIMITED WARRANTY FOR THE ACCOMPANYING PRODUCT ARE SET FORTH IN THE INFORMATION PACKET THAT SHIPPED WITH THE PRODUCT AND ARE INCORPORATED HEREIN BY THIS REFERENCE. IF YOU ARE UNABLE TO LOCATE THE SOFTWARE LICENSE OR LIMITED WARRANTY, CONTACT YOUR CISCO REPRESENTATIVE FOR A COPY.
The Cisco implementation of TCP header compression is an adaptation of a program developed by the University of California, Berkeley (UCB) as part of UCB’s public domain version of the UNIX operating system. All rights reserved. Copyright © 1981, Regents of the University of California.
NOTWITHSTANDING ANY OTHER WARRANTY HEREIN, ALL DOCUMENT FILES AND SOFTWARE OF THESE SUPPLIERS ARE PROVIDED “AS IS" WITH ALL FAULTS. CISCO AND THE ABOVE-NAMED SUPPLIERS DISCLAIM ALL WARRANTIES, EXPRESSED OR IMPLIED, INCLUDING, WITHOUT LIMITATION, THOSE OF MERCHANTABILITY, FITNESS FOR A PARTICULAR PURPOSE AND NONINFRINGEMENT OR ARISING FROM A COURSE OF DEALING, USAGE, OR TRADE PRACTICE.
IN NO EVENT SHALL CISCO OR ITS SUPPLIERS BE LIABLE FOR ANY INDIRECT, SPECIAL, CONSEQUENTIAL, OR INCIDENTAL DAMAGES, INCLUDING, WITHOUT LIMITATION, LOST PROFITS OR LOSS OR DAMAGE TO DATA ARISING OUT OF THE USE OR INABILITY TO USE THIS MANUAL, EVEN IF CISCO OR ITS SUPPLIERS HAVE BEEN ADVISED OF THE POSSIBILITY OF SUCH DAMAGES.
Any Internet Protocol (IP) addresses and phone numbers used in this document are not intended to be actual addresses and phone numbers. Any examples, command display output, network topology diagrams, and other figures included in the document are shown for illustrative purposes only. Any use of actual IP addresses or phone numbers in illustrative content is unintentional and coincidental.
The documentation set for this product strives to use bias-free language. For the purposes of this documentation set, bias-free is defined as language that does not imply discrimination based on age, disability, gender, racial identity, ethnic identity, sexual orientation, socioeconomic status, and intersectionality. Exceptions may be present in the documentation due to language that is hardcoded in the user interfaces of the product software, language used based on RFP documentation, or language that is used by a referenced third-party product.
Cisco and the Cisco logo are trademarks or registered trademarks of Cisco and/or its affiliates in the U.S. and other countries. To view a list of Cisco trademarks, go to this URL: http://www.cisco.com/go/trademarks. Third-party trademarks mentioned are the property of their respective owners. The use of the word partner does not imply a partnership relationship between Cisco and any other company. (1110R)
© 2017-2024 Cisco Systems, Inc. All rights reserved.