Introduction
This document describes the process that is used in order to generate a diagnostic file via the Support Tool application that is available on the Cisco Secure Endpoint Mac connector and how to troubleshoot performance issues.
Prerequisites
Requirements
Cisco recommends that you have knowledge of these topics:
- Secure Endpoint Mac connector
- macOS
Components Used
The information in this document is based on the Secure Endpoint Mac connector.
The information in this document was created from the devices in a specific lab environment. All of the devices used in this document started with a cleared (default) configuration. If your network is live, make sure that you understand the potential impact of any command.
Background Information
The Secure Endpoint Mac connector packages an application called Support Tool, which is used in order to generate diagnostic information about the connector that is installed on your Mac. The diagnostic data includes information about your Mac such as:
- Resource utilization (disk, CPU, and memory)
- connector-specific logs
- connector configuration information
Generate a Diagnostic File with the Support Tool
This section describes how to launch the Support Tool application from the GUI or the CLI in order to generate a diagnostic file.
Launch the Support Tool Using macOS Finder
Complete these steps in order to launch the Secure Endpoint Mac connector Support Tool using the macOS Finder:
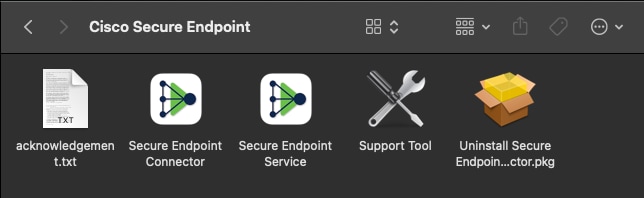
- Navigate to the Cisco Secure Endpoint directory in your Applications folder and locate the Support Tool launcher:
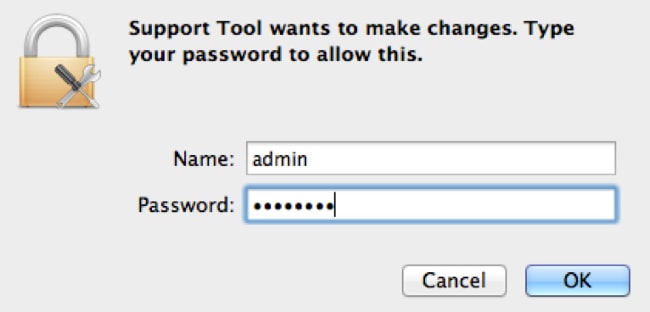
- Double-click the Support Tool launcher, and you are prompted for administrative credentials:
- After you enter your credentials, the Support Tool icon should appear in your dock:

Note: The Support Tool application runs in the background and takes some time to complete (approximately 20-30 minutes).
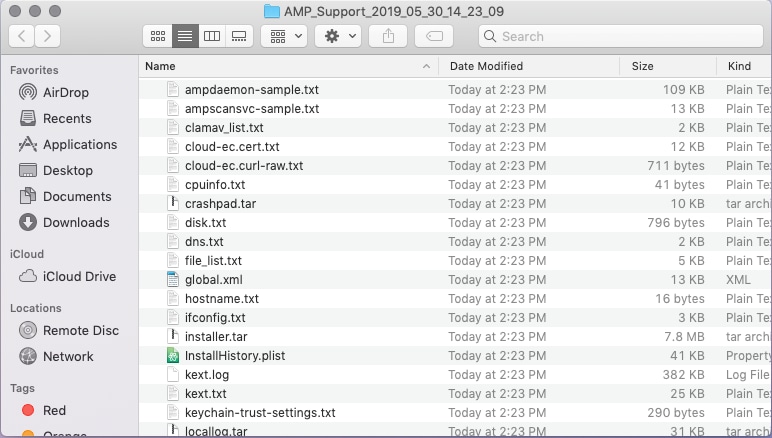
- When the Support Tool application completes, a file is generated and placed onto your desktop:

Here is an example of the uncompressed output:
- In order to analyze the data, provide this file to the Cisco Technical Support Team.
Launch the Support Tool Using macOS Terminal
The Support Tool launcher is located in this directory:
/Library/Application Support/Cisco/AMP for Endpoints Connector/
In order to launch the Support Tool application, enter the following command:
Note: You must run this command as root, so ensure that you switch to root or preface the command with sudo.
root@mac# cd /Library/Application\ Support/Cisco/AMP\ for\ Endpoints\ Connector
root@mac# ./SupportTool
Note: This command runs verbosely. Once it is complete, a diagnostic file is generated and placed onto your desktop.
Troubleshooting
This section describes how to enable and disable debug mode on the Secure Endpoint Mac connector in order to troubleshoot performance issues.
Enable Debug Mode
Warning: Debug mode should be enabled only if a Cisco Technical Support Engineer makes a request for this data. If you keep debug mode enabled for an extended period of time, it can fill up the disk space very quickly and might prevent the connector Log and Tray Log data from being gathered in the Support Diagnostic file due to excessive file size.
Debug mode is useful with attempts to troubleshoot performance issues on a Secure Endpoint connector. Complete these steps in order to enable debug mode and collect diagnostic data;
- Log in to the Secure Endpoint Console.
- Navigate to Management > Policies.
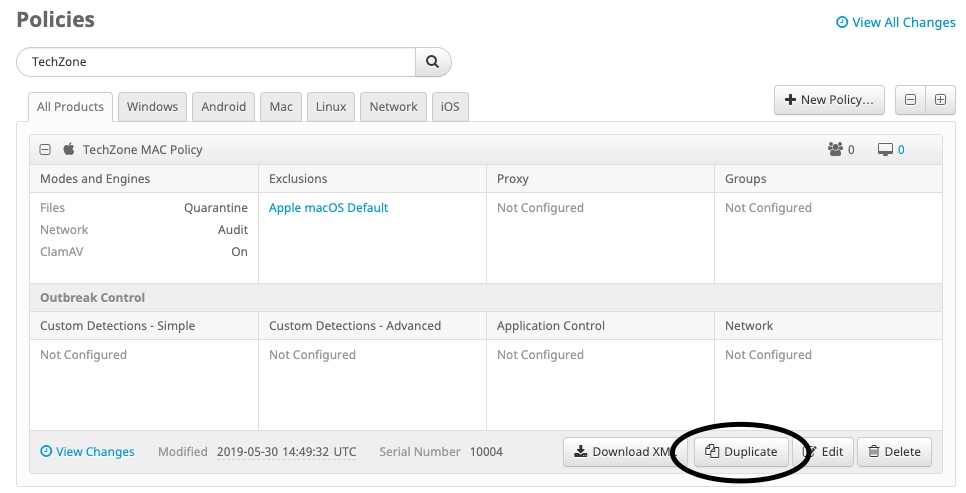
- Locate a policy that is applied to a computer, click on the policy which will expand the policy window, and click Duplicate. The Secure Endpoint Console updates with the duplicated policy:
- Select and expand the duplicate policy window, click Edit and change the name of the policy. For example, you could use Debug TechZone MAC Policy.
- Click Advanced Settings, select Administrative Features from the sidebar, and select Debug for both the connector Log Level and Tray Log Level drop down menus:
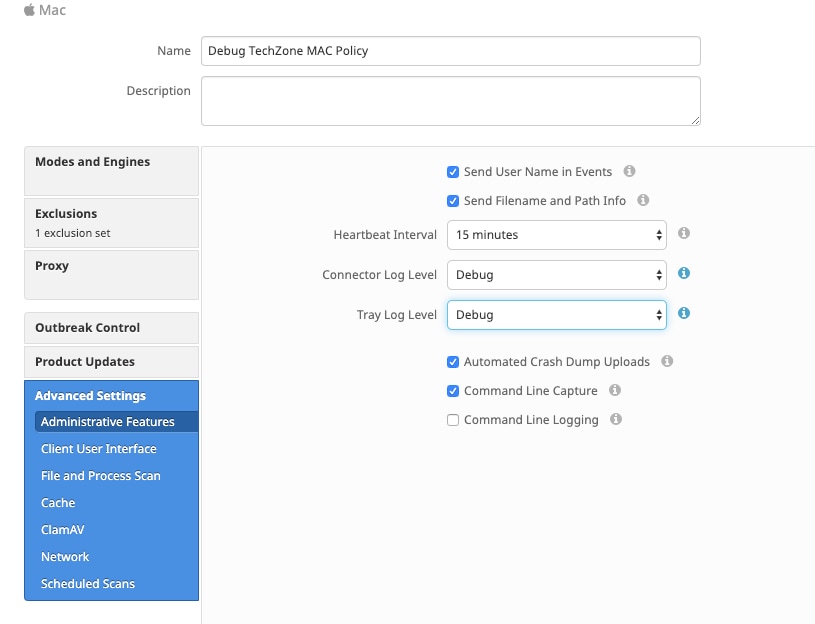
- Click the Save button in order to save the changes.
- Navigate to Management > Groups and click Create Group near the top-right side of your screen.
-
Enter a name for the group. For example, you could useDebug TechZone Mac Group.
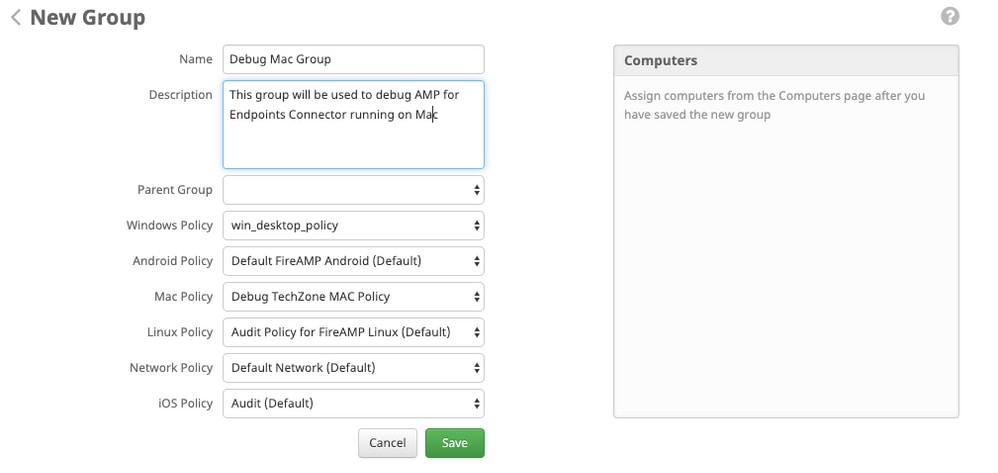
- Change the Mac Policy from Default Mac Policy to the duplicated, new policy that you just created, which is Debug TechZone Mac Policy in this example. Click Save.
- Navigate to Management > Computers and identify your computer in the list. Select it and click Move to Group....
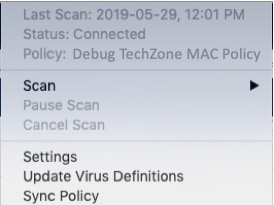
- Select your newly created group from the Select Group drop down menu. Click Move to move the selected computer into your new group. Your Mac should now have a functional debug policy. You can select the Secure Endpoint icon that appears on your menu bar and ensure that the new policy is applied:
Enable Single Heartbeat Debug Mode
This procedure is only available for the 1.0.4 connector and above. This allows for a single connector to be put into debug mode until the next heartbeat. Depending on the situation, this may provide enough information for our developers but dependent on the length of heartbeat, risks not catching all the processes necessary to make a full diagnostic analysis. Here are the steps to enable Debug for a single Heartbeat:
- Access the connector menu bar and go to Settings.
- Click on About.
- Click the right-half of the Secure Endpoint Logo.
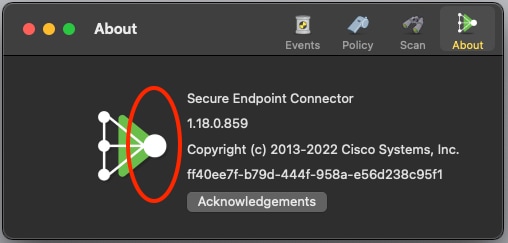
- if it was done correctly, The following notice will pop up on the right side of the screen:

Debug will automatically disable after the next heartbeat.
Disable Debug Mode
After the diagnostic data in debug mode is obtained, you must revert the Secure Endpoint connector back to the normal mode. Complete these steps in order to disable debug mode:
-
Log in to the Secure Endpoint Console.
- Navigate to Management > Groups.
-
Locate the new group,Debug TechZone Mac Group, that you created in debug mode.
- Click Edit.
-
In theComputerswindow located towards the top-right of your screen, locate your computer in the list. Select it, which will take you to theComputerspage. Once again, select your computer from the list, and clickMove to Group....
-
Select your previous group from theSelect Groupdrop down menu. ClickMoveto move the selected computer into the previous group.
-
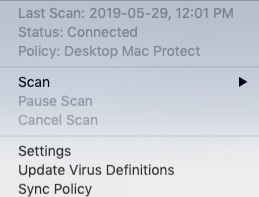
Click on the Secure Endpoint icon in your menu bar. SelectSync Policyfrom the menu.
-
Verify that the policy is now returned to the previous default value. Check this on the menu bar. The policy should now have reverted back to the original policy that was used before you changed it to theDebug TechZone Mac Group:
Debug mode is now disabled, and the Secure Endpoint connector should function normally.
 Feedback