Cisco Catalyst SD-WAN Splunk Integration User Guide
Available Languages
Bias-Free Language
The documentation set for this product strives to use bias-free language. For the purposes of this documentation set, bias-free is defined as language that does not imply discrimination based on age, disability, gender, racial identity, ethnic identity, sexual orientation, socioeconomic status, and intersectionality. Exceptions may be present in the documentation due to language that is hardcoded in the user interfaces of the product software, language used based on RFP documentation, or language that is used by a referenced third-party product. Learn more about how Cisco is using Inclusive Language.
Cisco SD-WAN and ZBFW
A software-defined wide area network (SD-WAN) is a virtualized service that connects and extends enterprise networks over large geographical distances. Cisco SD-WAN provides unparalleled visibility across WAN, optimal connectivity for end users, and the most comprehensive security platform to harden the network. The Cisco Zone-Based Firewall is the successor of the Classic IOS firewall or CBAC (Context-Based Access Control). It primarily deals with the security “zones”.We can assign router interfaces to various security zones and control the traffic between them. The firewall dynamically inspects traffic passing through zones.
Cisco SD-WAN Splunk Integration
Cisco SD-WAN Splunk Integration will have 2 components:
● Cisco SD-WAN Add-on for Splunk
● Cisco SD-WAN App for Splunk
Cisco SD-WAN Add-on for Splunk
Add-ons are used for data optimization and collection processes. Cisco SD-WAN Add-on for Splunk collects different types of Cisco logs Data and Netflow Data and stores them into Splunk indexes.
Cisco SD-WAN App for Splunk
The Cisco SD-WAN App will present dashboards for different types of Cisco Logs and NetFlow Data. The app is used for visualization, analysis, and representation. The dashboard will use the data collected by the Add-on.
● Install Splunk App for Stream & Splunk Add-on for Stream Forwarders in the Splunk instance to collect the NetFlow (v9) data.
● Make sure that the receiver UDP port (Ex. 4739) is open and bypass the firewall traffic.
Installation and Configuration of Cisco SD-WAN
The Add-on and App can be installed in two different ways:
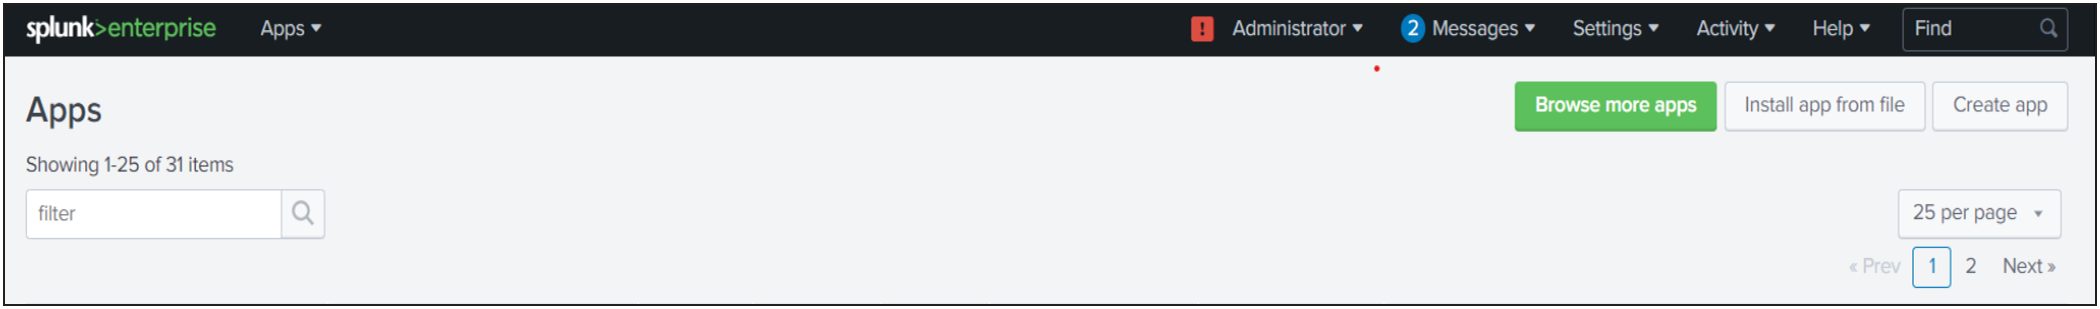
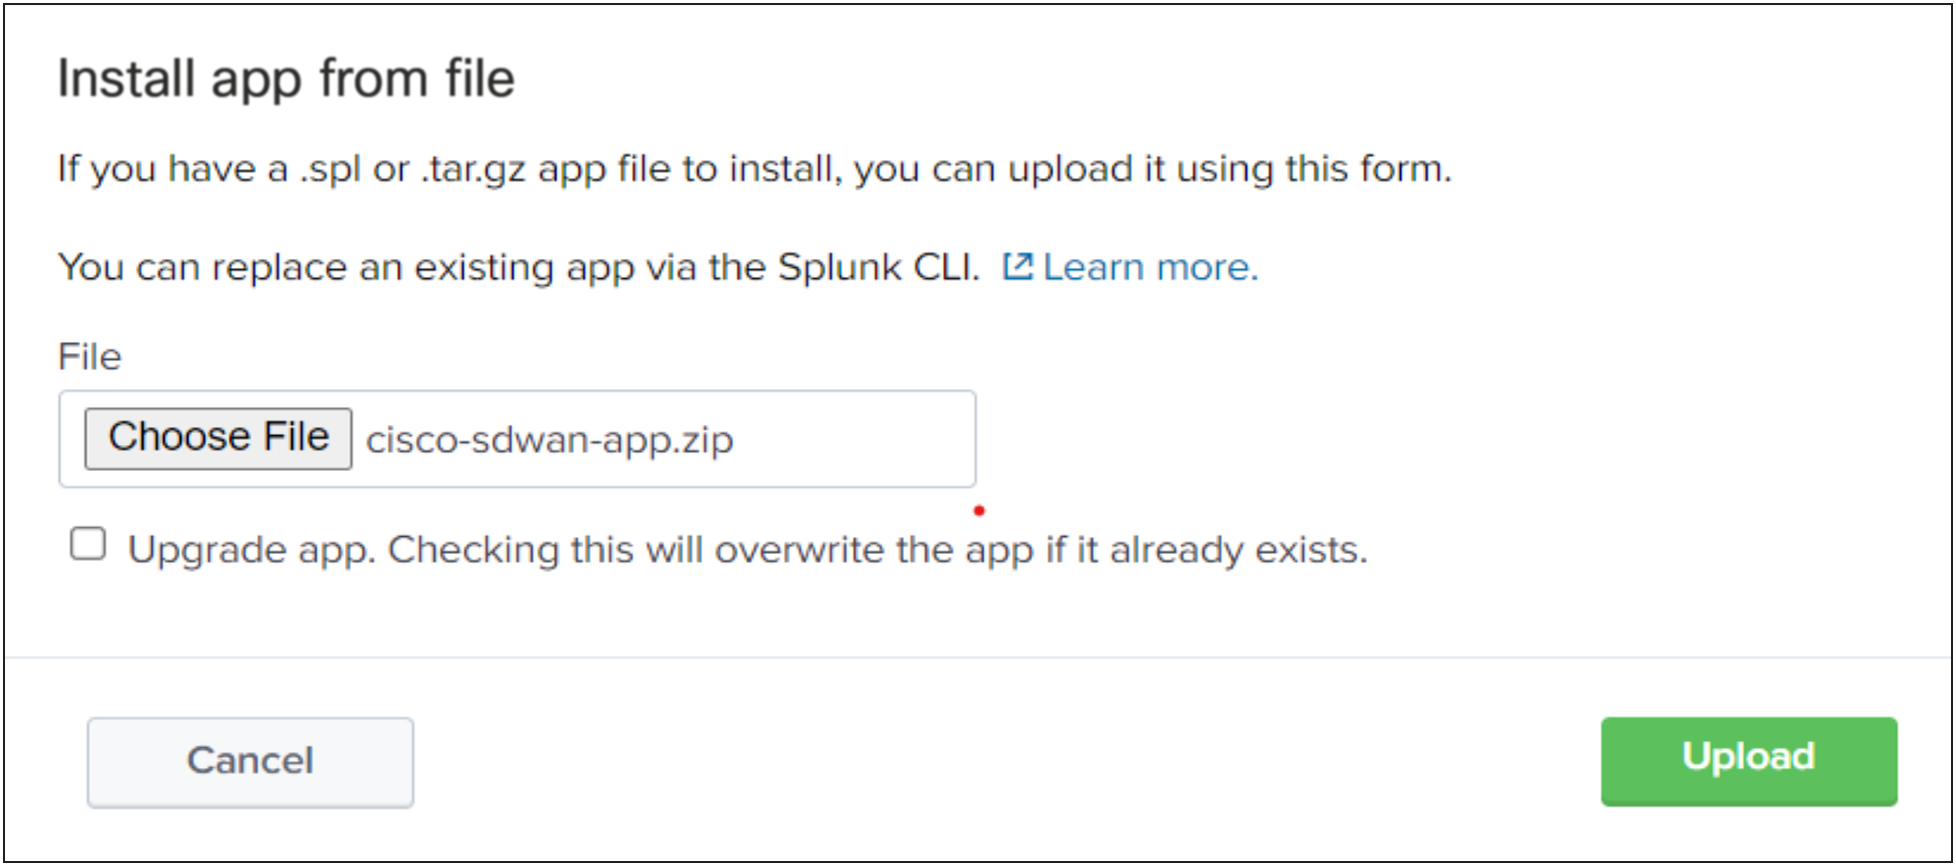
● Through the Splunk user interface from Apps > Manage Apps > Install the app from file. Upload the downloaded file.
● By extracting the compressed file (<>-xx-x.x.x-x.tar.gz) into the $SPLUNK_HOME$/etc/apps folder.
● Note: Splunk restart is required after App and Add-on installation.

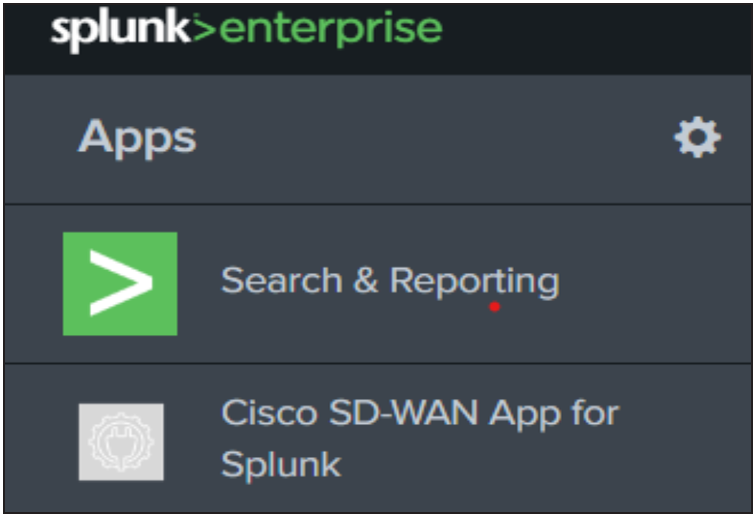
● Once you log in under Splunk, click on Cisco SD-WAN App For Splunk on the left side of the screen.
Add-on Configuration
Configure Inputs on Splunk for Syslog Data:
The "Cisco SD-WAN Add-on for Splunk" manages inputs through TCP/UDP inputs provided by Splunk. To configure inputs:
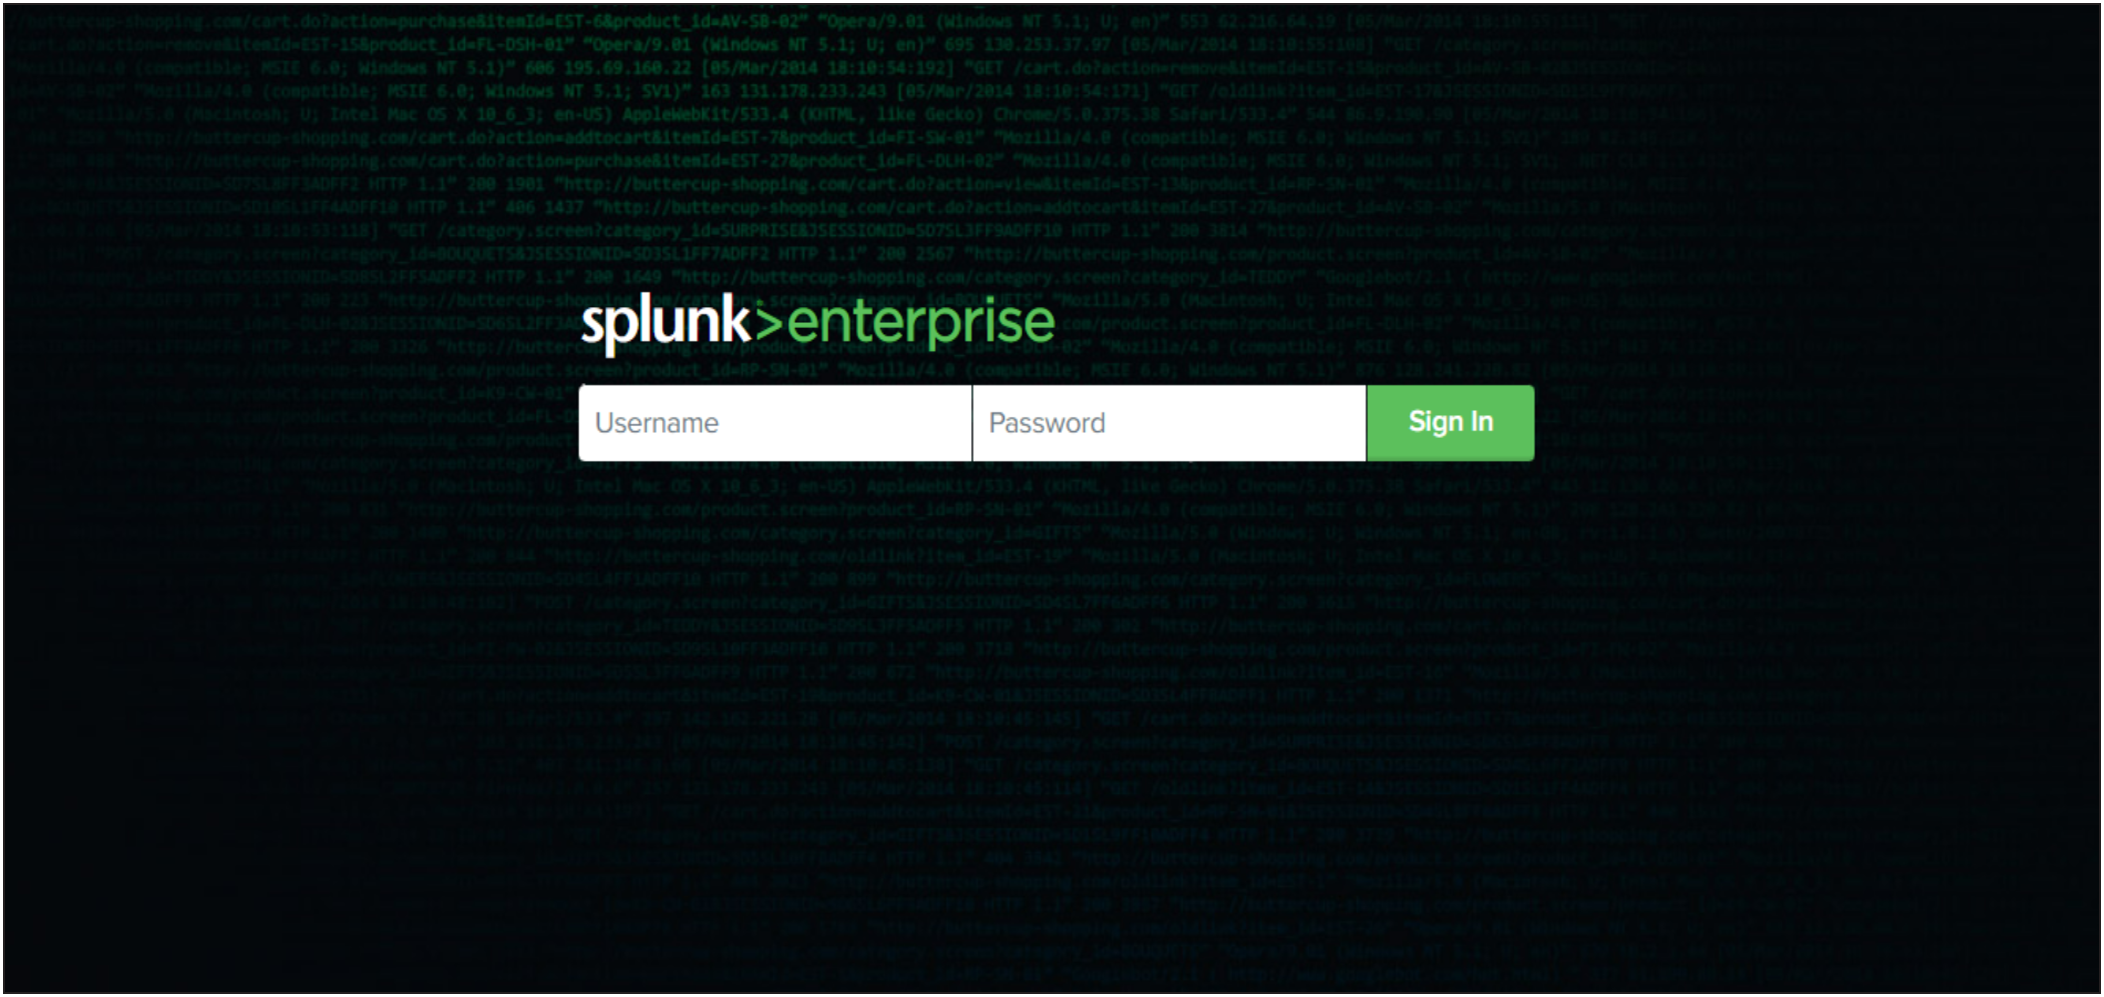
1. Login to Splunk WEB UI.
2. Navigate to Settings > Data inputs.
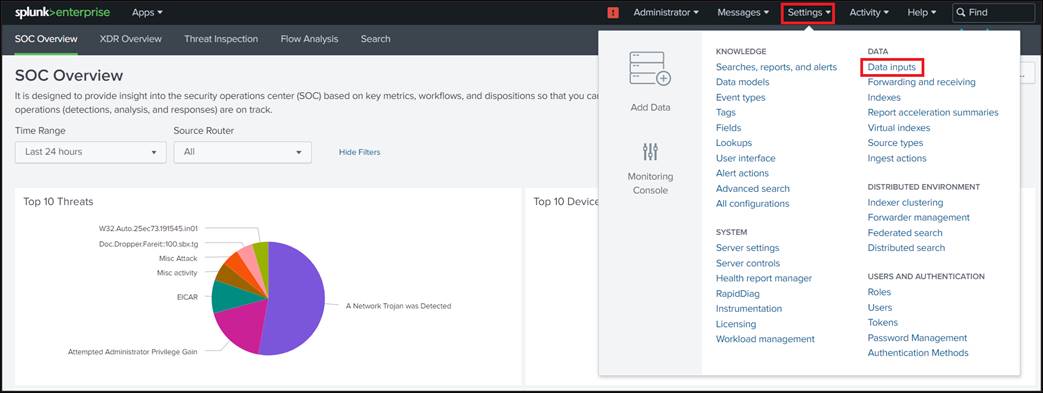
3. Choose TCP or UDP and click New.
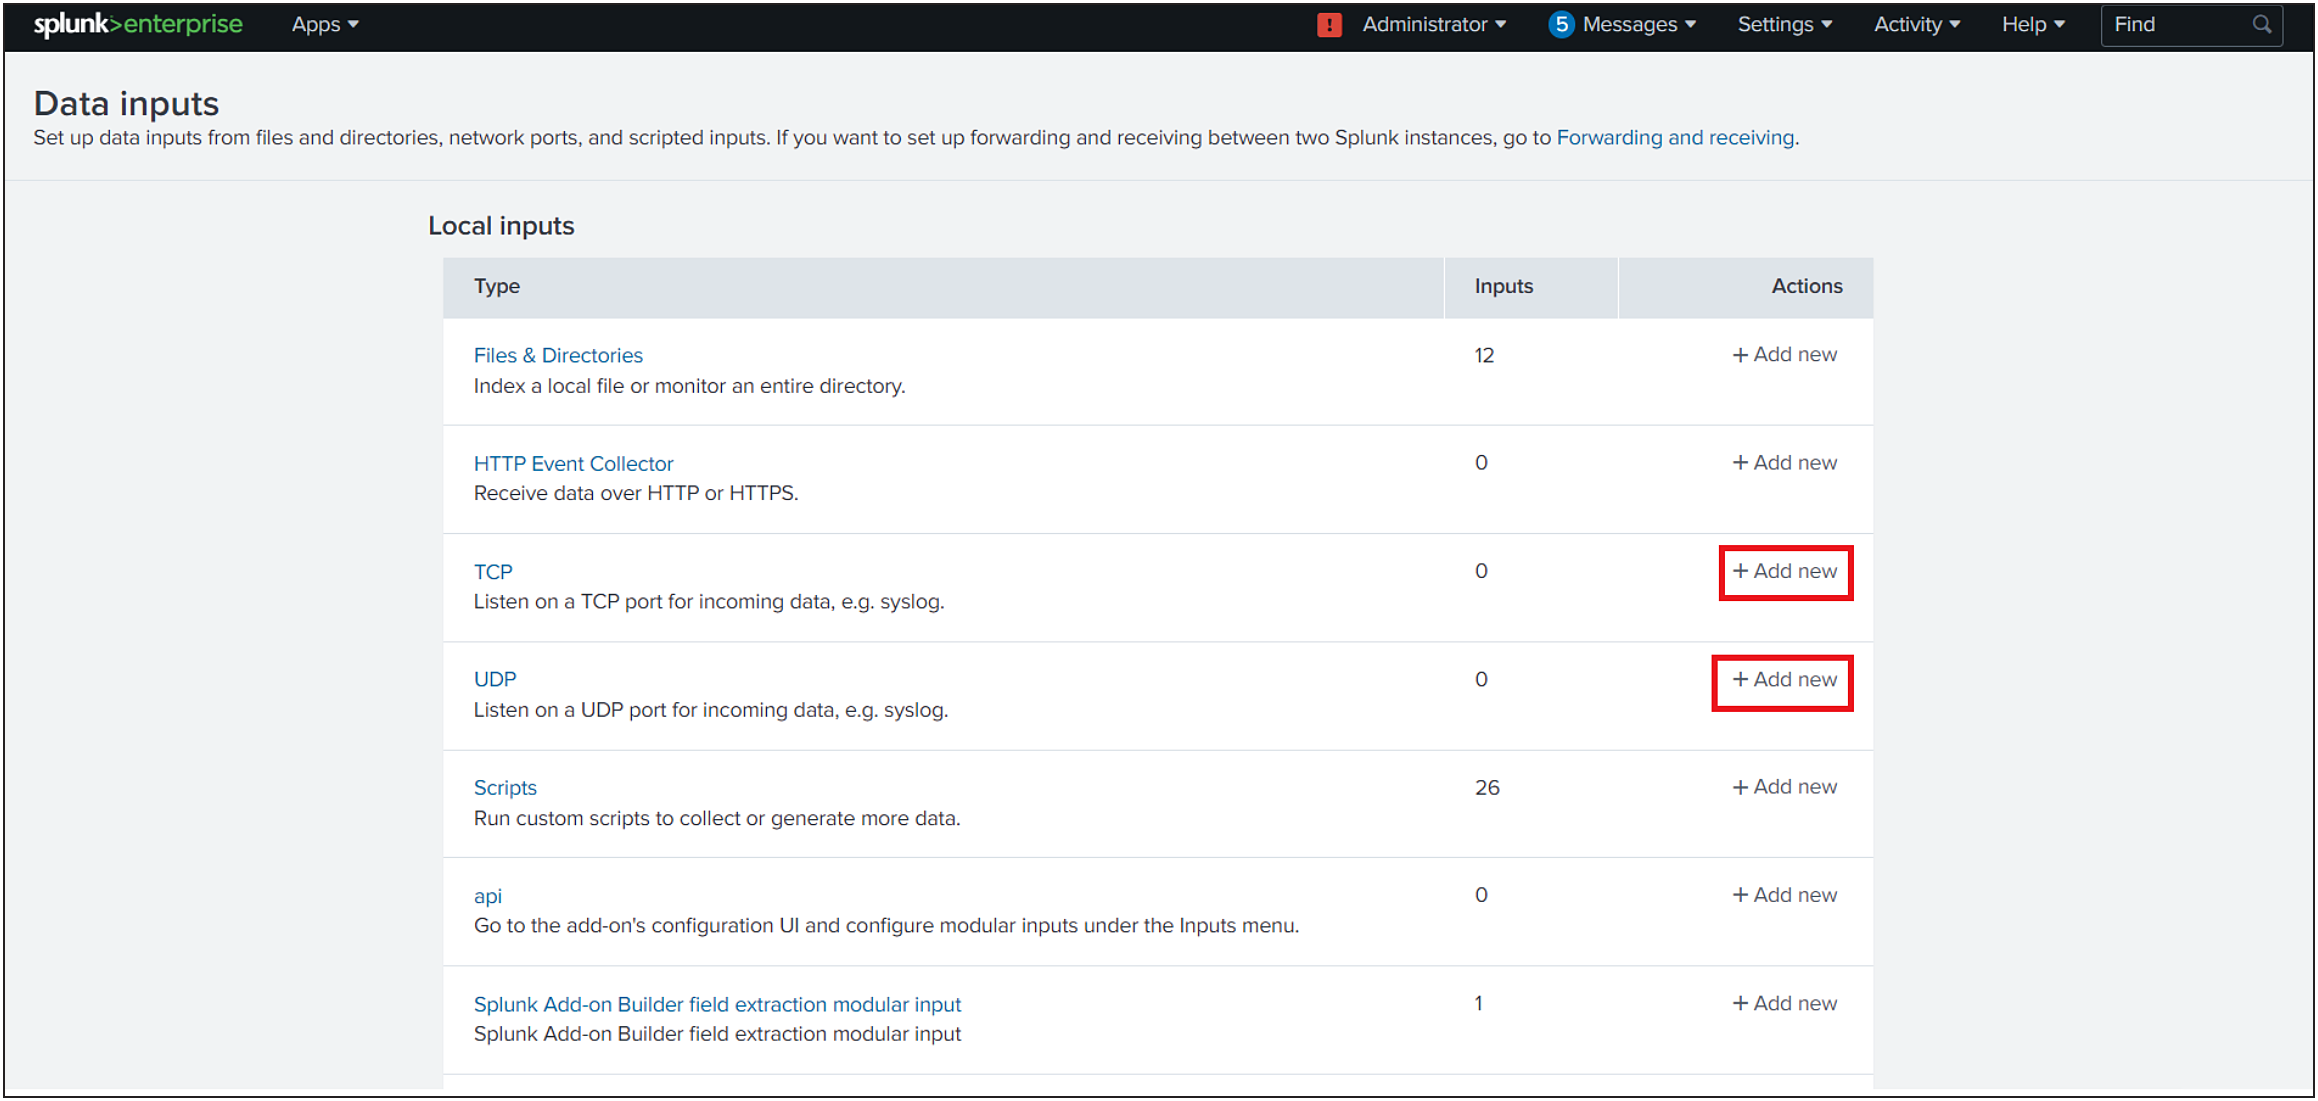
4. In the left pane, click TCP / UDP to add an input.
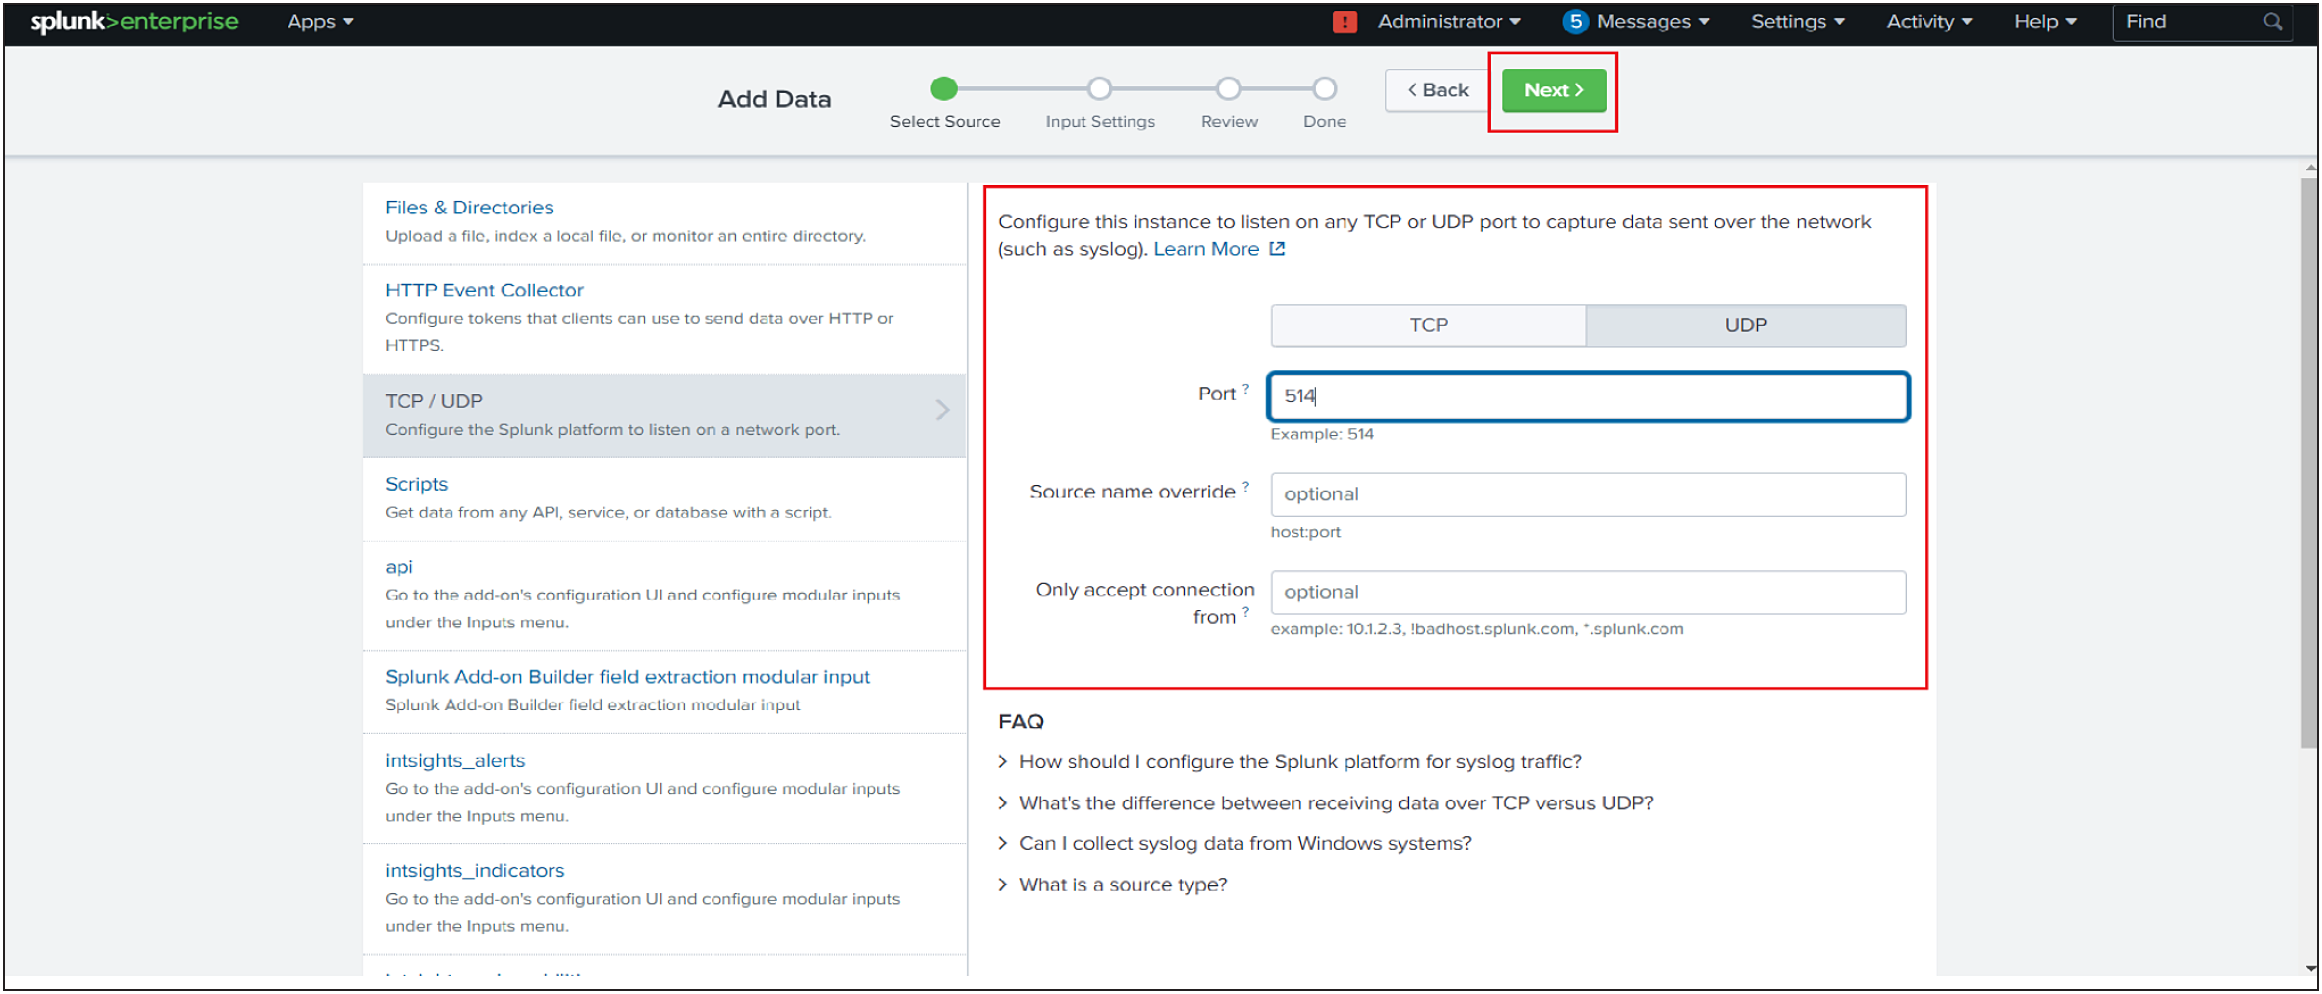
5. Click the TCP or UDP button to choose between a TCP or UDP input.
6. In the Port field, enter a port number on which you are forwarding the logs from Cisco SD-WAN.
7. In the Source name override field, enter a new source name to override the default source value, if necessary.
8. Click Next to continue to the Input Settings page.
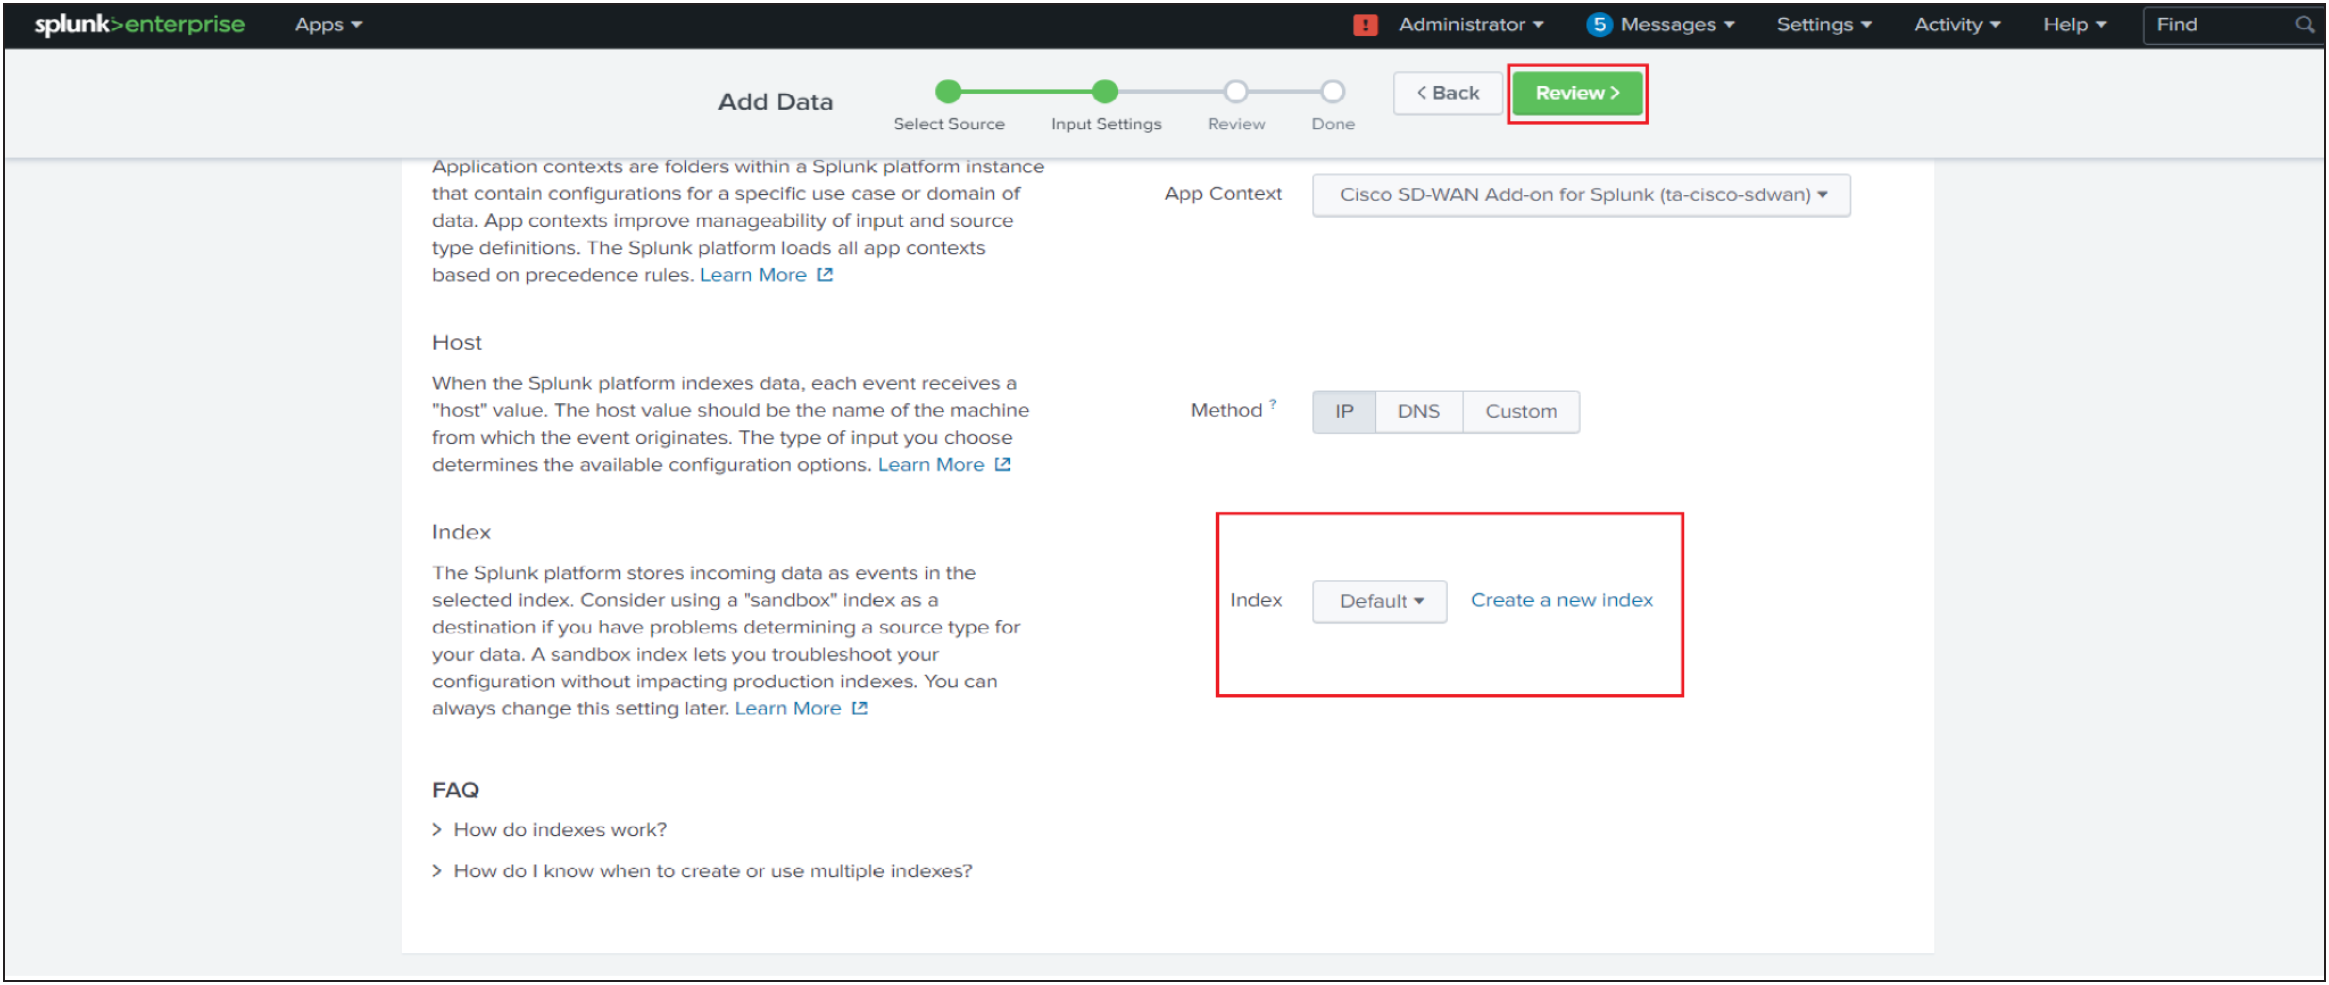
9. Set the sourcetype as cisco:firewall:logs.
10. Set App context to Cisco SD-WAN Add-on.
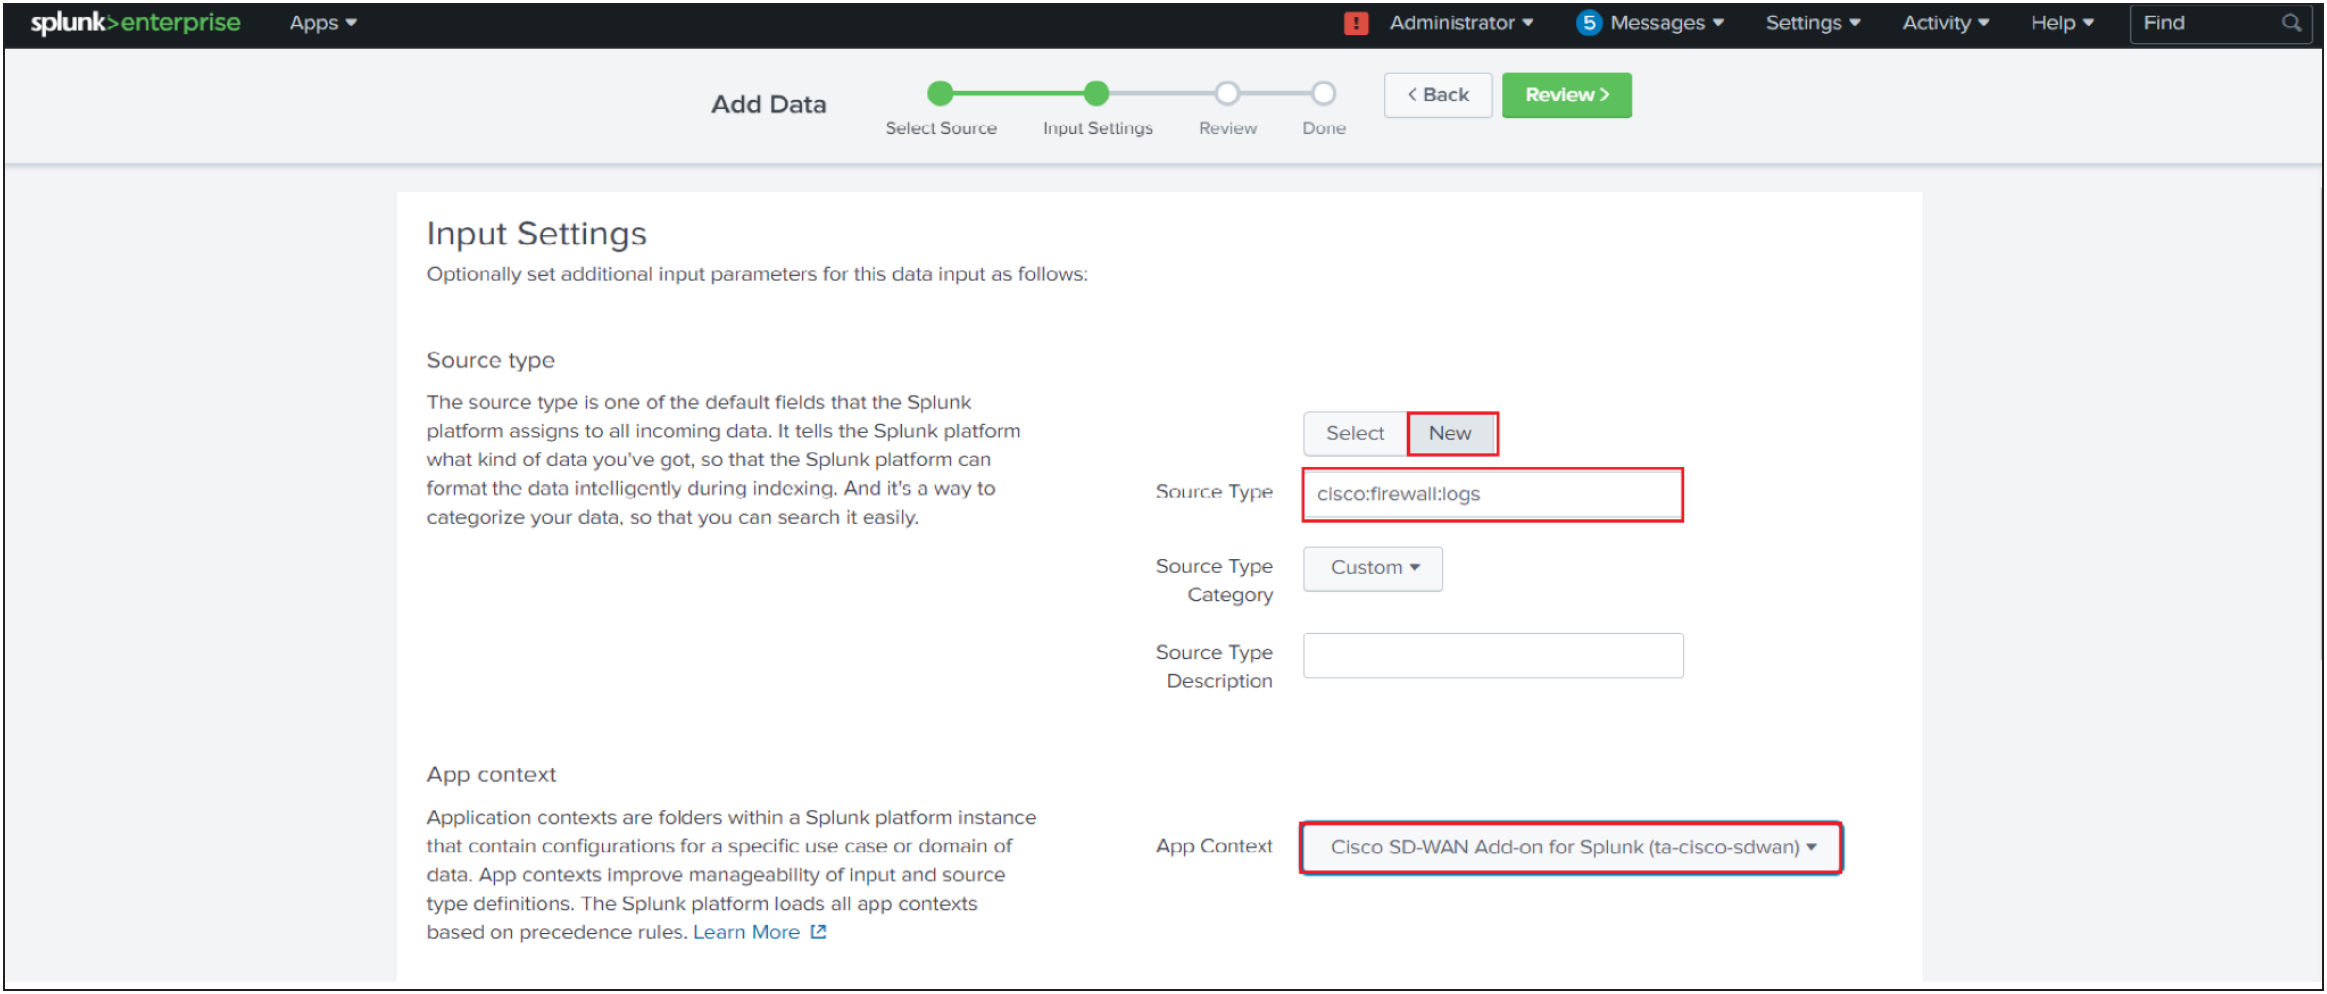
11. Set the Index that Splunk Enterprise should send data to for this input
12. Click Review.
13. Click Submit once you have ensured everything is correct.
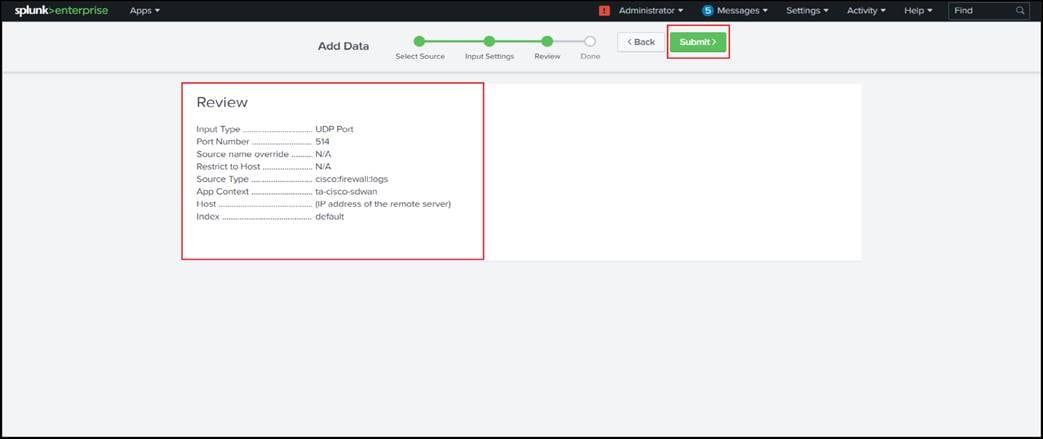
Once the input is configured, execute the following query to see if Syslog events are being received.
index=<configured_index> sourcetype="cisco:sdwan"
Configure Inputs on Splunk for Netflow Data
Steps to follow:
1. Once the "Splunk App for Stream" & "Splunk Add-on for Stream Forwarders" is installed in the desired Splunk Instance.
2. Open "Splunk App for Stream" > Click on "Configuration" > Click on "Configure Streams"
3. In the "Search" filter search for the keyword "netflow".
4. For "netflow" stream > Goto "Action" > "Edit"
5. Update the "Mode" to "Enabled" & select the desired index, by default "main" will be selected.
6. Click on Save.
7. SSH into the Destination VM example VM: x.x.x.x (should be replaced with the VM in which data is been collected)
8. Goto Location: $SPLUNK_HOME/etc/apps/Splunk_TA_stream/local
9. Create a "streamfwd.conf" in the "local" folder Sample format of 'streamfwd.conf' as below:
```
[streamfwd]
netflowReceiver.<N>.ip = <ip_address>
netflowReceiver.<N>.port = <port_number>
netflowReceiver.<N>.decoder = <flow_protocol>
```
Below is an example file for the ip x.x.x.x and port 4739:
```
[streamfwd]
netflowReceiver.0.ip = x.x.x.x
netflowReceiver.0.port = 4739
netflowReceiver.0.decoder = netflow
```
10. Save the changes.
11. All the NetFlow events will get ingested in the Destination VM: x.x.x.x (should be replaced with the VM in which data is been collected)
12. Verify the ingestion of events by using the following query from the "Destination VM: x.x.x.x" (should be replaced with the VM in which data is been collected)
◦ index="<desired index name>" sourcetype="stream*"
Note: Refer to the documentation for setting up a new Netflow stream.
Configure Event Types on Splunk Search Head Instance
To use the CIM mapped fields, a user first needs to configure the event type to provide the index in which the data is being collected. To configure event type:
● Navigate to Settings > Event types.
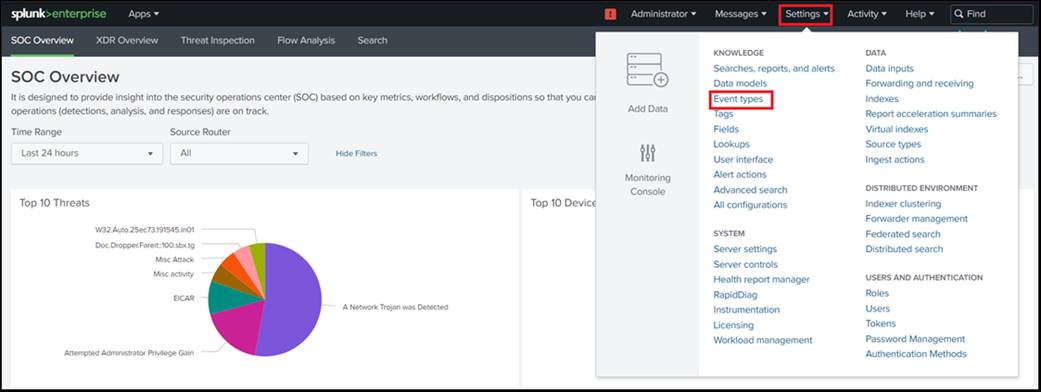
● Select "Cisco SD-WAN Add-on for Splunk" from the App dropdown.

● Click on "cisco_sdwan_index".
● Update "()" with "index=<your_configured_index>" in the existing definition to use your configured index.
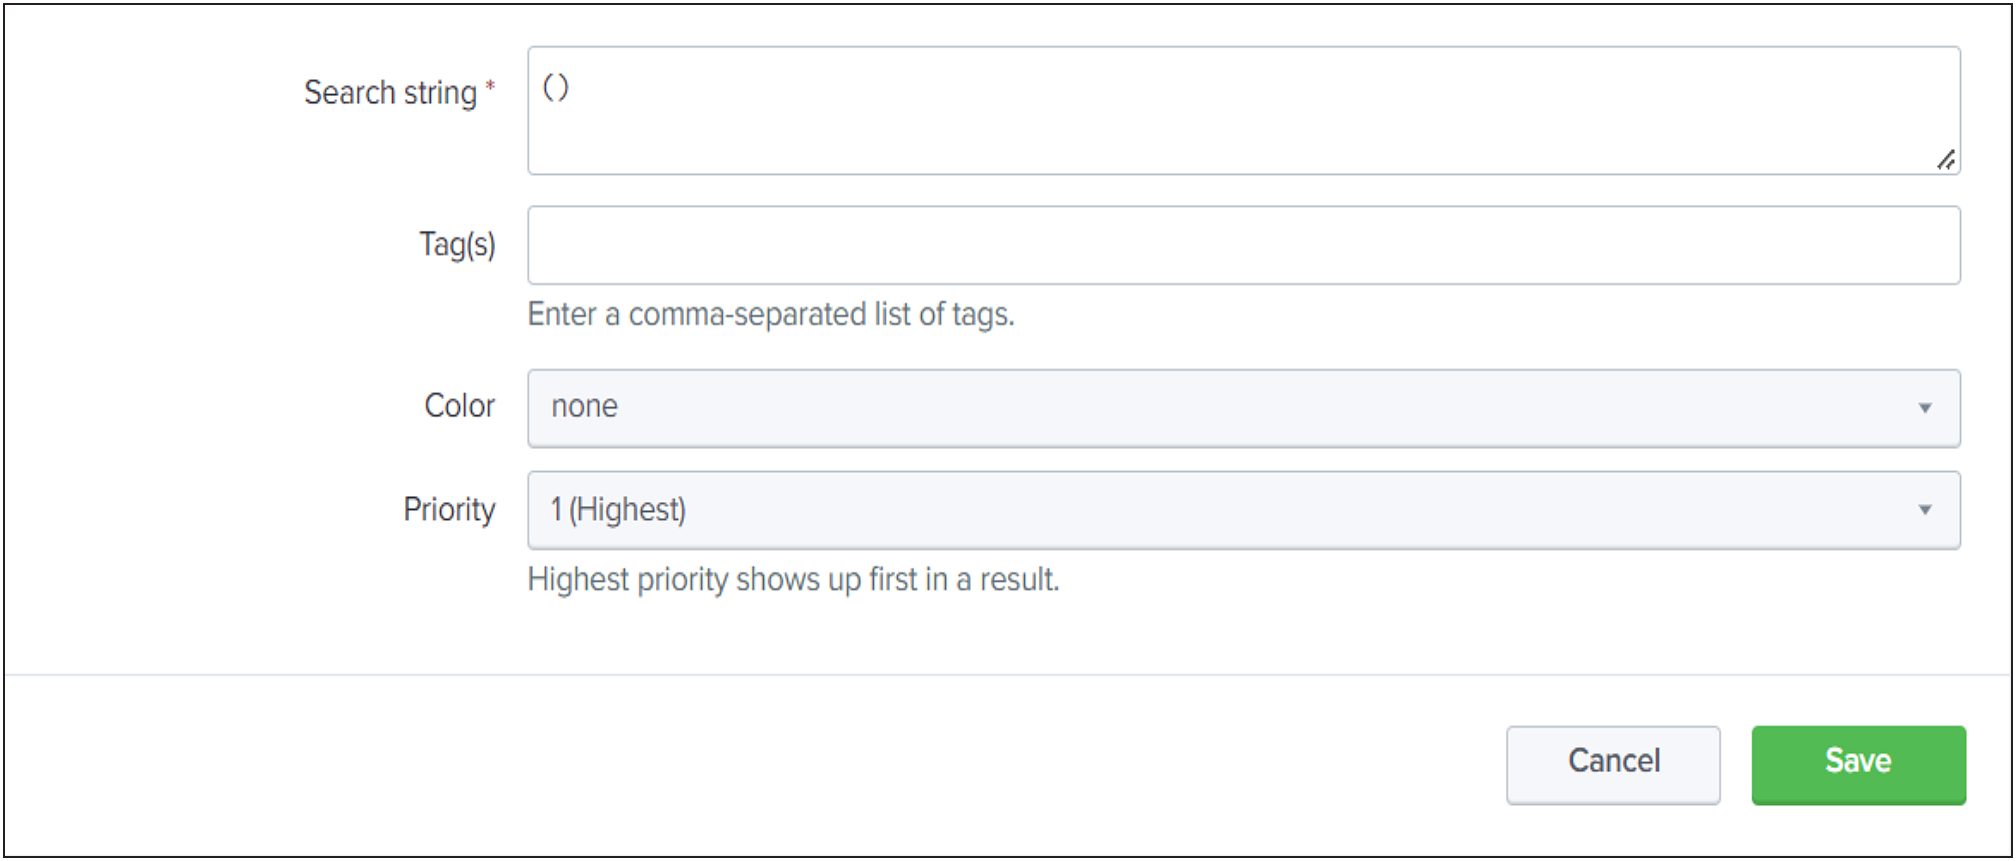
● Click Save.
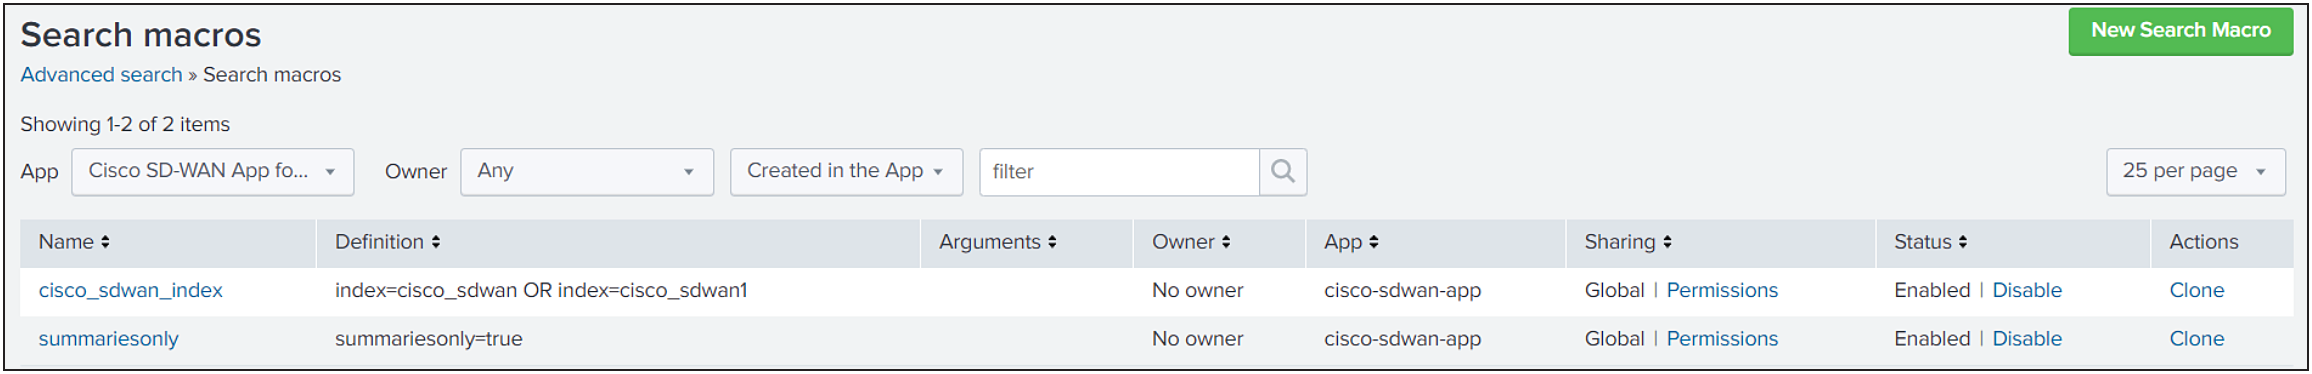
Macros
● cisco_sdwan_index
◦ If you are using a custom index in Add-on for data collection then kindly update the "cisco_sdwan_index" macro in the app.
● summariesonly:
◦ If you want to visualize only accelerated data then change this macro to “summariesonly=true”, the Default value of the macro is “summariesonly=false”
● nataddress_regular:
◦ Definition for the extracted NAT addresses to convert them to ipv4 addresses.
● nataddress_datamodel:
◦ Definition for the extracted NAT addresses to convert them to ipv4 addresses in datamodel.
Data Model
● The app consists of Two data models "Cisco SDWAN" for Syslog data and "Cisco SDWAN Netflow" for NetFlow data:
◦ Cisco_SDWAN - Maps Syslog data based on different log types.
◦ Cisco_SDWAN_NETFLOW - Maps NetFlow data from Cisco SDWAN
● The acceleration for the data model is disabled by default.
● As all the dashboards are populated using data model queries and real-time search doesn't work with the data model, all the real-time search filters are disabled.
● If you want to improve the performance of dashboards, you just need to enable the acceleration of the data model. Please follow the below steps:
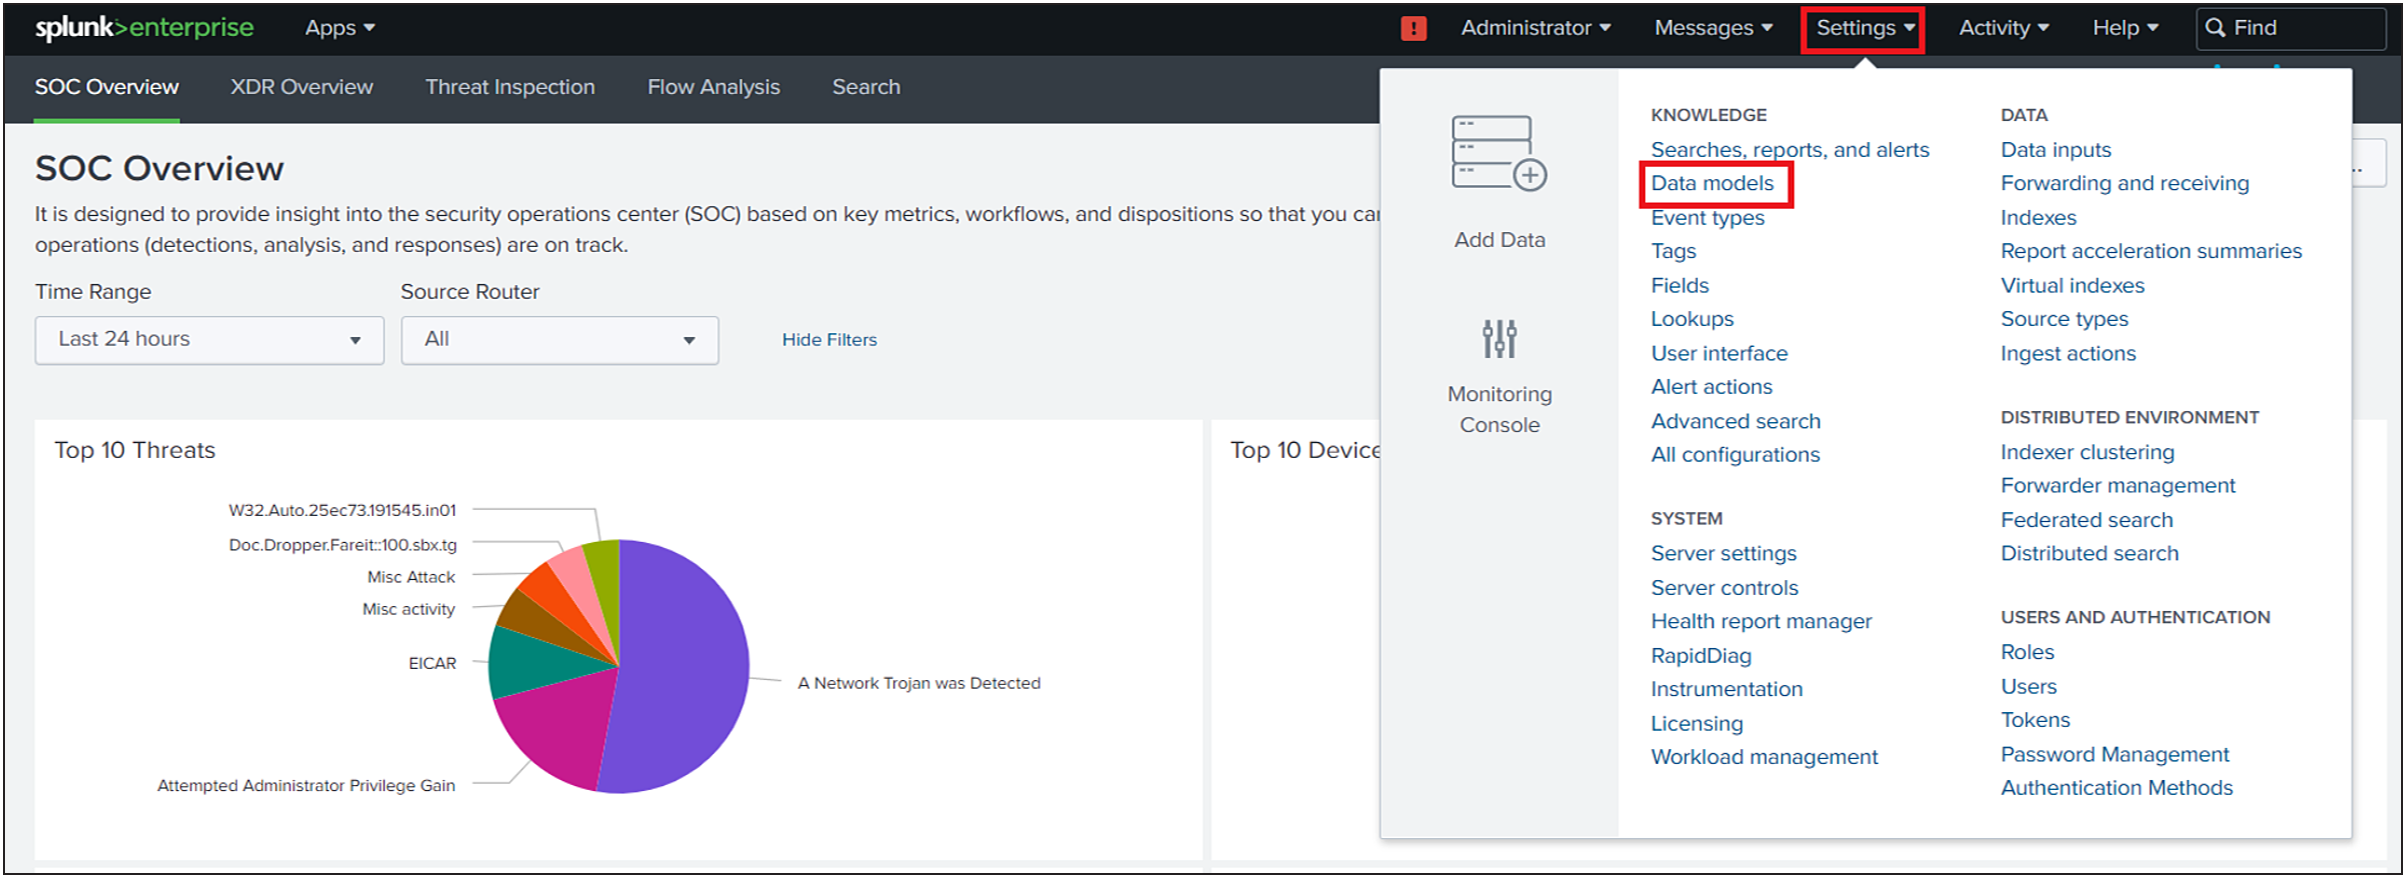
◦ On the Splunk menu bar, Click on Settings -> Data models
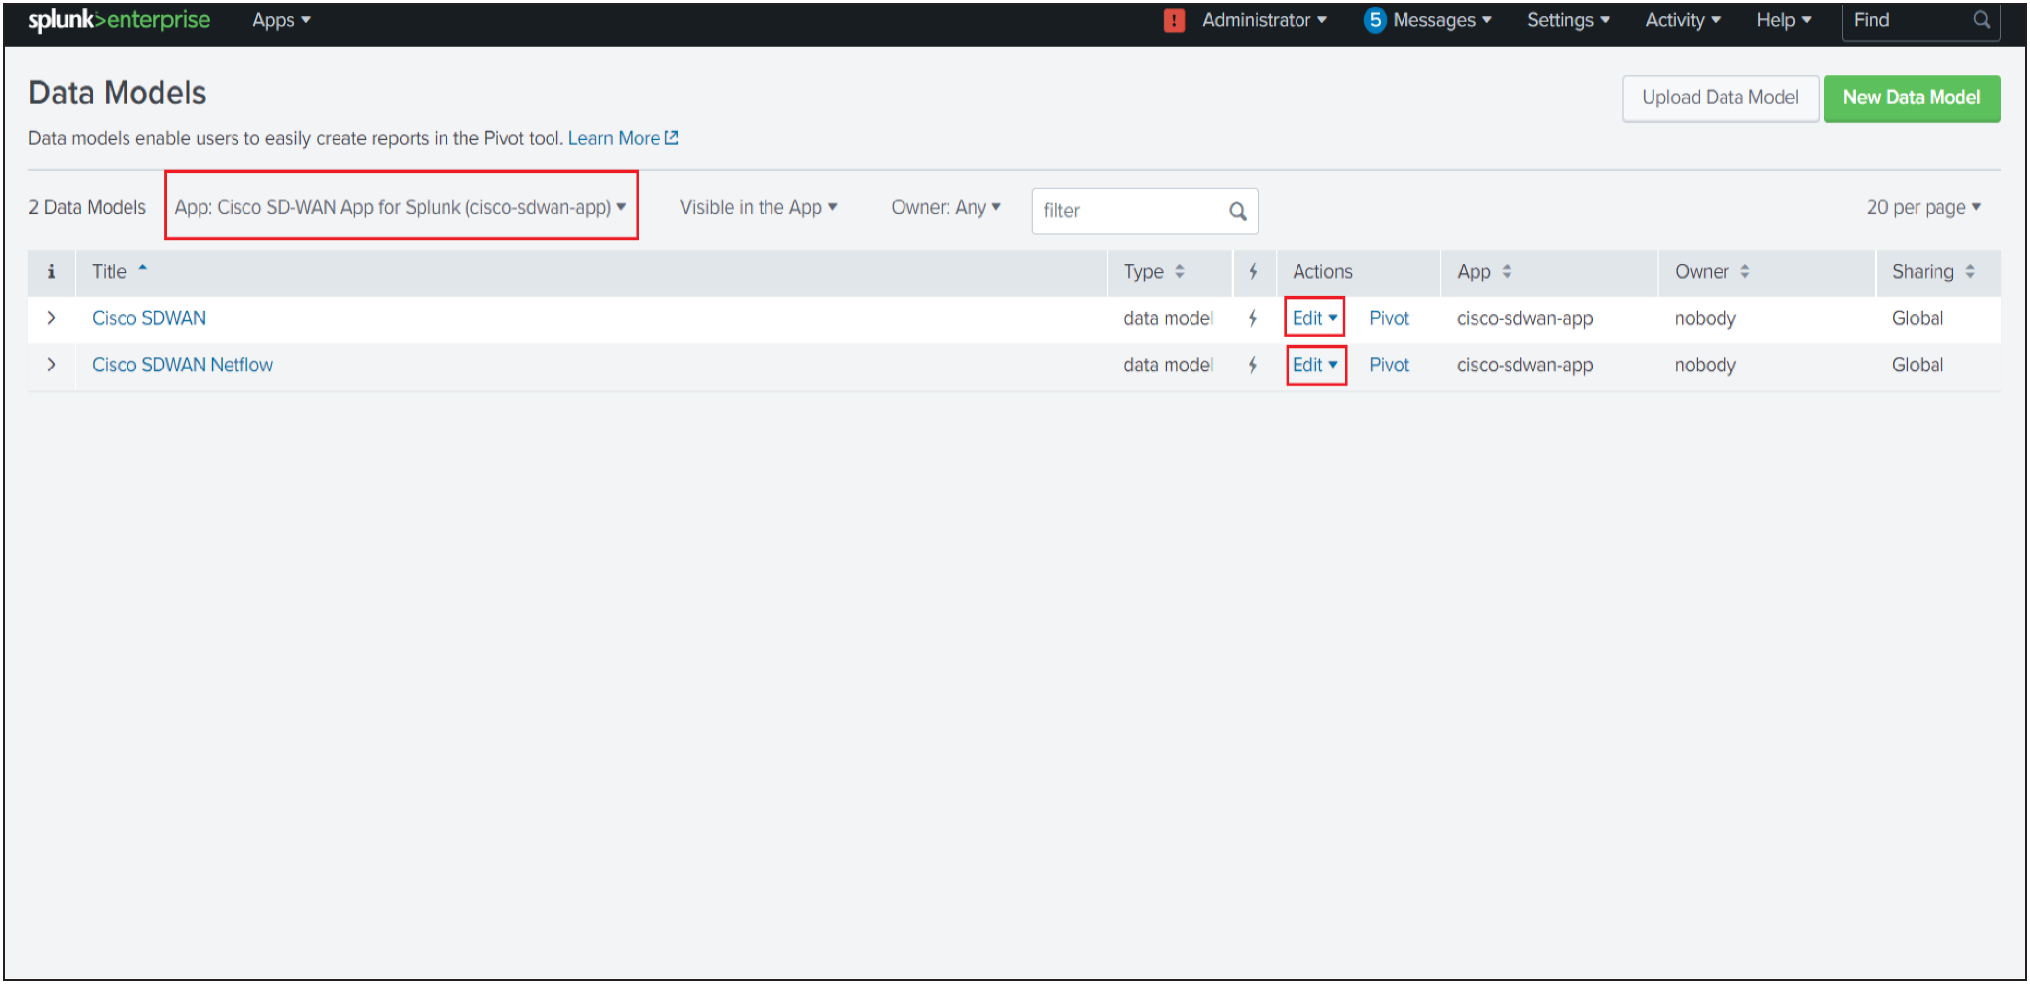
◦ Select "Cisco SDWAN App for Splunk" in the "App" context dropdown.
◦ In the "Actions" column, click on Edit and click Edit Acceleration for the "Cisco SDWAN" Data model. This will display the pop-up menu for Edit Acceleration.
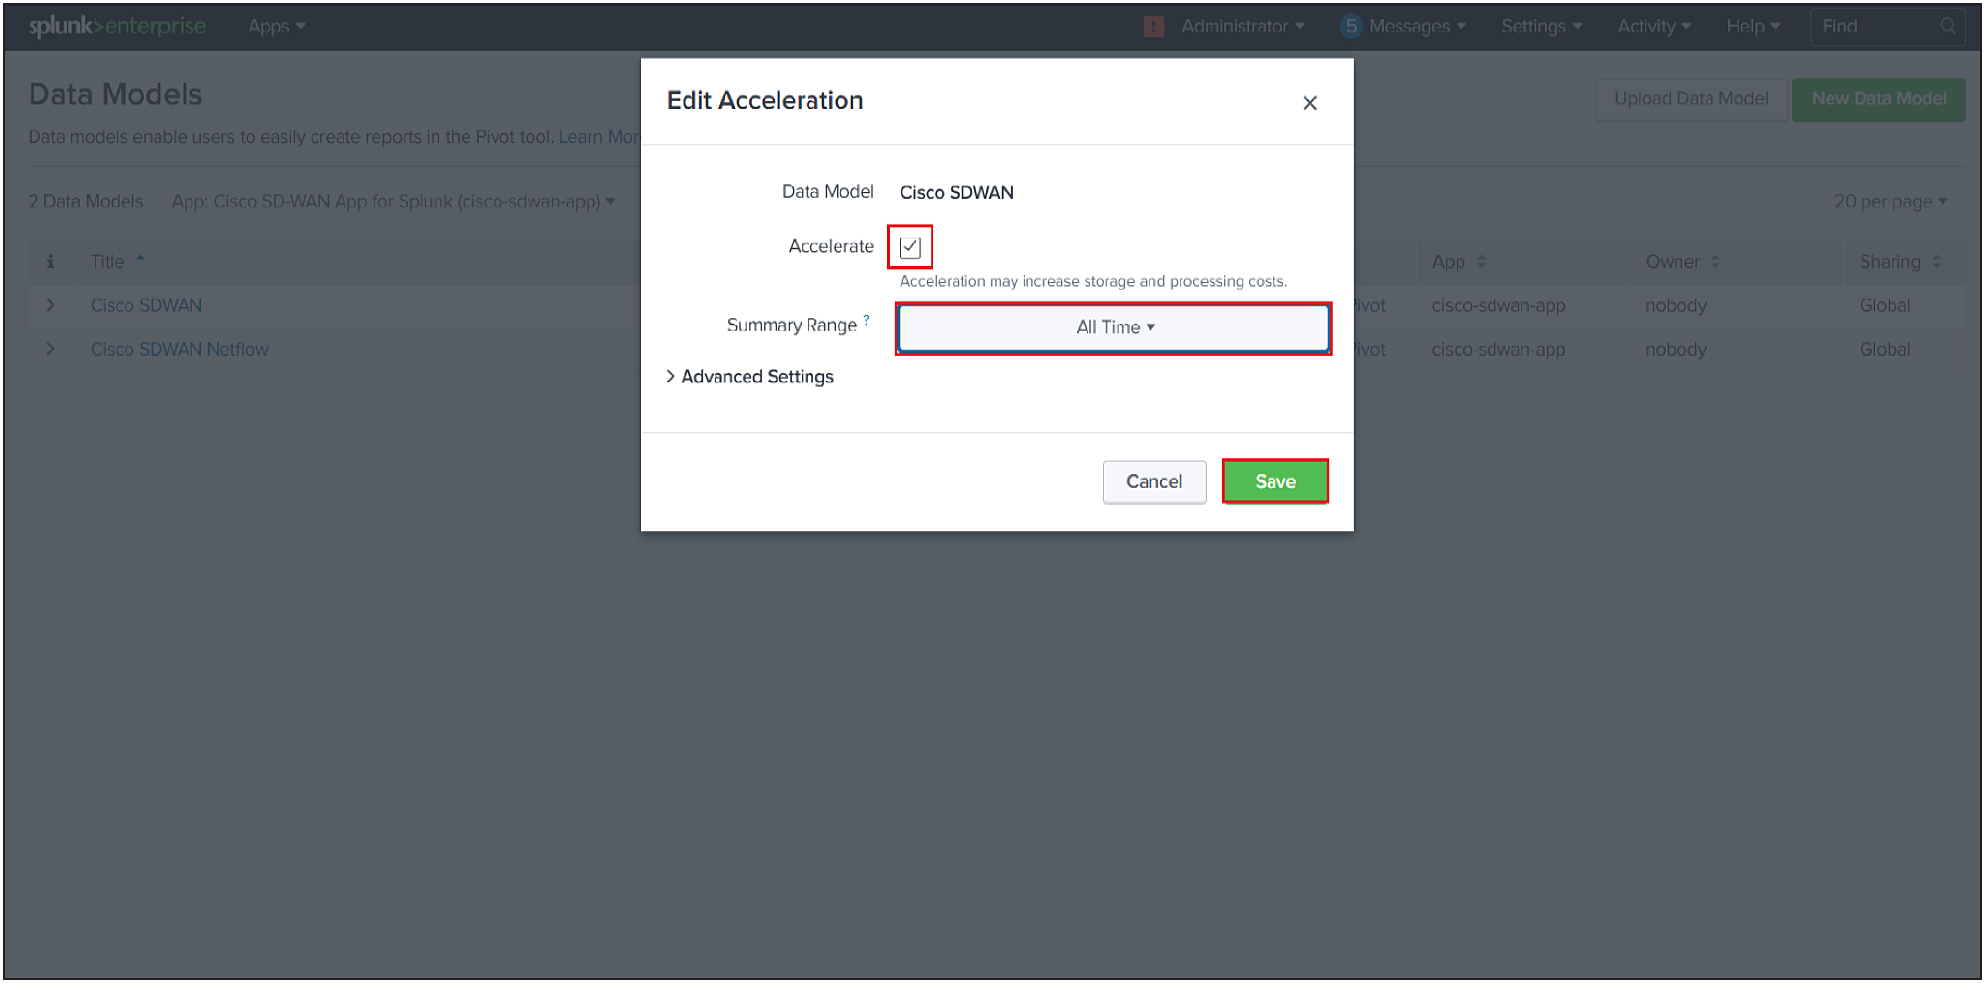
◦ Check or uncheck Accelerate checkbox to "Enable" or "Disable" data model acceleration respectively.
◦ If acceleration is enabled, select the summary range to specify the acceleration period. The recommended acceleration period is 7 days. The acceleration period can be changed as per user convenience.
◦ To save acceleration changes click on the Save button.
◦ Follow the Similar Steps to Enable/Disable Acceleration Cisco_SDWAN_Netflow Data model
● Warning: The accelerated data models help in improving the performance of the dashboard but it increases the disk usage on the Indexer.
Dashboards
SOC Dashboard
Description
It is designed to provide insight into the security operations center (SOC) based on key metrics, workflows, and dispositions so that you can monitor the efficiency of the SOC and ensure that all security operations (detections, analysis, and responses) are on track.
The dashboard will consist of the below-mentioned panels
Screenshot
Panels
The Dashboard should have the below panels:
1. Top 10 Threats
◦ Description: This panel displays a Pie chart for Top 10 Threats
◦ Chart Type: Pie Chart
◦ Chart Filter: Shared Time Range Picker, Source Router
◦ Drilldown (on click): Inline Threat Details Panel
◦ Sourcetype: cisco:sdwan:utd:logs
2. Threat Details For a Particular Threat
◦ Description: This panel displays a details for particular threat
◦ Chart Type: Tabular view
◦ Chart Filter: Shared Time Range Picker, Source Router, Device IP, Device Name, Action, Source IP, Source Port, Destination IP, Destination Port
◦ Drilldown (on click): To raw events
◦ Sourcetype: cisco:sdwan:utd:logs
3. Top 10 Devices By Threat
◦ Description: This panel displays a Pie chart Top 10 Devices by threat
◦ Chart Type: Pie Chart
◦ Chart Filter: Shared Time Range Picker, Source Router, Device IP, Device Name, Action, Source IP, Source Port, Destination IP, Destination Port
◦ Drilldown (on click): Inline Device Details Panel
◦ Sourcetype: cisco:sdwan:utd:logs
4. Device Details for a Particular Device
◦ Description: This panel displays a details for particular Device
◦ Chart Type: Tabular view
◦ Chart Filter: Shared Time Range Picker, Source Router, Source IP, Source Port, Destination IP, Destination Port
◦ Drilldown (on click): To raw events
◦ Sourcetype: cisco:sdwan:utd:logs
5. Top 10 Application
◦ Description: This panel displays the top 10 applications with their count
◦ Chart Type: Tabular View
◦ Chart Filter: Shared Time Range Picker,Source Router
◦ Drilldown (on click): Inline Application Detail Panel
◦ Sourcetype: stream:netflow
6. Application Details for a Particular Application
◦ Description: This panel displays a details for particular Application
◦ Chart Type: Tabular view
◦ Chart Filter: Shared Time Range Picker, Source Router, Source IP, Source Port, Destination IP, Destination Port, Input Snmpidx, Output Snmpidx
◦ Drilldown (on click): To raw events
◦ Sourcetype: stream:netflow
7. Top 10 Policy Hits
◦ Description: This panel displays the top 10 Policy Hits with their count
◦ Chart Type: Tabular View
◦ Chart Filter: Shared Time Range Picker,Source Router
◦ Drilldown (on click): Inline Policy Details Panel,
◦ Sourcetype: stream:netflow
8. Policy Details for a Particular Policy
◦ Description: This panel displays a details for particular Policy
◦ Chart Type: Tabular view
◦ Chart Filter: Shared Time Range Picker, Source Router, Action, Source IP, Source Port, Destination IP, Destination Port, Input Snmpidx, Output Snmpidx
◦ Drilldown (on click): To raw events
◦ Sourcetype: stream:netflow
9. Total Connection Flows by Host Over Time
◦ Description: This panel displays a timechart for the top All connections
◦ Chart Type: Line Chart
◦ Chart Filter: Shared Time Range Picker, Source Router, Host, Target, Class
◦ Drilldown (on click): To raw events
◦ Sourcetype: cisco:sdwan:host:tcp:alert:on
10. Unblocked connections
◦ Description: This panel displays a single value count of a total number of unblocked connection
◦ Chart Type: Single Value
◦ Chart Filter: Shared Time Range Picker, Source Router, Target, Class
◦ Drilldown (on click): To panel unblocked connections by hosts
◦ Sourcetype: cisco:sdwan:unblock:host
11. Unblocked connections by unblock hosts
◦ Description: This panel displays a table of unblocked connections by unblocked hosts with their count
◦ Chart Type: Tabular view
◦ Chart Filter: Shared Time Range Picker, Source Router, Target, Class
◦ Drilldown (on click): To raw events for selected unblocked host
◦ Sourcetype: cisco:sdwan:unblock:host
12. Half opened connections
◦ Description: This panel displays a single value count of a total number of half opened connection
◦ Chart Type: Single Value
◦ Chart Filter: Shared Time Range Picker, Source Router, Target, Class
◦ Drilldown (on click): To Half opened connections by half opened hosts panel
◦ Sourcetype: cisco:sdwan:host:tcp:alert:on
13. Half opened connections by half opened hosts
◦ Description: This panel displays a table of half opened connections by half opened hosts with their count
◦ Chart Type: Tabular view
◦ Chart Filter: Shared Time Range Picker, Source Router, Target, Class
◦ Drilldown (on click): To raw events for selected half opened host
◦ Sourcetype: cisco:sdwan:host:tcp:alert:on
14. Blocked connections
◦ Description: This panel displays a single value count of a total number of blocked connections
◦ Chart Type: Single Value
◦ Chart Filter: Shared Time Range Picker, Source Router, Target, Class
◦ Drilldown (on click): To raw events
◦ Sourcetype: cisco:sdwan:block:host
15. Blocked connections by blocked hosts
◦ Description: This panel displays a table of blocked connections by blocked hosts with their count
◦ Chart Type: Tabular view
◦ Chart Filter: Shared Time Range Picker, Source Router, Target, Class
◦ Drilldown (on click): To raw events for selected blocked host
◦ Sourcetype: cisco:sdwan:host:tcp:alert:on
16. Dropped ZBFW Flows – ADD THE HIGHLIGHTED TEXT FROM #28- #31 UNDER PANELS
◦ Description: This panel displays a table of dropped ZBFW flows between source ip and destination ip with their total count
◦ Chart Type: Tabular view
◦ Chart Filter: Shared Time Range Picker, Source Router, Target, Class
◦ Drilldown (on click): Panel for dropped flow details between source ip and destination ip
◦ Sourcetype: stream:netflow
17. Dropped ZBFW Flows between Source IP and Destination IP
◦ Description: This panel displays a table of all the dropped ZBFW flows between source ip and destination ip
◦ Chart Type: Tabular view
◦ Chart Filter: Shared Time Range Picker, Source Router, Target, Class
◦ Drilldown (on click): To raw event
◦ Sourcetype: stream:netflow
18. Inspected ZBFW Flows
◦ Description: This panel displays a table of inspected ZBFW flows between source ip and destination ip with their total count
◦ Chart Type: Tabular view
◦ Chart Filter: Shared Time Range Picker, Source Router, Target, Class
◦ Drilldown (on click): Panel for inspected flow details between source ip and destination ip
◦ Sourcetype: stream:netflow
19. Inspected ZBFW Flows between Source IP and Destination IP
◦ Description: This panel displays a table of all the inspected ZBFW flows between source ip and destination ip
◦ Chart Type: Tabular view
◦ Chart Filter: Shared Time Range Picker, Source Router, Target, Class
◦ Drilldown (on click): To raw event
◦ Sourcetype: stream:netflow
XDR Dashboard
Description
Extended detection and response (XDR) delivers visibility into data across networks, clouds, endpoints, and applications while applying analytics and automation to detect, analyze, hunt, and remediate today's and tomorrow's threats.
Screenshot
Panels
The Dashboard should have the below panels:
1. Number Of Platform Errors
◦ Description: This panel displays a single value count of a total number of platform errors
◦ Chart Type: Single Value
◦ Chart Filter: Shared Time Range Picker, Source Router
◦ Drilldown (on click): To raw events
◦ Sourcetype: cisco:sdwan:smart:lic:platform:error
2. Number Of Engine Write Fails
◦ Description: This panel displays a single value count of a total number of engine write fail
◦ Chart Type: Single Valued
◦ Chart Filter: Shared Time Range Picker, Source Router
◦ Drilldown (on click): To raw events
◦ Sourcetype: cisco:sdwan:dmi:cli:engine:write:fail
3. Alerts On - Today (with 7 days Trend)
◦ Description: This panel displays a single value count of a total number of Alert on in last 24 hours with last month trend
◦ Chart Type: Single Value
◦ Chart Filter: Use Time Picker, Source Router, Target, Class
◦ Drilldown (on click): To raw events
◦ Sourcetype: cisco:sdwan:alert:on
4. Alerts Off - Today (with 7 days Trend)
◦ Description: This panel displays a single value count of a total number of Alert off in last 24 hours with last month trend
◦ Chart Type: Single Value
◦ Chart Filter: Use Time Picker, Source Router, Target, Class
◦ Drilldown (on click): To raw events
◦ Sourcetype: cisco:sdwan:alert:off
5. Session Exceeded Over Time
◦ Description: This panel displays a timechart for the count of session exceeded in 1d span
◦ Chart Type: Line Chart
◦ Chart Filter: Shared Time Range Picker, Source Router, Target, Class
◦ Drilldown (on click): To raw events
◦ Sourcetype: cisco:sdwan:sessions:maximum
6. Top 10 Source IPs
◦ Description: This panel displays a tabular view of top 10 Source IP and no. of requests
◦ Chart Type: Tabular View
◦ Chart Filter: Shared Time Range Picker, Source Router, Target, Class
◦ Drilldown (on click): To raw events
◦ Sourcetype: cisco:sdwan:session:audit:trail:start
7. Top 10 Destination IPs
◦ Description: This panel displays a tabular view of top 10 Destination IP and no. of requests
◦ Chart Type: Tabular View
◦ Chart Filter: Shared Time Range Picker, Source Router, Target, Class
◦ Drilldown (on click): To raw events
◦ Sourcetype: cisco:sdwan:session:audit:trail:start
8. Top 10 Pairs Of Source and Destination IPs
◦ Description: This panel displays a tabular view of top 10 Source IP and Destination IP combination and no. of requests
◦ Chart Type: Tabular View
◦ Chart Filter: Shared Time Range Picker, Source Router, Target, Class
◦ Drilldown (on click): To raw events
◦ Sourcetype: cisco:sdwan:session:audit:trail:start
9. Top 10 Initiator by Traffic
◦ Description: This panel displays a tabular view of top 10 Source IP and its traffic
◦ Chart Type: Tabular View
◦ Chart Filter: Shared Time Range Picker, Source Router, Target, Class
◦ Drilldown (on click): To raw events
◦ Sourcetype: cisco:sdwan:session:audit:trail
10. Top 10 Responder by Traffic
◦ Description: This panel displays a tabular view of top 10 Destination IP and its traffic
◦ Chart Type: Tabular View
◦ Chart Filter: Shared Time Range Picker, Source Router, Target, Class
◦ Drilldown (on click): To raw events
◦ Sourcetype: cisco:sdwan:session:audit:trail
Threat Inspection Dashboard
Description
Provide tactical guidance and insights to detect, investigate and respond to the latest threats.
Screenshot
Panels
The Dashboard should have the below panels:
1. Blocked Connections Over IPS event
◦ Description: This panel displays pie chart for blocked calls by classification
◦ Chart Type: Pie Chart
◦ Chart Filter: Shared Time Range Picker, Source Router
◦ Drilldown (on click): Inline Classification Details Panel
◦ Sourcetype: cisco:sdwan:utd:logs
2. Classification Details for a Particular IPS
◦ Description: This panel displays a details for particular IPS
◦ Chart Type: Tabular view
◦ Chart Filter: Shared Time Range Picker, Source Router, Device IP, Device Name, Action, Source IP, Source Port, Destination IP, Destination Port
◦ Drilldown (on click): To raw events
◦ Sourcetype: cisco:sdwan:utd:logs
3. Malicious Files by Malware
◦ Description: This panel displays pie chart for Malicious files by malware
◦ Chart Type: Pie Chart
◦ Chart Filter: Shared Time Range Picker, Source Router
◦ Drilldown (on click): Inline Malware Detail Panel
◦ Sourcetype: cisco:sdwan:utd:logs
4. Malware Details for a Particular Malware
◦ Description: This panel displays a details for particular Filetype
◦ Chart Type: Tabular view
◦ Chart Filter: Shared Time Range Picker, Source Router, Device IP, Device Name, Action, Source IP, Source Port, Destination IP, Destination Port
◦ Drilldown (on click): To raw events
◦ Sourcetype: cisco:sdwan:utd:log
5. Malicious Files by Type
◦ Description: This panel displays pie chart for Malicious files by type
◦ Chart Type: Pie Chart
◦ Chart Filter: Shared Time Range Picker, Source Router
◦ Drilldown (on click): Inline Filetype Detail Panel
◦ Sourcetype: cisco:sdwan:utd:logs
6. Filetype Detail for a Particular filetype
◦ Description: This panel displays a details for particular Filetype
◦ Chart Type: Tabular view
◦ Chart Filter: Shared Time Range Picker, Source Router, Device IP, Device Name, Action, Source IP, Source Port, Destination IP, Destination Port
◦ Drilldown (on click): To raw events
◦ Sourcetype: cisco:sdwan:utd:logs
7. File Scan Results by Disposition
◦ Description: This panel displays pie chart for Malicious files by disposition
◦ Chart Type: Pie Chart
◦ Chart Filter: Shared Time Range Picker, Source Router
◦ Drilldown (on click): Inline UTD Amp Disposition Details Panel
◦ Sourcetype: cisco:sdwan:utd:logs
8. UTD Amp Disposition Details for a Particular Malware
◦ Description: This panel displays a details for particular Filetype
◦ Chart Type: Tabular view
◦ Chart Filter: Shared Time Range Picker, Source Router, Device IP, Device Name, Action, Source IP, Source Port, Destination IP, Destination Port
◦ Drilldown (on click): To raw events
◦ Sourcetype: cisco:sdwan:utd:logs
9. Malicious Files
◦ Description: This panel displays table of Malicious files by Filename, Filetype, Malware, UTD AMP Disposition
◦ Chart Type: Tabular view
◦ Chart Filter: Shared Time Range Picker, Source Router
◦ Drilldown (on click): To raw events
◦ Sourcetype: cisco:sdwan:utd:logs
10. Blocked Connections over category
◦ Description: This panel displays pie chart for blocked calls by category
◦ Chart Type: Pie Chart
◦ Chart Filter: Shared Time Range Picker, Source Router
◦ Drilldown (on click): Inline Url Details for Category Panel
◦ Sourcetype: cisco:sdwan:utd:logs
11. Url Details for Category for a Particular Category
◦ Description: This panel displays a details for url details with its Reputation for particular category
◦ Chart Type: Tabular view
◦ Chart Filter: Shared Time Range Picker, Source Router
◦ Drilldown (on click): Inline url detail panel
◦ Sourcetype: cisco:sdwan:utd:logs
12. Url Details for a Particular Url
◦ Description: This panel displays a details for particular url
◦ Chart Type: Tabular view
◦ Chart Filter: Shared Time Range Picker, Source Router, Device IP, Device Name, Action, Source IP, Source Port, Destination IP, Destination Port
◦ Drilldown (on click): To raw events
◦ Sourcetype: cisco:sdwan:utd:logs
13. Blocked Connections over urls
◦ Description: This panel displays the blocked calls by urls with their count
◦ Chart Type: Pie chart
◦ Chart Filter: Shared Time Range Picker, Source Router, URL
◦ Drilldown (on click): Inline Url Details Panel
◦ Sourcetype: cisco:sdwan:utd:logs
14. Url Details for a Particular Url
◦ Description: This panel displays a details for particular url
◦ Chart Type: Tabular view
◦ Chart Filter: Shared Time Range Picker, Source Router, Device IP, Device Name, Action, Source IP, Source Port, Destination IP, Destination Port
◦ Drilldown (on click): To raw events
◦ Sourcetype: cisco:sdwan:utd:logs
15. URL Reputation
◦ Description: This panel displays the table of the worst reputed urls with their reputation
◦ Chart Type: Tabular view
◦ Chart Filter: Shared Time Range Picker, Source Router, URL
◦ Drilldown (on click): To raw events
◦ Sourcetype: cisco:sdwan:utd:logs
16. Blocked Connections over source
◦ Description: This panel displays the table of the blocked calls by source with their count
◦ Chart Type: Pie chart
◦ Chart Filter: Shared Time Range Picker, Source Router, Source IP
◦ Drilldown (on click): Inline Source Details Panel
◦ Sourcetype: cisco:sdwan:utd:logs
17. Source Details for a Particular Source
◦ Description: This panel displays a details for particular source
◦ Chart Type: Tabular view
◦ Chart Filter: Shared Time Range Picker, Source Router, Device IP, Device Name, Action, Source IP, Source Port, Destination IP, Destination Port
◦ Drilldown (on click): To raw events
◦ Sourcetype: cisco:sdwan:utd:logs
Flow Analysis
Description
The dashboard provides information related to "Netflow" data such as top network talkers and top source and destination countries.
Screenshot
Panels
The Dashboard should have the below panels:
1. Netflow Packets
◦ Description: This panel displays a single value count of a total number of connection
◦ Chart Type: Single Valued
◦ Chart Filter: Shared Time Range Picker
◦ Drilldown (on click): To raw events
◦ Sourcetype: stream:netflow
2. NetFlow Packet Timeline
◦ Description: This panel displays the line chart netflow records packet
◦ Chart Type: Line Chart
◦ Chart Filter: Shared Time Range Picker
◦ Drilldown (on click): To raw events
◦ Sourcetype: stream:netflow
3. Top Source Countries
◦ Description: This panel displays the top source countries
◦ Chart Type: Geographical Map
◦ Chart Filter: Shared Time Range Picker
◦ Drilldown (on click): N/A
◦ Sourcetype: stream:netflow
4. Top Destination Countries
◦ Description: This panel displays the top destination countries
◦ Chart Type: Geographical Map
◦ Chart Filter: Shared Time Range Picker
◦ Drilldown (on click): N/A
◦ Sourcetype: stream:netflow
5. Communications Map between Sources and Destinations
◦ Description: This panel displays a sankey diagram to visualize packet transfer from source to destination based on protocol
◦ Chart Type: Sankey Diagram
◦ Chart Filter: Shared Time Range Picker, Source Router, Protocol, Number Of Links To Chart, Target, Class, Source IPs, Destination IPs
◦ Drilldown (on click): N/A
◦ Sourcetype: cisco:sdwan:log:summary
6. Top Network Talkers
◦ Description: This panel displays the top network talkers
◦ Chart Type: Tabular View
◦ Chart Filter: Shared Time Range Picker
◦ Drilldown (on click): To raw events
◦ Sourcetype: stream:netflow
7. Top 10 Application
◦ Description: This panel displays the top 10 applications with their count
◦ Chart Type: Tabular View
◦ Chart Filter: Shared Time Range Picker,Source Router
◦ Drilldown (on click): Inline Application Detail Panel
◦ Sourcetype: stream:netflow
8. Application Details for a Particular Application
◦ Description: This panel displays a details for particular Application
◦ Chart Type: Tabular view
◦ Chart Filter: Shared Time Range Picker, Source Router, Source IP, Source Port, Destination IP, Destination Port, Input Snmpidx, Output Snmpidx
◦ Drilldown (on click): To raw events
◦ Sourcetype: stream:netflow
Custom Searches
Description
The dashboard provides predefined event types that helps in searching data based on its categories.
Screenshot
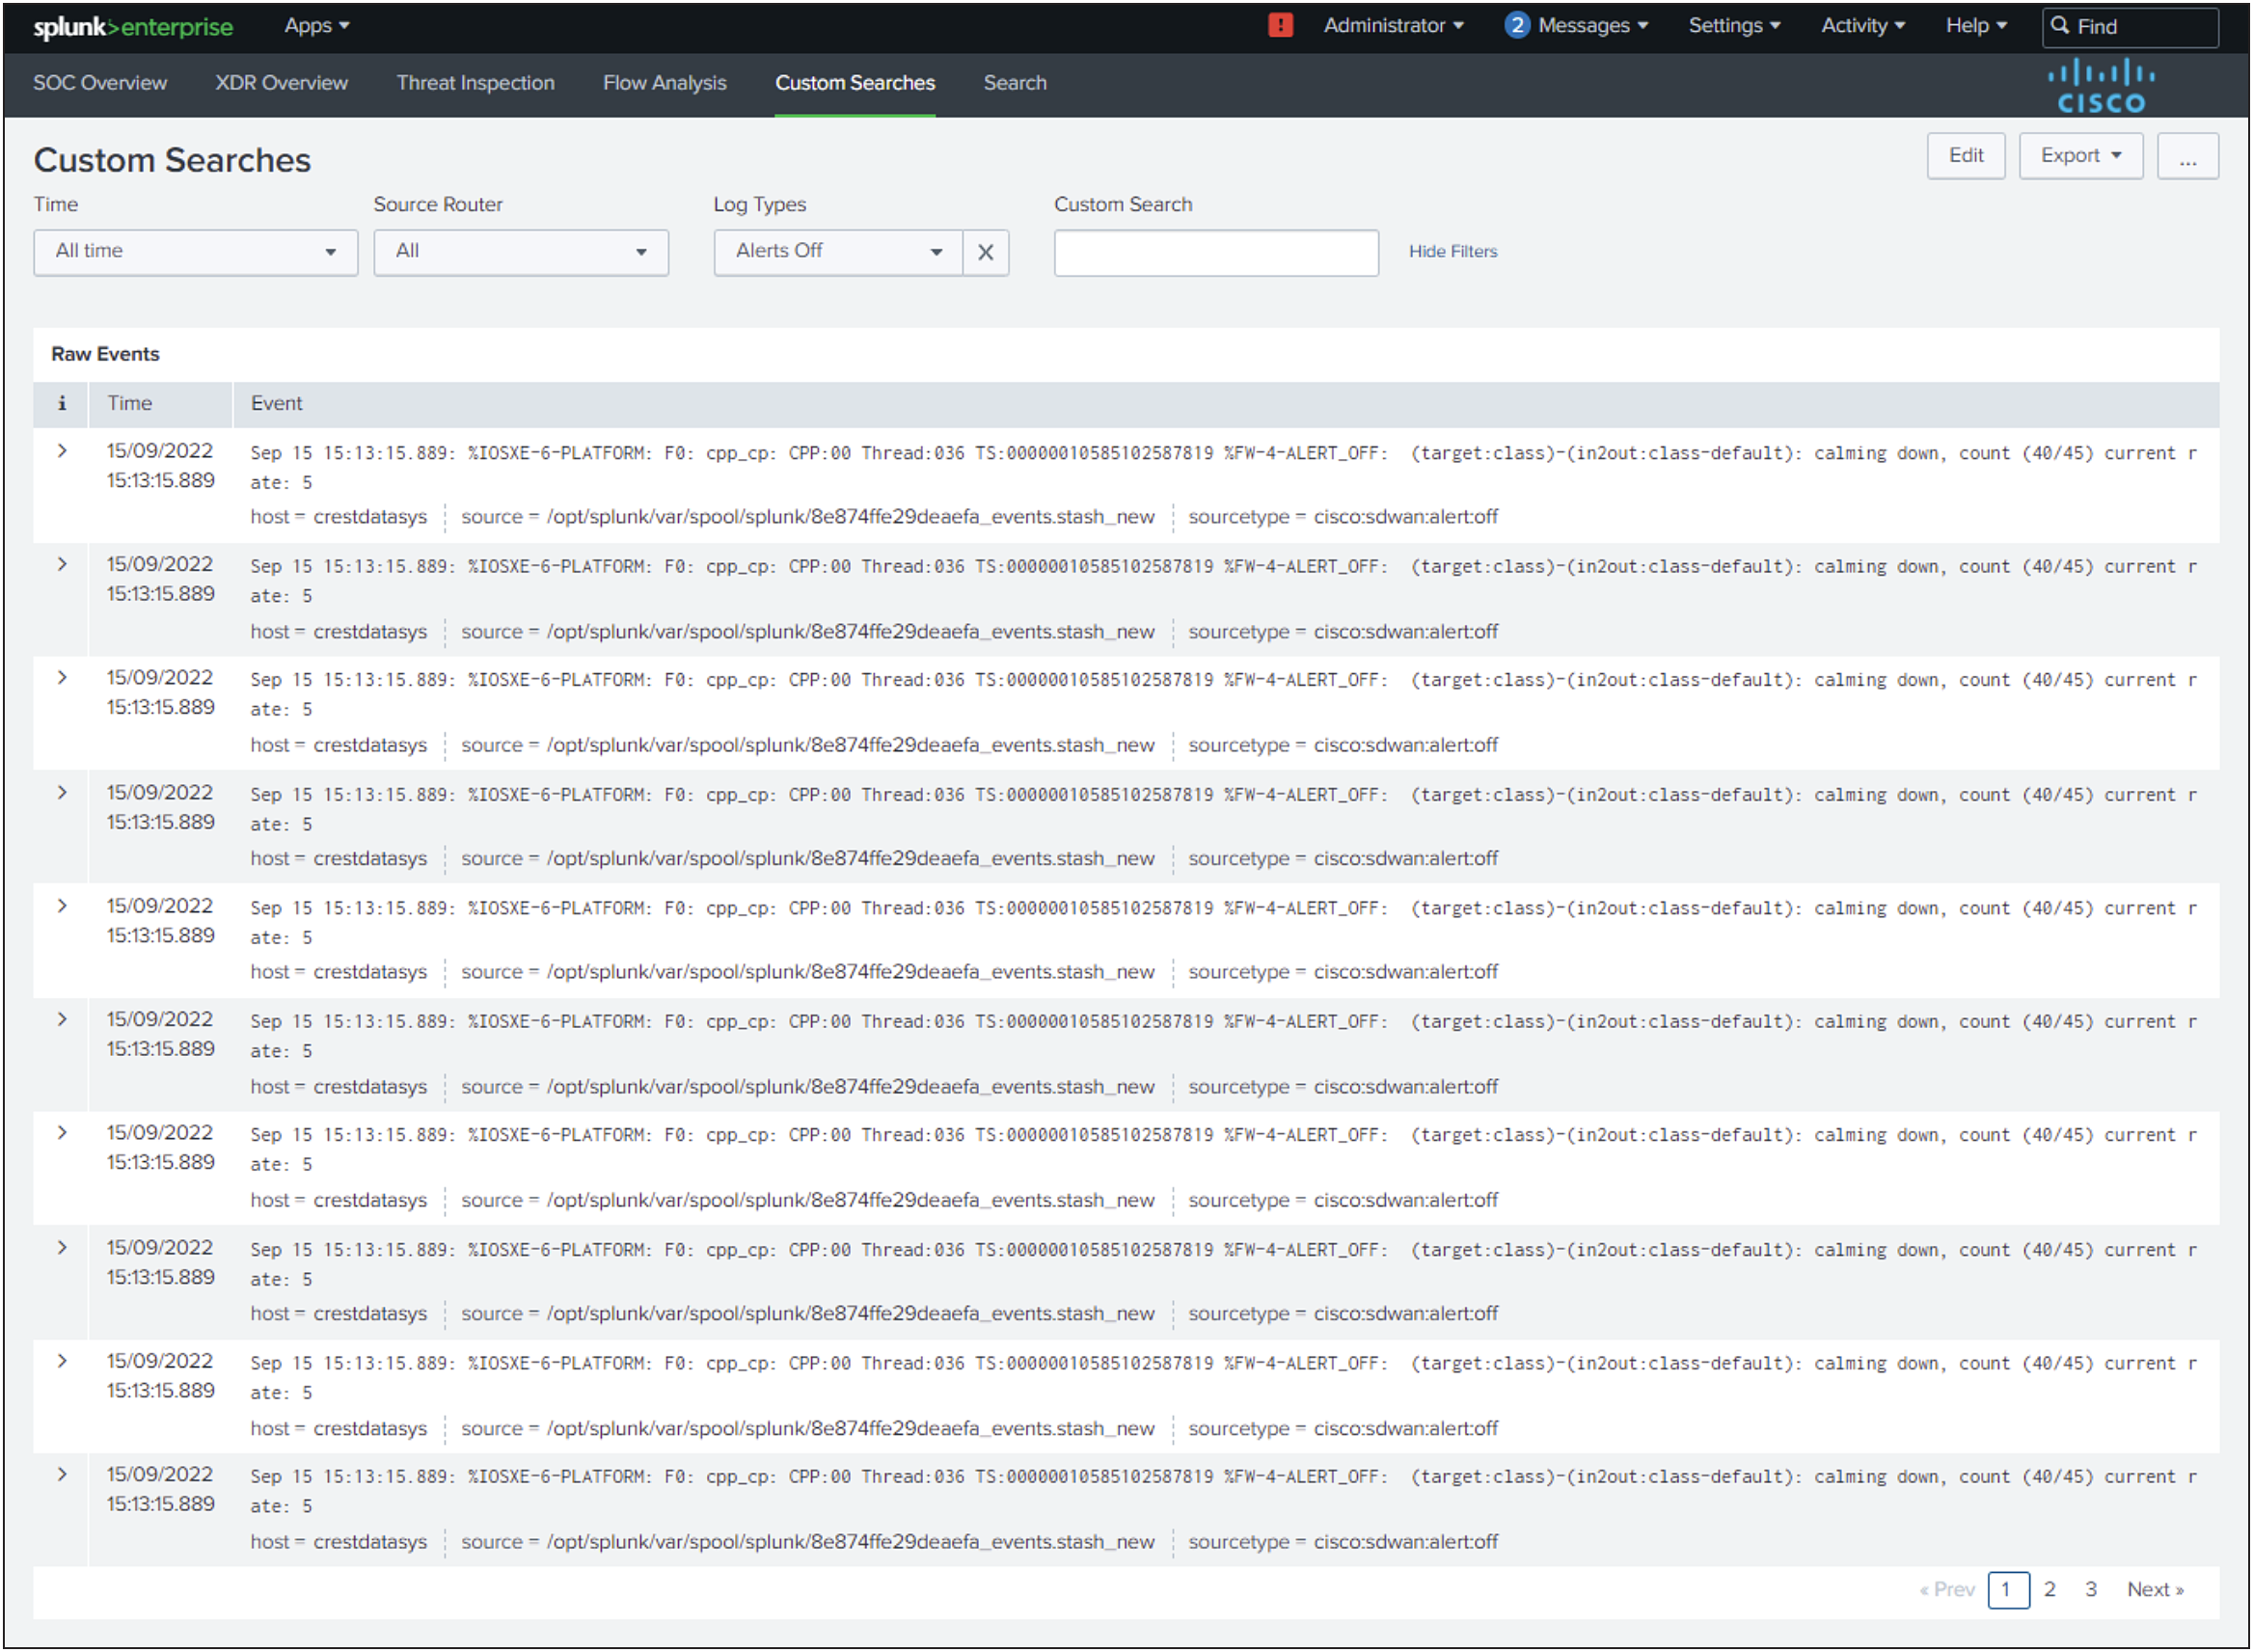
Panels
The Dashboard contains panel having raw events for the selected filters (i.e. Time, Source Router, Log Types, Custom Search).
Time: Select the time range in which you are looking for the data.
Source Router: Select the appropriate host.
Log Types: Select the type of the logs for which you are looking for.
Custom Search: Search the keywords which are part of the raw events.
Event Threshold Notification
Description
The dashboard provides the user the ability to create Splunk alerts based on the “Keywords” and can set the threshold and the schedule as per the requirements.
Screenshot
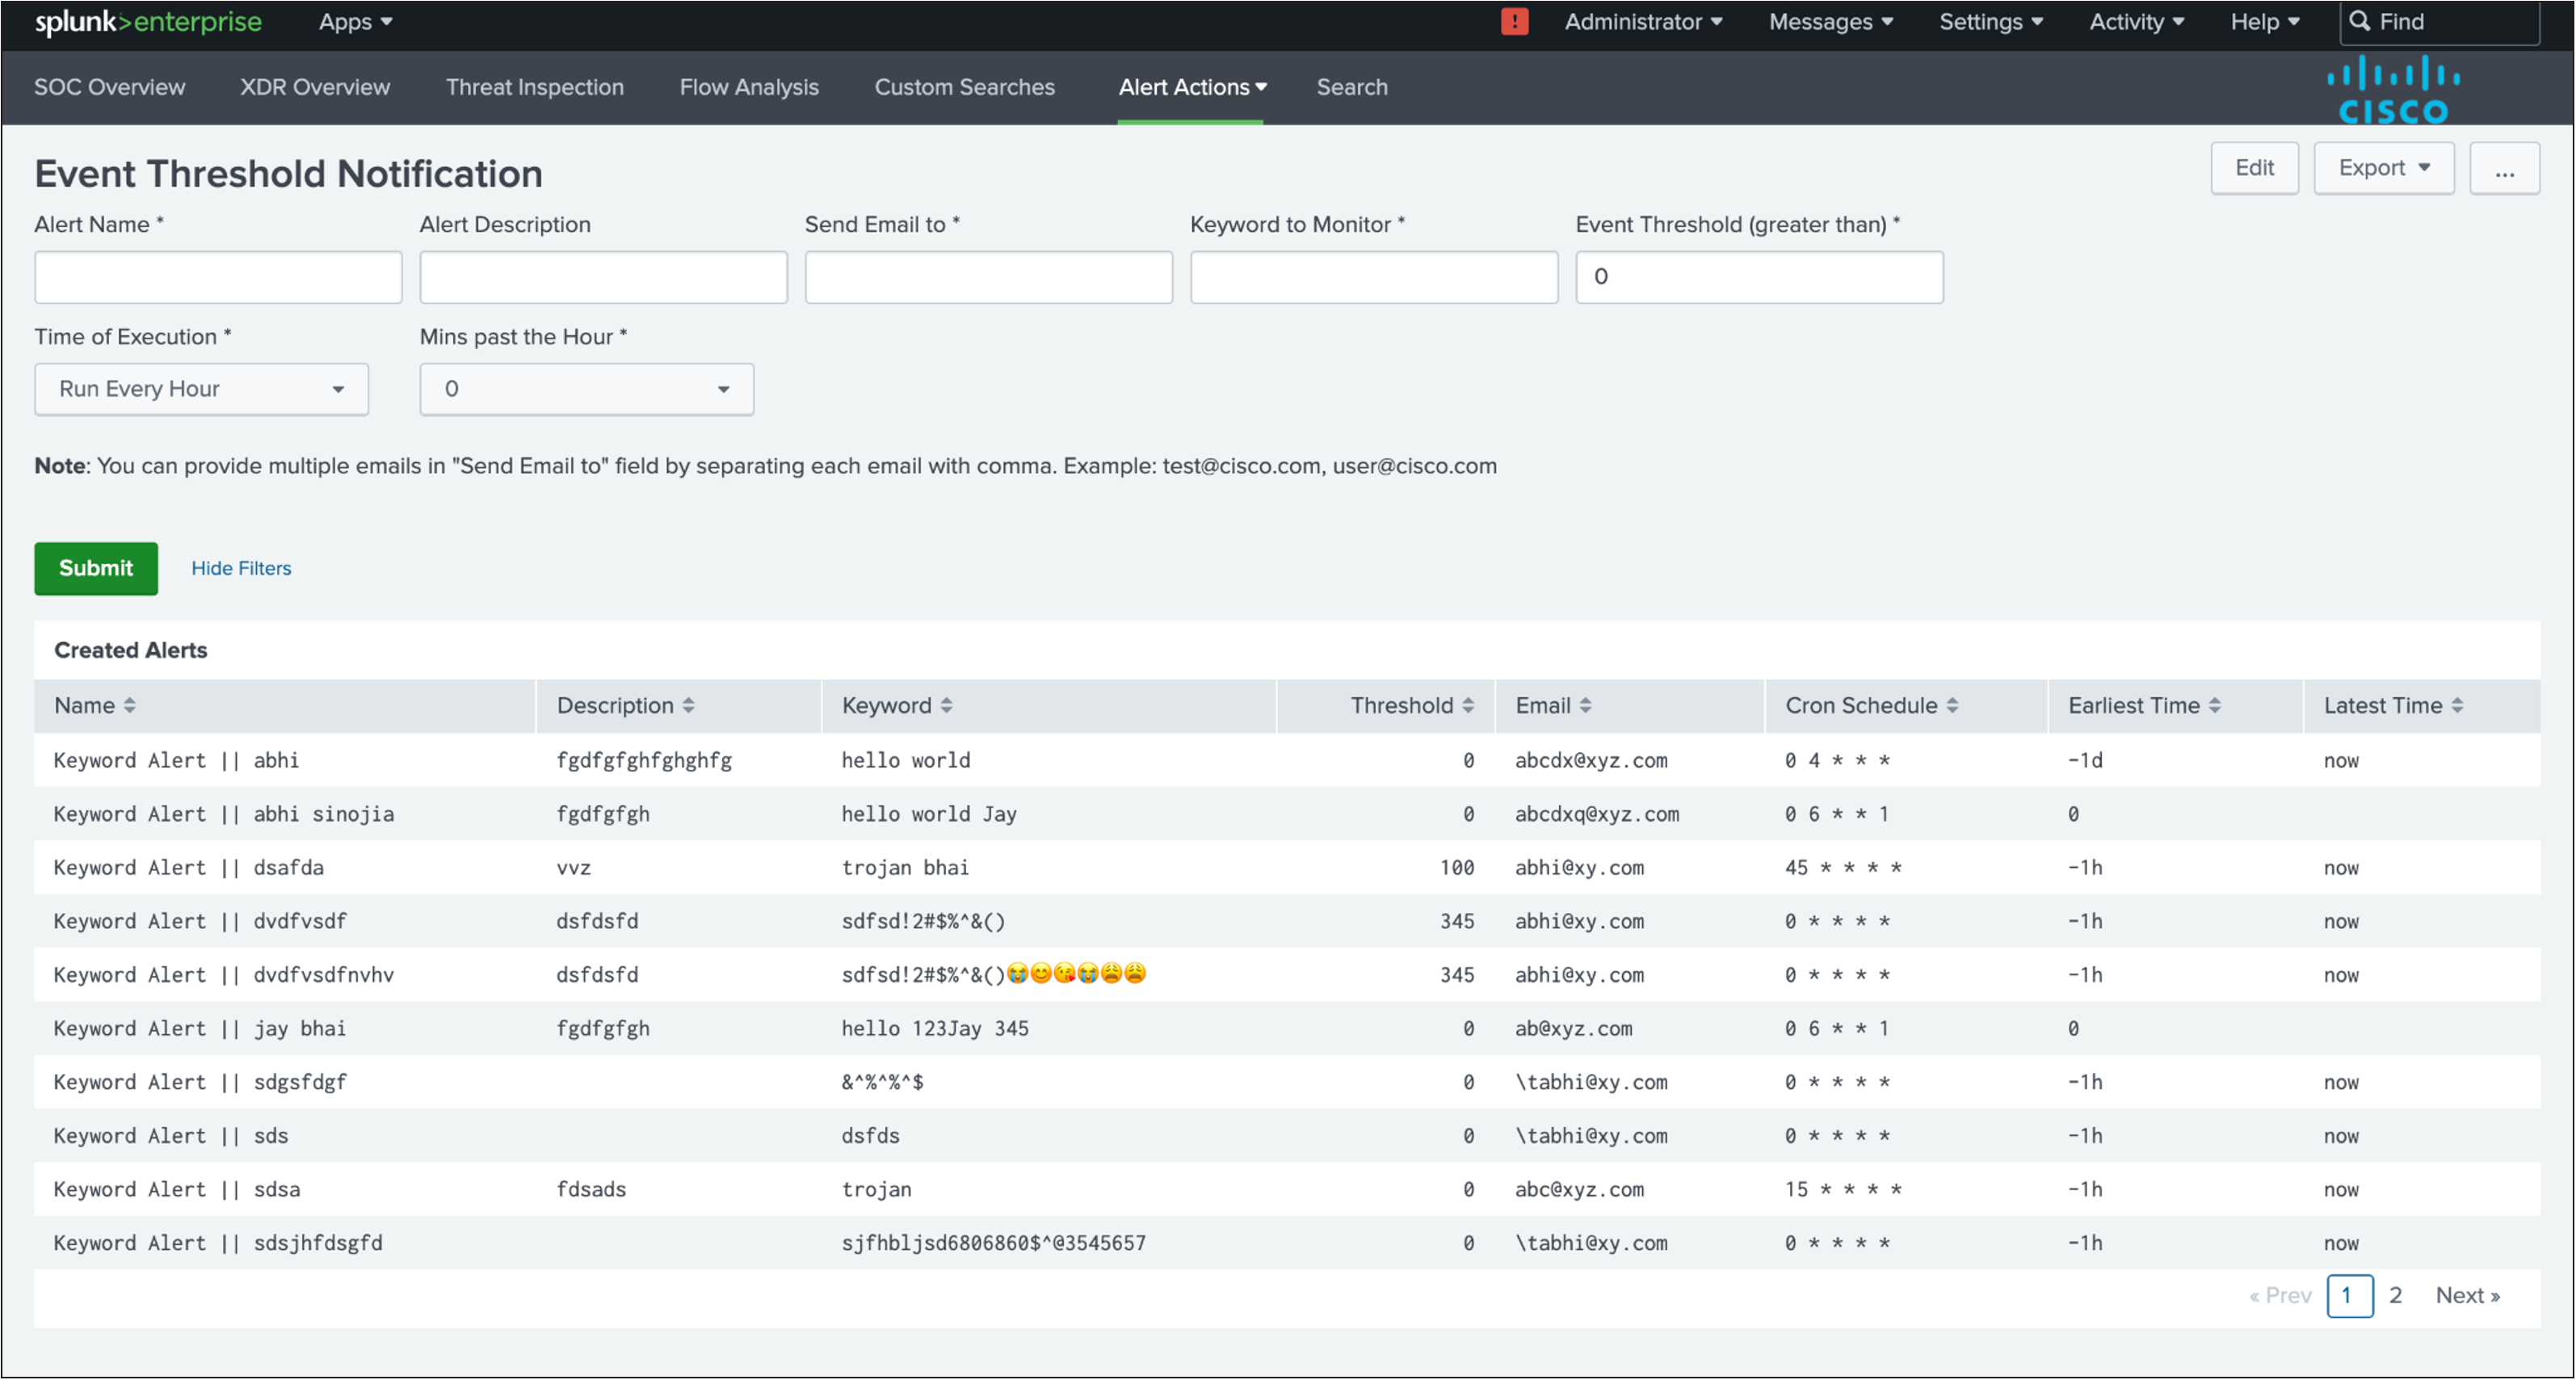
Panels
The Dashboard contains a panel that gives details about the alerts that are created by the user.
Name: Name of the alert.
Description: Description for the respective alert.
Keyword: Keyword for which the alert is created.
Threshold: Threshold count for the keyword.
Email: Email of user to send the alert to.
Cron Schedule: Cron at which the alert is executed.
Earliest Time: Earliest time for the data to be considered.
Latest Time: Latest time for the data to be considered.
Monitor Critical IPs
Description
The dashboard provides the user the ability to create Splunk alerts based on the “IPs/CIDR” and can set the threshold and the schedule as per the requirements.
Screenshot
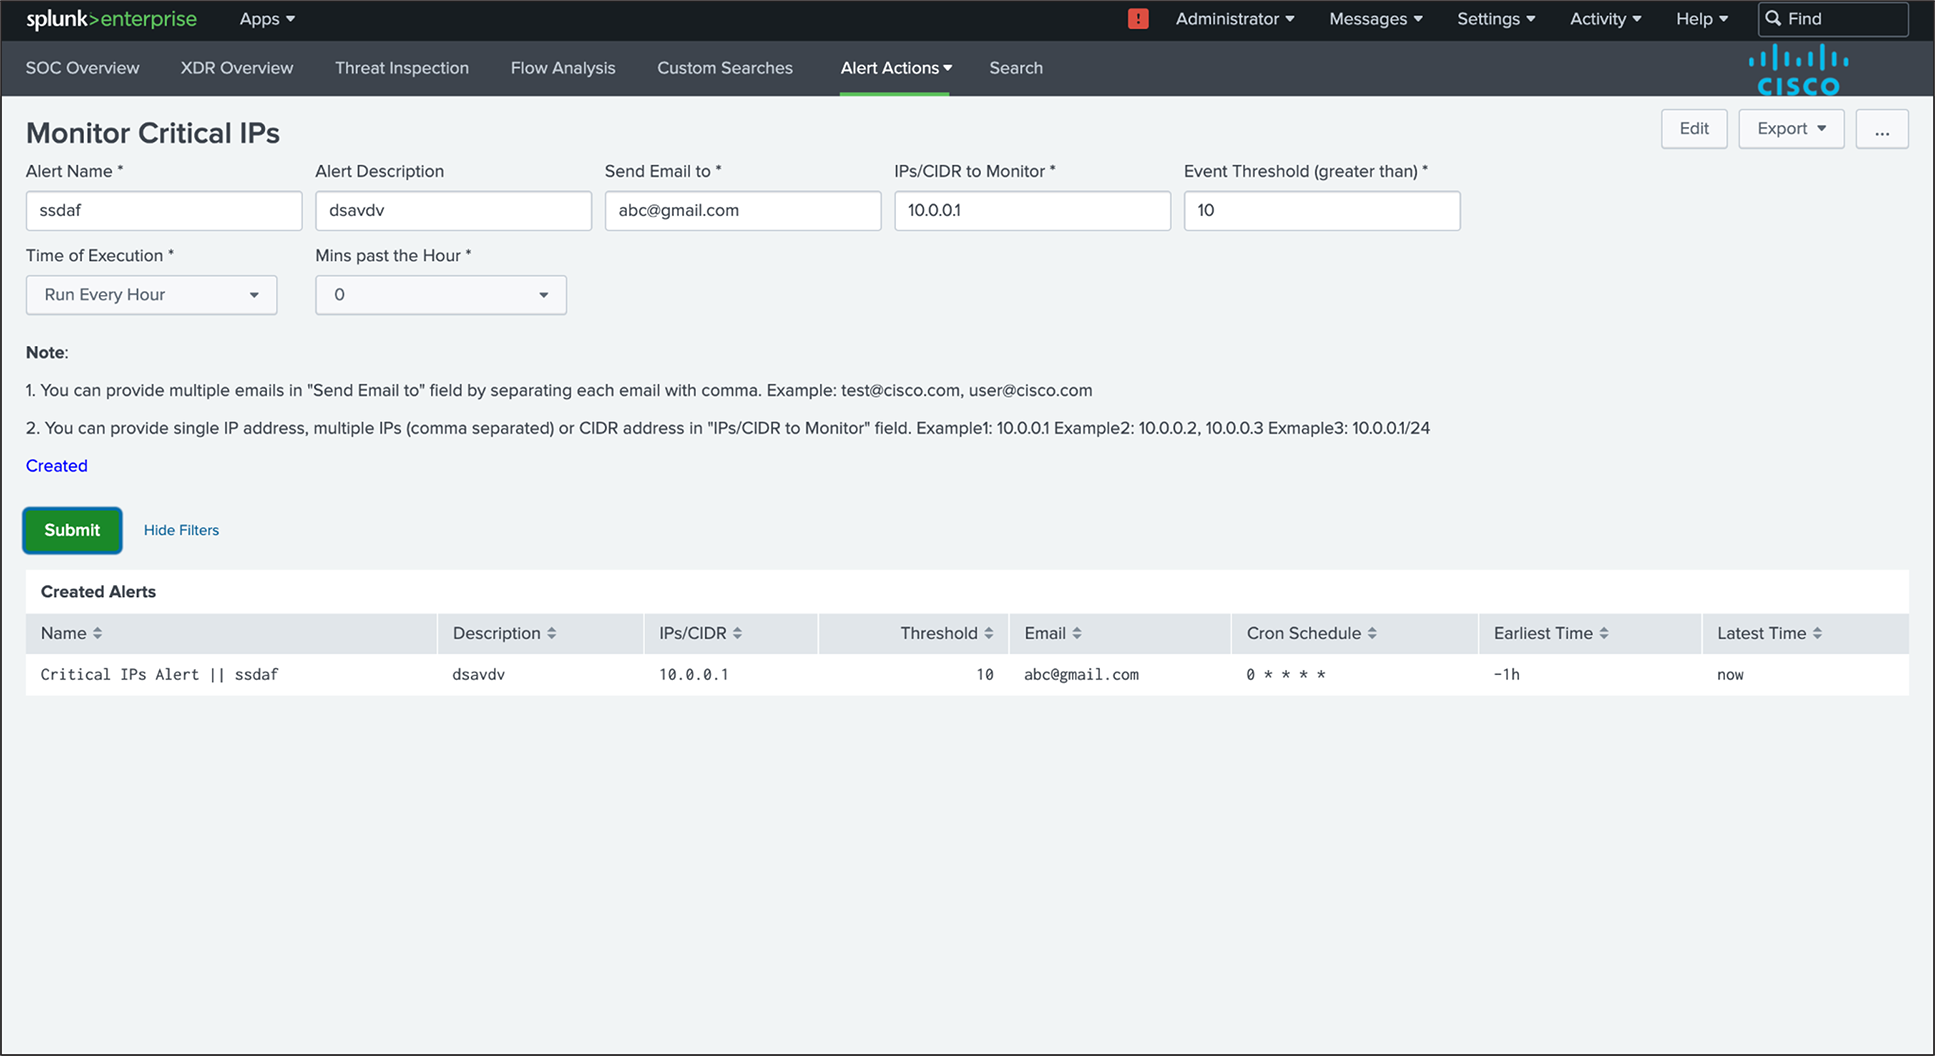
Panels
The Dashboard contains a panel that gives details about the alerts that are created by the user.
Name: Name of the alert.
Description: Description for the respective alert.
IPs/CIDR: IPs/CIDR for which the alert is created.
Threshold: Threshold count for the IPs/CIDR.
Email: Email of user to send the alert to.
Cron Schedule: Cron at which the alert is executed.
Earliest Time: Earliest time for the data to be considered.
Latest Time: Latest time for the data to be considered.
Uninstalling Cisco SD-WAN App and Add-on for Splunk
Disabling the App and Add-on
To disable the App and Add-on, you must be logged into Splunk as an Administrator and follow the steps below.
● Click the App name in the title bar, and then click Manage Apps.
● In the search box, type the name of the app, and then click Search. In the Status column, next to both the App and Add-on, click Disable.
Uninstalling the App and Add-on
Follow the below instructions based on your environment
Uninstall from a Standalone Environment
1. Disable the App and Add-on from the Splunk user interface as detailed above.
2. Log into the Splunk machine from the backend and delete the App and Add-on folders. The app and its directory are typically located in $SPLUNK_HOME/etc/apps/cisco-sdwan-app, and add-on and its directory are typically located in $SPLUNK_HOME/etc/apps/ta-sdwan-app
3. Verify that no local configuration files related to Cisco SDWAN App/Add-on are available in the $SPLUNK_HOME/etc/system and $SPLUNK_HOME/etc/users folders. If the local folder is present, remove it as well.
4. Restart Splunk.
Uninstall from a Distributed or Clustered Environment (To be Checked)
In a cluster or distributed environment, the Cisco SD-WAN App is installed on all the Search Heads and the Cisco SD-WAN Add-on is installed on Search Heads and Forwarders.
The steps to uninstall the App and Add-on are the same as for Standalone.
1. To perform any installation or uninstallation step on all the search nodes of a distributed environment, use a deployer manager.
2. From the deployer machine, go to $SPLUNK_HOME$/etc/shcluster/apps and remove the App and Add-on folders and execute cluster bundle command. Refer.
Cisco SD-WAN Add-on for Splunk
● To check the fields extracted for Syslog data by the Cisco SDWAN Add-on for Splunk:
◦ index=<your_index_name> sourcetype="cisco:sdwan*" in Splunk in verbose mode.
◦ "cisco:firewall:logs" must be selected as sourcetype while configuring the Syslog input.
● To check the fields extracted for Netflow data by the Cisco SDWAN Add-on for Splunk:
◦ index=<your_index_name> sourcetype="stream*" in Splunk in verbose mode.
Cisco SD-WAN App for Splunk
● If dashboards are not getting populated or found data discrepancy between the panel search result and drilldown search result:
◦ Check whether you have correctly configured the index in the cisco_sdwan_index macro.
◦ Also, you can verify if the data is there in the index by running the search query:
◦ index="<your_index_name>"
◦ Try expanding Time Range.
● If in SOC Dashboard "Top 10 Applications" Panel is not getting populated run the savesearch as per the given steps:
◦ Go to Settings -> Searches, reports, and alerts
◦ Select "Cisco SD-WAN for Splunk" in the "App" context dropdown and "All" in the "Owner" dropdown.
◦ Run the "cisco_sdwan_netflow" savedsearch with "All time" time range.
● If in SOC Dashboard "Top 10 Policy Hits" Panel is not getting populated run the savesearch as per the given steps:
◦ Go to Settings -> Searches, reports, and alerts
◦ Select "Cisco SD-WAN for Splunk" in the "App" context dropdown and "All" in the "Owner" dropdown.
◦ Run the "cisco_sdwan_action" and "cisco_sdwan_policy" savedsearches with "All time" time range.