
New and Changed Information
The following table provides an overview of the significant changes up to this current release. The table does not provide an exhaustive list of all changes or of the new features up to this release.
| Release Version | Feature | Description |
|---|---|---|
|
There were no major changes from the previous release. |
||
One View Dashboard for NDFC LAN
The One View Dashboard for NDFC LAN aggregates status information from multiple NDFC-managed fabric clusters that have been federated in Nexus Dashboard, allowing a remote user to monitor a multi-cluster network from one screen.

The One View Dashboard is available only when more than one NDFC fabric cluster has been joined together in the Nexus Dashboard application.
The One View Dashboard is visible only to remote users, who must be authenticated by Nexus Dashboard using remote authentication such as RADIUS or TACACS. This view is not visible to a local user.
The One View Dashboard displays several dashlets along with summary information for the following:
-
Number of LAN clusters
-
Number of fabrics
-
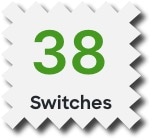
Number of switches
Additional dashlets summarize fabric and switch health, switch release versions, and switch models. Next to each dashlet is a set of links that open expanded pages for each item in the summary.
The following figure is an example of the One View Dashboard for NDFC LAN.
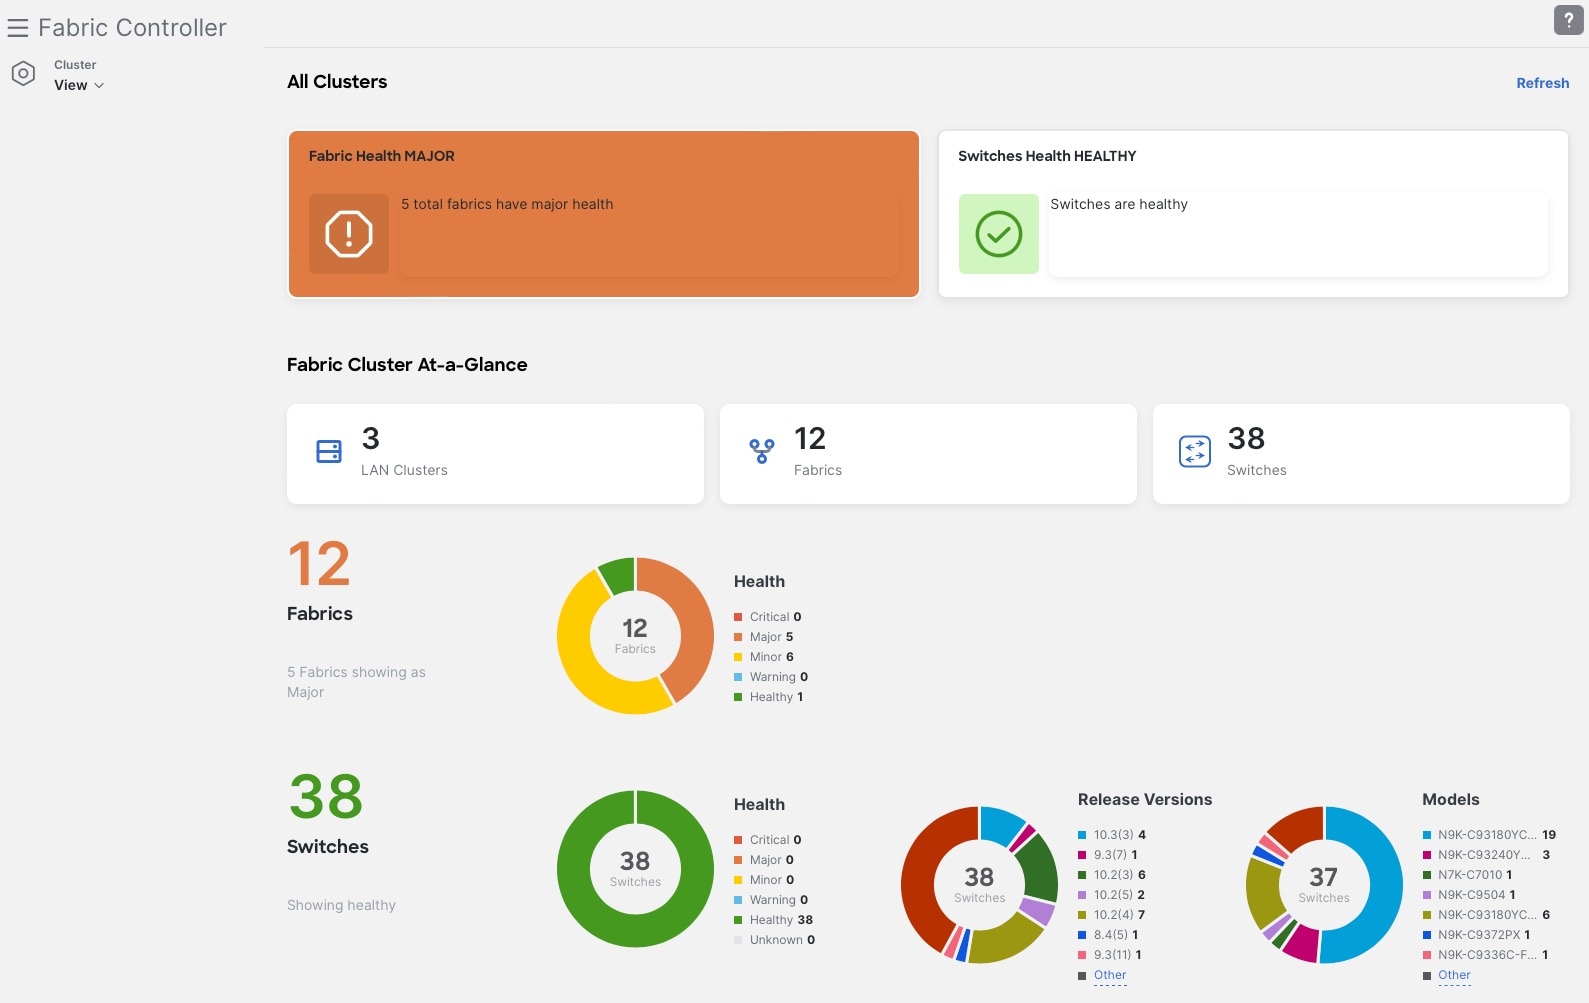

You can click the Refresh link to manually refresh the dashboard.
The following table describes the dashlets that appear in the One View Dashboard for NDFC LAN:
| Dashlet | Description |
|---|---|
|
All Clusters |
Two horizontal tiles display the highest health condition severity of:
|
|
Fabric Cluster At-a-Glance |
Displays the following as a horizontal set of tiles.
|
|
Number of Fabrics |
Displays the total number of federated fabrics in a color representing the highest health severity among the fabrics. This number is a clickable link. See Viewing fabric details. |
|
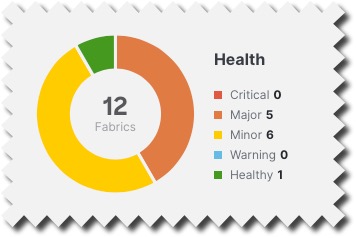
Fabric Health |
Displays the health status of the fabrics in the form of a circular chart with colors indicating different health condition severities. The Fabric Health status is based on the severity of the highest outstanding alarm for the fabric or its member switches. |
|
Number of Switches |
Displays the total number of federated switches in a color representing the highest health severity among the switches. This number is a clickable link. See Viewing switch details. |
|
Switch Health |
Displays the health status of the switches in the form of a circular chart with colors indicating different health condition severities. The Switch Health status is based on the severity of the highest outstanding alarm for the switch or its interfaces. |
|
Switch Release Versions |
Displays the NX-OS versions in the form of a circular chart with colors indicating different release versions present in the federated switches. |
|
Switch Models |
Displays the switch PIDs in the form of a circular chart with colors indicating different switch models in the federated fabric cluster. |
Prerequisites for the One View Dashboard for NDFC LAN
The following conditions must be met before you can view the One View Dashboard:
-
More than one NDFC fabric cluster has been joined together in the Nexus Dashboard application. Up to four NDFC clusters can be joined together in the Nexus Dashboard application.
-
You are logged in to Nexus Dashboard using remote authentication such as RADIUS or TACACS. You are not logged in as a local user.
Accessing the One View Dashboard for NDFC LAN
You can view the One View Dashboard by logging in as a remote user to a Nexus Dashboard controller that manages more than one fabric cluster.
-
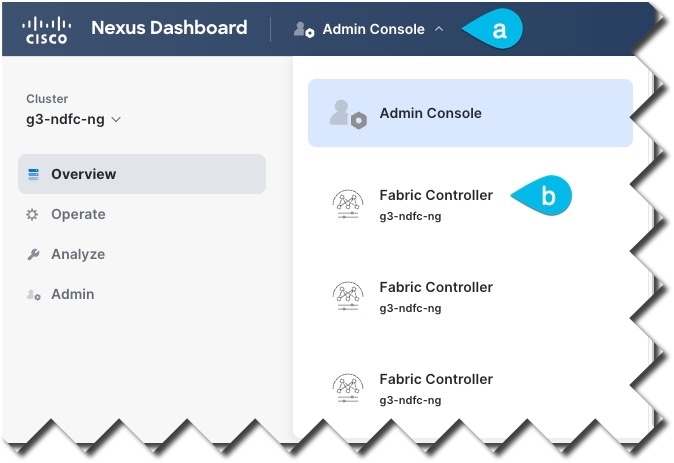
Log in to Nexus Dashboard as a remote user.
The Nexus Dashboard Admin Console opens.
-
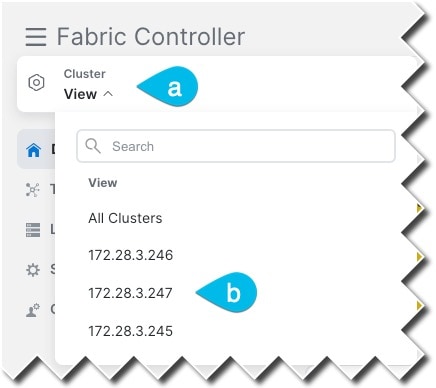
Click the top banner dropdown list and choose any Fabric Controller.
-
From the Cluster View dropdown list, choose All Clusters.
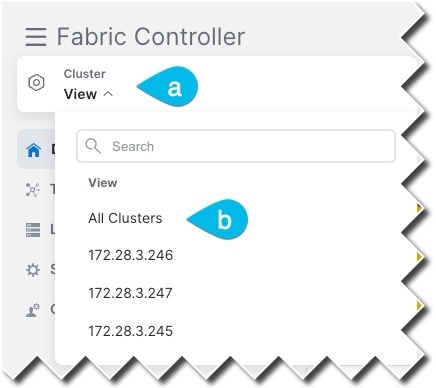
The One View Dashboard appears.
If the All Clusters selection or the One View Dashboard do not appear, check that you have met the Prerequisites.
From the Cluster View dropdown list, you can also open an overview dashboard for any member of the federated clusters by selecting that cluster. See Viewing a Specific Cluster.
Viewing the Details
By clicking objects in the One View Dashboard, you can open subpages containing detailed attributes of the selected object.
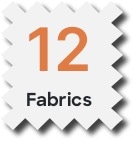
The displayed number of fabrics is a clickable link.
-
To view a sidebar with summary information about the fabric, single-click the Fabric count number.
-
To view a table of federated fabrics in the cluster, double-click the Fabric count number.
For each fabric, the table of federated fabrics lists the following properties:
| Attributes | Description |
|---|---|
|
Controller Name |
The name of the fabric controller that manages this fabric |
|
Fabric Name |
The name of the fabric |
|
Fabric Technology |
|
|
Fabric Type |
|
|
ASN |
Autonomous System Number |
|
Fabric Health |
The current health severity of this fabric as reported by the fabric controller |
VXLAN EVPN Multi-Site fabrics might appear in the One View Dashboard even though a filter might be set that should exclude them; this is because a true condition for a child fabric in the VXLAN EVPN Multi-Site fabric will cause that parent VXLAN EVPN Multi-Site fabric to also appear, even if that condition is false for the parent fabric. For example, if all of the child fabrics have an ASN value but the parent fabric does not (has NA as the ASN entry), a filter entry of ASN != NA will correctly show all of the child fabrics, but will also incorrectly show the parent VXLAN EVPN Multi-Site fabric because the parent fabric will appear along with the child fabrics.
The displayed number of switches is a clickable link.
-
To view a sidebar with summary information about the switches, single-click the Switches count number.
-
To view a table of federated switches in the fabric, double-click the Switches count number.
For each switch, the table of federated switches lists the following properties:
| Attributes | Description |
|---|---|
|
Controller Name |
The name of the fabric controller for the fabric that includes the switch |
|
Switch |
The name of the switch |
|
IP Address |
The IP address of the switch (IPv4 or IPv6) |
|
Role |
Whether the switch is acting as a:
|
|
Serial Number |
The serial number of the switch |
|
Fabric Name |
The name of the fabric that includes the switch |
|
Mode |
|
|
Config Status |
|
|
Oper Status |
The current health severity of the switch |
|
Discovery Status |
|
|
Model |
The Cisco model number of the switch |
|
VPC Role |
If the switch is part of a VPC pair, whether it is the Primary or Secondary link. If applicable, whether it is Operational Primary or Secondary. |
|
VPC Peer |
If the switch is part of a VPC pair, the name of the peer switch |
|
Software Version |
The NX-OS release running on the switch |
|
Up Time |
The time elapsed since the last startup or reboot of the switch |
To view a table of fabrics or switches with a specific health severity, click the corresponding color of the circular chart, or click the severity from the list next to the chart:
For fabrics, the resulting table shows the list of fabrics filtered by the selected Fabric Health property.
For switches, the resulting table shows the list of switches filtered by the selected Oper Status property.
To view a table of the switches running a specific NX-OS release, click the corresponding color of the Release Versions circular chart, or click the release from the list next to the chart.
The resulting table shows a list of switches filtered by the selected Software Version property.
To view a table of a specific model of switches present in the federated cluster, click the corresponding color of the Models circular chart, or click the model number from the list next to the chart.
The resulting table shows a list of switches filtered by the selected Model property.
Viewing a Specific Cluster
In the One View Dashboard for NDFC LAN, you can open an overview dashboard for any member of the federated clusters.
From the Cluster View dropdown list, choose one of the member clusters.
A view of the selected cluster appears.
Copyright
THE SPECIFICATIONS AND INFORMATION REGARDING THE PRODUCTS IN THIS MANUAL ARE SUBJECT TO CHANGE WITHOUT NOTICE. ALL STATEMENTS, INFORMATION, AND RECOMMENDATIONS IN THIS MANUAL ARE BELIEVED TO BE ACCURATE BUT ARE PRESENTED WITHOUT WARRANTY OF ANY KIND, EXPRESS OR IMPLIED. USERS MUST TAKE FULL RESPONSIBILITY FOR THEIR APPLICATION OF ANY PRODUCTS.
THE SOFTWARE LICENSE AND LIMITED WARRANTY FOR THE ACCOMPANYING PRODUCT ARE SET FORTH IN THE INFORMATION PACKET THAT SHIPPED WITH THE PRODUCT AND ARE INCORPORATED HEREIN BY THIS REFERENCE. IF YOU ARE UNABLE TO LOCATE THE SOFTWARE LICENSE OR LIMITED WARRANTY, CONTACT YOUR CISCO REPRESENTATIVE FOR A COPY.
The Cisco implementation of TCP header compression is an adaptation of a program developed by the University of California, Berkeley (UCB) as part of UCB’s public domain version of the UNIX operating system. All rights reserved. Copyright © 1981, Regents of the University of California.
NOTWITHSTANDING ANY OTHER WARRANTY HEREIN, ALL DOCUMENT FILES AND SOFTWARE OF THESE SUPPLIERS ARE PROVIDED “AS IS" WITH ALL FAULTS. CISCO AND THE ABOVE-NAMED SUPPLIERS DISCLAIM ALL WARRANTIES, EXPRESSED OR IMPLIED, INCLUDING, WITHOUT LIMITATION, THOSE OF MERCHANTABILITY, FITNESS FOR A PARTICULAR PURPOSE AND NONINFRINGEMENT OR ARISING FROM A COURSE OF DEALING, USAGE, OR TRADE PRACTICE.
IN NO EVENT SHALL CISCO OR ITS SUPPLIERS BE LIABLE FOR ANY INDIRECT, SPECIAL, CONSEQUENTIAL, OR INCIDENTAL DAMAGES, INCLUDING, WITHOUT LIMITATION, LOST PROFITS OR LOSS OR DAMAGE TO DATA ARISING OUT OF THE USE OR INABILITY TO USE THIS MANUAL, EVEN IF CISCO OR ITS SUPPLIERS HAVE BEEN ADVISED OF THE POSSIBILITY OF SUCH DAMAGES.
Any Internet Protocol (IP) addresses and phone numbers used in this document are not intended to be actual addresses and phone numbers. Any examples, command display output, network topology diagrams, and other figures included in the document are shown for illustrative purposes only. Any use of actual IP addresses or phone numbers in illustrative content is unintentional and coincidental.
The documentation set for this product strives to use bias-free language. For the purposes of this documentation set, bias-free is defined as language that does not imply discrimination based on age, disability, gender, racial identity, ethnic identity, sexual orientation, socioeconomic status, and intersectionality. Exceptions may be present in the documentation due to language that is hardcoded in the user interfaces of the product software, language used based on RFP documentation, or language that is used by a referenced third-party product.
Cisco and the Cisco logo are trademarks or registered trademarks of Cisco and/or its affiliates in the U.S. and other countries. To view a list of Cisco trademarks, go to this URL: http://www.cisco.com/go/trademarks. Third-party trademarks mentioned are the property of their respective owners. The use of the word partner does not imply a partnership relationship between Cisco and any other company. (1110R)
© 2017-2024 Cisco Systems, Inc. All rights reserved.