Skip to Content | Skip to Footer
Cisco Network Operations Automation Service
 |
Cisco Network Operations Automation Service enables management automation across multiple network devices and technologies by driving standardization of processes and procedures to manage your network infrastructure. It deploys Cisco best practices via automated workflows that provide a unique differentiation within the marketplace by focusing on tried and tested procedures based on the expertise of Cisco CCIEs. This solution contributes to reducing operational costs, risk and improving quality of service and enables companies to focus their resources on deploying new services thereby adding value to the business.
Fill in the appropriate values for your organization to see the potential benefits of the Cisco Network Operations Automation Service might deliver for your customers and for your business. This benefits calculator provides a simple way to approximate benefits of implementing this solution. The calculator is intended as a tool to help educate our customers about the possible benefits and opportunities of this implementation. It is not intended as a definitive business case, and users of this calculator should not use this as the sole basis for justifying an implementation.
|
|
|
Benefits Calculator - Usage Guide
Introduction
This document explains how to use the Cisco Network Operations Automation Service Benefits Calculator with a customer. This self-help guide provides a set of starter questions to use with your customer and helps you to better understand how to use the information received from your customer in the calculator
We also answered some frequently asked questions (FAQs) to provide you support in using the benefits calculator. We hope you find the benefits calculator a valuable asset for supporting your customers. The benefits calculator is built in Adobe Flash to allow for simple portability, and can be hosted on a website, loaded in a web browser, or embedded in a Microsoft PowerPoint presentation. We also provide the option to print the screen at any time during your interactions with the customer. The print button is in the top right corner of the benefits calculator.
Calculator Overview
Objective
This Benefits Calculator provides a quick analysis of the financial benefits that Cisco NOAS can provide to a customer. By filling in inputs unique to the customer's environment and planned deployment of Cisco NOAS, the Cisco account manager or business development manager can communicate to a customer from where the projected benefits will come, begin discussions on the various use cases of Cisco NOAS, and print out the results to provide a customer takeaway.
Layout
|
|
|
|
The calculator consists of four tabs. The first three tabs contain the customer inputs on the left side of the tab, and the results on the right side. The third tab, the Model Details tab, provides the outputs and yearly benefits breakdown.
Inputs are in the form of slider bars, check boxes, drop down menus, or text input fields. Outputs are presented with bar graphs, pie charts, or tables. In the charts and graphs, you will see exact values as you scroll your mouse cursor over bar or pie section.
|
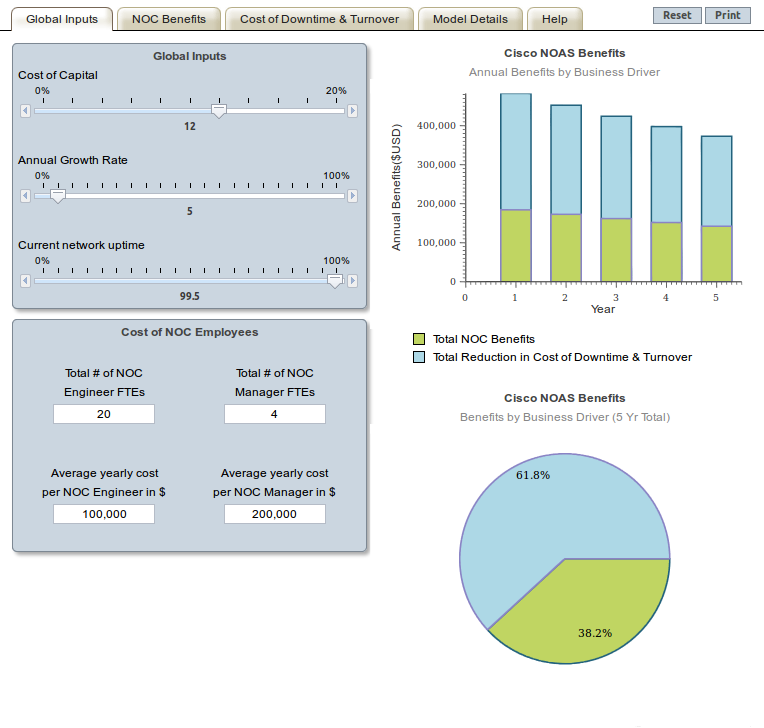
Global Inputs Tab |
||||||||||||||||||||||||||||||||||||||||||||||||||
|
Selected Inputs |
Question |
Sample Answers/Hints |
||||||||||||||||||||||||||||||||||||||||||||||||
|
Global Inputs |
||||||||||||||||||||||||||||||||||||||||||||||||||
|
Cost of Capital |
What is the approximate interest rate on corporate or government bonds (commercial paper) that the company uses? {what is the customer's cost to borrow money, all CFO's will know this} |
Common "risk free" interest rates are in the 4-9% range, though companies frequently base their cost of capital on the rate they can get by investing their money in internal company projects, in which case, the rate could be higher than 9%. |
||||||||||||||||||||||||||||||||||||||||||||||||
|
Annual Growth Rate |
What is your company's annual revenue growth rate? |
Smaller successful companies usually have higher growth rates (10-25%) while larger companies have less market share to take, and have lower growth rates (5-15%). |
||||||||||||||||||||||||||||||||||||||||||||||||
|
Current network uptime |
What
is your current network uptime? |
For your reference:
|
||||||||||||||||||||||||||||||||||||||||||||||||
|
Cost of NOC Employees |
||||||||||||||||||||||||||||||||||||||||||||||||||
|
Total # of NOC Engineer FTEs |
How many IT engineers do you have working in your Network Operations Center? |
If the customer has some part-time employees or contractors, have them translate them into full-time employee (FTE) equivalents in terms of cost. |
||||||||||||||||||||||||||||||||||||||||||||||||
|
Average yearly cost per NOC Engineer |
What is your average annual cost for an IT employee? |
Remind them to include the total cost including salary, benefits, perks, training, travel, and general overhead. |
||||||||||||||||||||||||||||||||||||||||||||||||
|
Total # of NOC Manager FTEs |
How many IT managers do you have in your Network Operations Center? |
This number is generally much lower than the # of NOC engineers, generally in a ratio of one IT Manager for every 5-20 NOC engineers. |
||||||||||||||||||||||||||||||||||||||||||||||||
|
Average yearly cost per NOC Manager |
What is your average annual cost for an IT Manager? |
Remind them to include the total cost including salary, benefits, perks, training, travel, and general overhead. |
||||||||||||||||||||||||||||||||||||||||||||||||
|
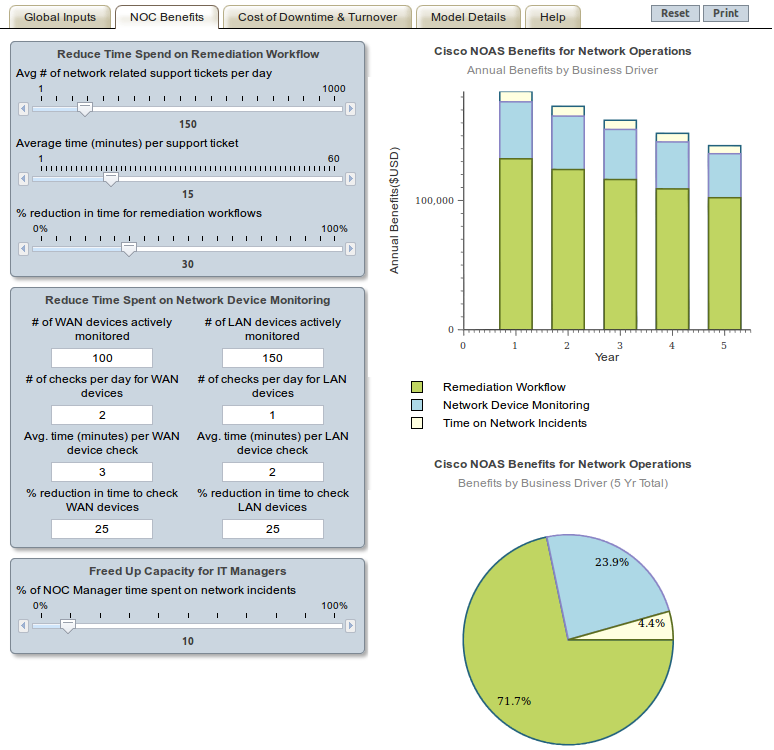
NOC Benefits Tab |
||
|
Selected Inputs |
Question |
Sample Answers/Hints |
|
Reduce Time Spent on Remediation Workflows |
||
|
Avg # of network related support tickets per day |
On average, how many support tickets does the customer have per day? |
They could look up the number of tickets from January 1 to December 31 (or some other arbitrary period) then divide by 365 (or the arbitrary number of days in that period). |
|
Average time (minutes) per support ticket |
On average, how many minutes does a support tech spend on a ticket? |
Similar to above, try to take a snapshot period (1 year ideally) and find the average time per ticket for that period. |
|
% reduction in time for remediation workflows |
This refers to the reduction in time that a NOC Engineer needs to remediate a network issue. |
This will be an estimate, based on the pain points the customer has, which would be addressed by the features that Cisco NOAS provides, typically 30% or less.
|
|
Reduce Time Spent on Network Device Monitoring |
||
|
# of WAN/LAN devices actively monitored |
How many WAN/LAN devices are actively monitored? |
Frequently, the IT department designates someone to check on devices. |
|
# of checks per day for WAN/LAN devices |
How many times per day are the WAN/LAN devices checked? |
If the check occurs every other day, then, use 0.5. |
|
Avg. time (minutes) per WAN/LAN device check |
What is the average time to check a WAN/LAN device? |
Be sure to include the IT person\92s idle time --such as watching screen for errors. |
|
% reduction in time to check WAN/LAN devices |
By what % would the WAN/LAN device checks be reduced? |
The reduction comes from automation tools that eliminate manual checks to be done. |
|
Freed Up Capacity for IT Managers |
||
|
% of NOC Manager's time spent on network incidents |
What percentage of a NOC Manager\92s time is currently spent dealing with network incidents? |
The remainder of a NOC Manager\92s time would be spent managing their team, communicating ting with other groups, etc. |
|
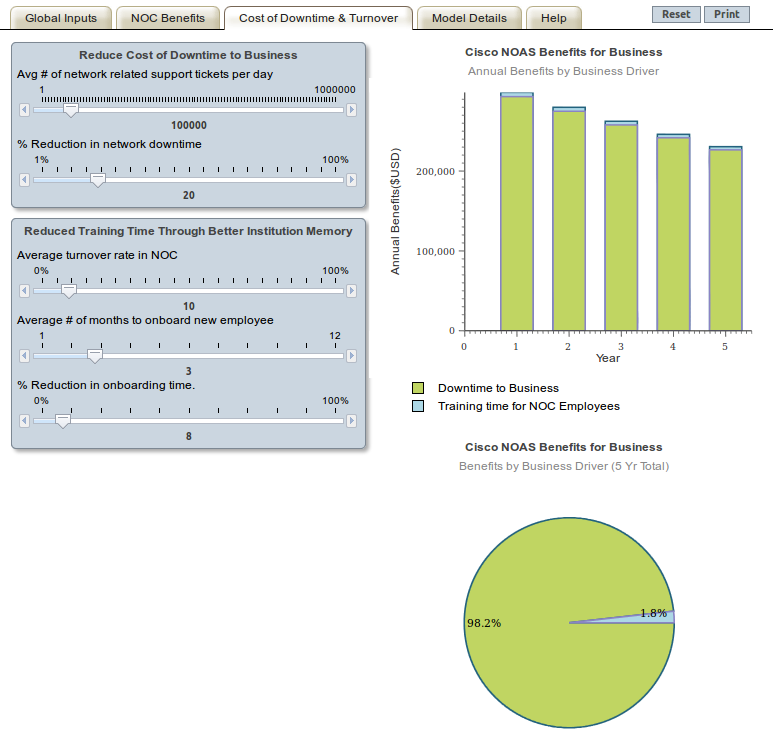
Cost of Downtime & Turnover Tab |
||
|
Selected Inputs |
Question |
Sample Answers/Hints |
|
Reduce Cost of Downtime to Business |
||
|
Avg. cost of downtime per hour |
Could you estimate the average cost of downtime per hour?
When answering this question, think of the critical areas of your business, and the amount of sales you make or product you create/deliver/provide during an hour, and consider that you have a global market.
Additionally, the cost of downtime could include the lost productivity of your workers or for service providers, not delivering on services and incurring penalties for missing SLA agreements.
|
One
way to determine this number is by figuring out the smallest unit
of sale or deliverable for the business, and how often a sale is
done or how long it take deliver the product or service. Then
translate that information into a one-hour period. |
|
% Reduction in network downtime |
What percentage reduction in downtime do you expect to achieve by using the Cisco IA for Networks solution? |
This figure will be agreed upon by Cisco and the customer and depends upon the customer\92s current network environment and is typically around 30%.
|
|
Reduce Training Time Through Better Institutional Memory |
||
|
Average turnover rate in NOC |
What is your average turnover rate in your NOC? |
To arrive at the %, you need to identify out how often an employee leaves the company vs. how many employees you have. For example, assuming you maintain 20 employees in your NOC and one employee leaves the company every 3 months. This equates to 4 employees per year, or a turnover rate of 20% (4 / 20). Another way to calculate would be to divide 1 year by the average employee tenure. If the average tenure of NOC employees is 4 years, the turnover rate is 25% (1 / 4)
|
|
Average # of months to onboard new employee |
What is the average amount of time to train or onboard a new employee?
|
Training a new employee takes some time, even if they performed the exact same function at a previous company or job. This ballpark estimate should include training and knowledge capture/transfer for the employee to be able to perform their job without extensive help from peers.
|
|
% Reduction in onboarding time |
What % reduction in onboarding time would you expect by having your entire network operations flow mapped out? |
The % reduction comes from eliminating the need for new employees to learn everything by digging through documentation. The default 8% saves 1 week out of the current estimated 3 months for onboarding.
|
|
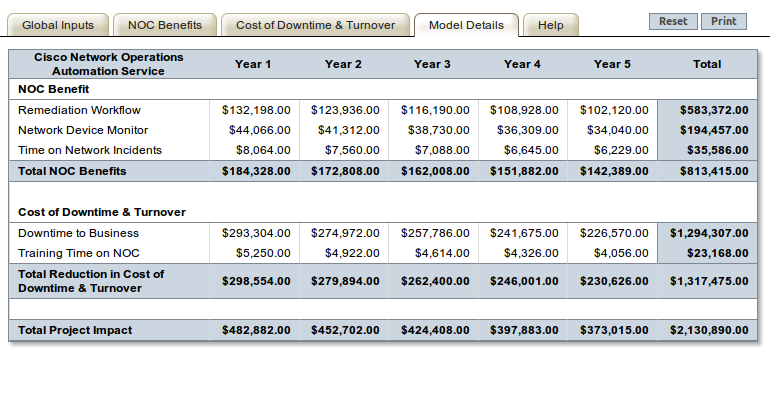
Model Details |
|
|
The Model projects benefits of the Cisco IA for Networks solution over a 5 year timeframe, and breaks them down by NOC Benefits and Reduced Downtime & Less Costly Turnover. It provides yearly subcategory totals in the grey shaded lines and project totals in the green shaded line. And finally, the right most column sums the benefits to be gained over the 5 years. |
|
|
NOC Benefits |
|
|
Remediation Workflows |
Refers to benefits from speeding up the manual and automated workflow remediation process for addressing network issues. |
|
Network Device Monitoring |
Refers to the reduced time to monitor network devices such a servers, networked attached storage, and communications systems. |
|
Time on Network Incidents |
This refers to \93recaptured\94 time that NOC Managers can spend on higher level tasks, such as strategic projects, so the actual [long-term] company benefit may be larger than the straight translation of cost of employee time. |
|
Total NOC Benefits |
Summation of the above three benefits.
|
|
Cost of Downtime & Turnover |
|
|
Downtime To Business |
Represents the benefits from a reduction in downtime. This would likely provide the largest benefit to a customer. |
|
Training Time for NOC Employees |
This refers to the shortened learning curve for a new NOC employee to learn the existing workflows, network topology, etc. |
|
Total Reduction in Cost |
Summation of the above two benefits.
|
|
Total |
|
|
Total Project Impact |
This refers to the summation of the above five benefits. Note that the benefits in years two through five are discounted by the cost of capital, to provide the net present value of those benefits.
In other words, a dollar a year from now, is less valuable than a dollar today, since I would be able to invest a dollar today, and have more than a dollar a year from now\85 |
| The Cisco Network Operations Automation Service Benefits Calculator and its output provide general guidance only. Contents of this Tool are based on public information or third party research current as October 2008. You understand and agree that Cisco Systems, Inc., its affiliates and their respective directors, officers, employees and agents (“Cisco“) are not engaged in rendering business, legal, accounting, tax, or other professional advice and services. The Tool must not be used as a substitute for consultation with professionals. While Cisco has attempted to provide reliable data and formulae in this Tool, Cisco is not responsible for any errors or omissions, or for the results obtained from the Tool. You shall indemnify and hold Cisco harmless from any and all losses, damages, liabilities, settlement, costs and expenses as incurred, arising out of or related to your use or misuse of the Tool. THE TOOL IS PROVIDED AS IS, WITH NO WARRANTIES OF ANY KIND, INCLUDING BUT NOT LIMITED TO, WARRANTIES OF MERCHANTABILITY, NON-INFRINGEMENT OR FITNESS FOR A PARTICULAR PURPOSE, COMPLETENESS, ACCURACY OR TIMELINESS. IN NO EVENT WILL CISCO BE LIABLE TO CUSTOMER OR ANYONE ELSE FOR ANY DECISION MADE OR ACTION TAKEN IN RELIANCE ON THE INFORMATION OR OUTPUT OF THIS TOOL OR BE LIABLE FOR ANY LOST REVENUE, PROFIT, OR DATA, OR FOR SPECIAL, INDIRECT, CONSEQUENTIAL, INCIDENTAL, OR PUNITIVE DAMAGES HOWEVER CAUSED AND REGARDLESS OF THE THEORY OF LIABILITY ARISING OUT OF THE USE OF OR INABILITY TO USE TOOL EVEN IF CISCO HAS BEEN ADVISED OF THE POSSIBILITY OF SUCH DAMAGES. Any use of the Tool is at user’s sole risk. |
Cisco Intelligent Automation for Networks
Your measurable benefits and return on investment
Thank you for using the Cisco Network Operations Automation Service Benefits Calculator. Below you will find the measureable results based on your environmental inputs. We hope this tool helps you visualize the return you might expect from using this Cisco\92s Intelligent Automation solution which dramatically cuts overhead costs and MTTR.
Cisco NOAS focuses on automating Day 1 and Day 2 operations for your network and unified communications equipment. Cisco NOAS enables network and IP telephony (IPT) operations teams to manage and support complex network environments by combining the Cisco Intelligent Automation solution with Cisco network provisioning and management best practices. The goal of using Cisco NOAS is to reduce MTTR of network issues by introducing automated workflows for troubleshooting tasks and repetitive maintenance procedures.
For More Information
For pricing and engagement information or to learn more about Cisco NOAS please send your query to intelligentautomation@cisco.com. To explore other Intelligent Automation solutions from Cisco, visit us at www.cisco.com/en/US/products/ps11100/index.html