SNA Switching Services (SNASw), like many network technologies that perform a protocol integration function, has characteristics that can make problem resolution difficult. Because the product operates both in an SNA environment as well as an IP environment, it is sometimes necessary to gather information from several sources to debug a particular problem. There are a number of good tools available to help diagnose and resolve any problem you might encounter. However, it is important to understand the specific nature and scope of the problem so that you can determine where to do your analysis.
This guide is designed to provide a strategy for dealing with problems related to SNASw, to explain the tools available to help diagnose problems, and to provide specific actions to take for various types of problems you may encounter. It is in no way meant to replace the IOS Command Reference and Configuration Guides, which should be used to find out more about the snasw commands referenced in this document.
OVERVIEW OF SNASw ENVIRONMENT
SNASw is the Cisco® recommended solution for supporting SNA-related devices and traffic in an IP-based network. SNASw is available as a component of the Cisco IOS® Software and is supported on a wide variety of router platforms.
SNASw implements an Advanced Peer-to-Peer Networking (APPN) branch network node (BrNN). As such, it appears as a network node (NN) to the downstream devices that connect through the node and as an end node (EN) to other upstream APPN nodes. SNASw also supports the Enterprise Extender (EE) transport option that transmits SNA traffic natively using IP/User Datagram Protocol (UDP). With EE, flow control and Layer 4 connection functions are handled by a protocol known as High Performance Routing (HPR)/IP.
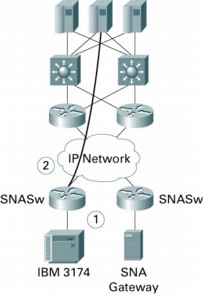
The very nature of the software and its ability to support both SNA and IP transport protocols facilitates network designs that adhere to one of two main topologies: SNASw remote (see Figure 1) and SNASw with Data-Link Switching Plus (DLSw+) (see Figure 2).
Figure 1 Figure 2
SNASw Remote SNASw with DLSw+
There are various connection segments within the network, and this is where problems are likely to be seen and where diagnosis takes place. The type of problem dictates the information that needs to be gathered and from which points in the network information should be obtained. For example, Figure 1 shows a network with HPR/IP as the upstream connection from SNASw. In connection segment 1, a downstream physical unit (PU type 2 or 2.1) connects to an interface on the router using Logical Link Control, Type 2 (LLC2) or Synchronous Data Link Control (SDLC) protocol. Figure 2 shows a network that uses DLSw+ to transport SNA traffic over an IP network. SNASw is used at the data center to provide enhanced redundancy to the mainframe Parallel Sysplex environment. In connection segment 3, the upstream connection from SNASw can be HPR/IP or SNA HPR using LLC2. In connection segment 2, DLSw+ peering connects data center and branch routers. As before, downstream devices connect using LLC2 or SDLC in connection segment 1.
A number of general actions take place in the network to provide data transport services for downstream devices. Figure 3 depicts a typical network with SNASw deployed at the branch using Enterprise Extender (HPR/IP) as the transport protocol for SNA traffic. In this environment, several actions permit connectivity and subsequent data transfer to occur. First, it is common to define the primary NN server and backup NN server as upstream links from SNASw. One link must be in an Active state with a control point (CP)-to-CP session for subsequent connectivity to occur. If the links are not active, then follow the troubleshooting steps outlined in the section Uplink Fails to Connect. Downstream devices also connect to SNASw.
Figure 3
High-Level Data Flows for SNASw
For example, Figure 3 shows the high-level data flows that occur in SNASw as a series of steps. In step 1, a downstream PU 2 establishes an LLC2 connection by initiating a TEST request to a Media Access Control (MAC) address locally defined to SNASw, followed by an eXchange IDentifier (XID). In step 2, SNASw, acting as the Dependent Logical Unit Requestor (DLUR), establishes a DLUR/Dependent LU Server (DLUS) path with the DLUS. SNASw passes a REQACTPU (containing the XID from the downstream PU) over the DLUR/DLUS pipe and the downstream PU and LUs are then activated (System Services Control Point [SSCP]-to-PU/LU sessions via ACTPU/LU from the DLUS). An end user (LU) then requests a session with an application LU, named APPLA, which resides on the APPN EN host. In step 3, SNASw passes the INITSELF or USSLOGON to the DLUS over the DLUR/DLUS pipe. In step 4, the NN server informs the application of the session request and provides a route to the SNASw BrNN that handles the LU. Because a connection network has been defined, in step 5, the EN host is able to establish a direct link to the SNASw router over IP. The LU-to-LU session is then activated and data transfer begins.
This is a very simplistic description of the connectivity actions that are required to establish data transfer in this environment. When troubleshooting, try to determine the specific sequence and point in the flow where your problem occurs and then start your debug activities targeting that particular point.
TROUBLESHOOTING BASICS
Internetworking of IP and SNA can be complex and this particular environment imposes some difficulty because of the historical differences inherent in TCP/IP and SNA networks and the skills required in each area. When faced with a problem that requires detailed analysis, using a standard troubleshooting methodology reduces the time it takes to isolate and resolve the problem.
Troubleshooting Methodology Overview
It is important that you approach any internetworking problem using a problem-solving model. First, establish a clear understanding and definition of the problem. Next, gather all relevant information using the tools and techniques described in this document. After analyzing the information, create an action plan to address the likely cause of the problem. If the symptoms are not resolved, try another action plan or gather additional information that might lead to another conclusion.
The troubleshooting methodology adopted in this document follows these general steps:
• Diagram the problem¾Begin with a detailed diagram of the network. Maintaining accurate diagrams of the physical and logical components and their relationships is important to ensure continued operation and availability. It helps to further illustrate the components involved in the data path specific to the problem at hand.
• Isolate the problem¾Gather detailed information about the problem. This includes configurations, protocols, data paths, and historical performance data. Determine the starting point as well as fault isolation procedures.
• Correct the problem¾Make appropriate hardware, software, or configuration changes to correct the problem.
• Verify that the trouble is corrected¾Perform operational tests to verify that the trouble is corrected.
The troubleshooting steps presented in Troubleshooting SNASw Operational Problems and the example scenarios presented in the appendix, Diagnostic Output Examples, generally follow this methodology in listing typical symptoms and provide associated diagnostics measures.
Tools
SNASw was designed with support in mind. The product includes trace analysis and debugging tools to help you and Cisco diagnose any problem that might be encountered. These tools, in conjunction with various show snasw commands, enable problem diagnosis, isolation, and resolution of most problems. At times, additional trace and debug information, such as that available from IBM hosts or LAN analyzers, is required.
snasw pdlog
SNASw contains its own problem determination logging facility known as the pdlog. This is a cyclic buffer that provides detailed information on recent state transitions, traffic, and events for SNASw. The pdlog is always enabled (cannot be turned off), but the size of the buffer and the type of abbreviated pdlog messages written to the router log is controlled with the snasw pdlog command:
All detailed pdlog records (problem, exception, and informational) are written to the internal pdlog buffer whether snasw pdlog is configured or not. However, the pdlog configuration command determines which level of associated pdlog messages are written to the router log. If not configured, the default is exception, which means that only problem and exception pdlog messages will be seen in the router log.
The buffer-size keyword determines the size of the pdlog buffer (in processor memory). With IOS 12.1 and 12.2, the maximum buffer-size is 16,000 KB. With Cisco IOS Release 12.3 and above, the maximum buffer-size is 64,000 KB. If not coded, the default is a 500-KB buffer.
You can display information from the pdlog buffer at the router console using the show snasw pdlog command:
You can also copy the entire pdlog file to a file server or flash using the snasw dump command (which is explained later in this document).
Note: The snasw pdlog is a very useful tool, and should be one of the first places you look when diagnosing a problem. The pdlog messages you see in the router log have an identifier that can be used to examine the detailed entry in the pdlog cyclic buffer. This detailed entry often contains resource names, session identifiers, sense codes, and so on that can lead you directly to the next step in resolving the problem.
snasw dlctrace
The snasw dlctrace command traces frames arriving and leaving the SNASw stack within IOS:
This trace facility is designed for use by network support personnel to troubleshoot connectivity problems. The trace can be stopped and started using the snasw stop|start dlctrace command.
The buffer-size keyword determines the size of the dlctrace buffer (in processor memory). With Cisco IOS Releases 12.1 and 12.2, the maximum buffer-size is 16,000 KB. With Cisco IOS Release 12.3 and above, the maximum buffer-size is 64,000 KB. The larger the buffer you configure, the better the chance that important trace records will not be lost. If not coded, the default is a 500-KB buffer.
Unless a problem requires you to see application data in the trace, it is recommended that you configure frame-size auto-terse. This trims all application data from the trace records, allowing more trace records to fit within the cyclic buffer. You can also filter which records are written to the buffer (thus allowing a longer duration of trace) by using the snasw dlcfilter configuration command.
You can use the show snasw dlctrace command to examine the dlctrace records (they are printed to the router log), but it is often easier to copy the dlctrace file to a file server (see the snasw dump command later in this document).
Note: The snasw dlctrace is a very powerful tool. Because it has very little overhead (between 2 and 8 percent), Cisco recommends that it be enabled when testing new implementations. Some customers also choose to leave it enabled in production to facilitate collecting documentation in the event that a problem is encountered.
snasw ipstrace
The snasw ipstrace command, or interprocess signal trace, is used for debugging internal SNASw software problems. It copies internal signal flows into a cyclic memory buffer, which can affect router performance by as much as 20 percent. Therefore, you should use this command only as directed by Cisco service personnel:
The impact on performance can be reduced by configuring the snaswipsfilter command prior to enabling the snasw ipstrace command. This allows you to specify only those internal components identified by Cisco personnel as being related to the problem at hand.
The buffer-size keyword determines the size of the ipstrace buffer (in processor memory). With Cisco IOS Releases 12.1 and 12.2, the maximum buffer-size is 16,000 KB. With Cicsco IOS Release 12.3 and above, the maximum buffer-size is 64,000 KB. The larger the buffer you configure, the better the chance that important trace records will not be lost. If not coded, the default is a 500-KB buffer.
After the trace has been captured, it can be copied to a server using the snasw dump command covered in the next section of this document. This enables the Cisco engineer to perform additional processing of the data contained in the file. There is also a show snasw ipstrace command, but its use is not recommended except as advised by a Cisco engineer.
There is an abbreviated version of the ipstrace called a summary-ipstrace. This trace is always enabled (cannot be turned off), but the size of the buffer and the file url are specified via the snasw summary-ipstrace command. Because of its limited information, the summary-ipstrace is rarely used.
The snasw dump command copies the pdlog and dlc, ips, and summary-ips traces from their internal buffers to an external file server or to Flash memory. The command uses the file destinations previously specified using the file keyword on the related snasw dlctrace, snasw ipstrace, and snasw pdlog commands. For example, to copy the pdlog to a Trivial File Transfer Protocol (TFTP) server, you would use the following configuration:
snasw pdlog problem buffer-size 10000 file tftp://myhost/path/pdlogfilename
If no file was specified on the configuration and you issue snasw dump dlctrace or ipstrace or summary-ipstrace or pdlog, then you will be prompted for the file name. However, snasw dump all does not prompt for file names (they must have been previously configured for the command to succeed).
The files that are generated for the pdlog and dlctrace (in format detail) may be up to twice as large as the configured buffer-size. This is because the binary data in the buffer is converted to ascii text and then written to the file. In Cisco IOS Releases 12.1 and 12.2, buffer-size was limited to 16 MB to avoid the dumped ascii file size from exceeding the TFTP maximum size of 32 MB. Beginning with Cisco IOS Release 12.3, SNASw allows buffer-size to be specified to a maximum value of 64 MB. If TFTP is the transport protocol being used, SNASw copies the first 32 MB of ascii text to the configured file name and then copies subsequent 32-MB files with .01, .02, etc. appended to the name.
The files that are generated for the dlctrace (in format analyzer which is SnifferPro™-compatible) and ipstrace consist of binary data, so their size is the same or less than the configured buffer-size.
snasw msgdump
The snasw msgdump command can be used to enable automatic dumping of the dlctrace, ipstrace, and pdlog files (and optionally to execute a write core command) when a specified SNASw pdlog message is written to the router log:
snasw msgdump pdlog_message_id [writecore]
This can be very helpful to trigger trace information capture following a particular event, and is usually configured at the direction of Cisco support when trying to collect documentation for a service request. This is a one-time-only trigger-you must remove snasw msgdump from the configuration (using the no form of the command) and add it in again to re-enable the automatic dumping.
When using snasw msgdump, it is important that you correctly configure the file keyword on the respective snasw pdlog, snasw dlctrace, and snasw ipstrace commands, otherwise when the msgdump is triggered, the files will be lost. Also, you may find it helpful to configure the timestamp keyword, which appends the time the file was dumped to the end of the file name. This allows you to know when the file was written and to avoid the file copy from failing because of a duplicate file name.
An enhancement was made to the snasw msgdump processing in Cisco IOS Release 12.3 to add SNA alert support. In order to take advantage of this, SNASw must have an Alert focal point. Use the show snasw node command to see if there is a cpname in the Alert focal point field. If not, and if SNASw has an active Network Node Server (NNS), on the NetView host you can issue the command:
When the SNASw router (or its NNS) is in NetView's alert sphere of control, then when a msgdump event is triggered, SNASw will send an MDS-MU alert. The alert will have an identifier of x'DAED5B0B', and will contain the pdlog entry which triggered the msgdump. This informs the network operator that a monitored event has occurred (so they know to retrieve the pdlog/trace files dumped by SNASw), and can trigger host automation to collect VTAM traces or take other appropriate action. This is especially useful when tracking down DLUR/DLUS-related issues.
If writecore is specified, a write core command is attempted whenever the msgdump condition is triggered (in addition to the dumping of the pdlog, dlc and ips traces). The write core command is issued using the existing configuration parameters: server host, transfer protocol, user name, and password. For the write core command to be successful, the exception dump statement must be configured to specify the destination server. Cisco also recommends that the compress option be used for the core file name in the exception core command to save space on the server.
exception dump <host name or address>
exception core-file <core file name> compress
If no exception protocol is configured, the write core operation would be attempted using tftp; the core file is written under the /tftpboot directory. If ftp is specified for exception, then the user name and password information must be configured:
ip ftp user <userid>
ip ftp password <password>
exception protocol ftp
Note: The user must be aware that the write core operation puts a load on the router and may momentarily cause some network disruption. Therefore, the writecore option should be used only at the explicit request from Cisco TAC.
snasw arbdata
The HPR protocol in SNASw utilizes the Adaptive Rate Based (ARB) algorithm to monitor the available bandwidth of the network and obtain the best throughput for HPR connections. When performance problems are detected with HPR connections, it is sometimes necessary to gather real-time values of ARB algorithm variables as the data flows through the HPR connection. This can be accomplished by issuing:
snasw start | stop arbdatalocal-tcid
Output from the start form of this command is written to the router log and can consist of many lines of text per second, so it is best to make sure that you have configured logging buffered and no logging console before issuing this command. You issue the stop form of the command to stop the messages from being written to the router log.
Note: Interpreting output from the snasw arbdata command requires a detailed understanding of the HPR Architecture and ARB algorithm. Also, this command can result in a high volume of messages being written to the router log. For these reasons, Cisco recommends this command only be used under the direction of Cisco service personnel.
snasw event
By default, only defined links and DLUS events are sent to the pdlog console. To get more information for debug purposes, use the snasw event global configuration command:
snasw event [cpcp] [dlc] [implicit-ls] [port]
SNASw Debug Commands
Output from Cisco IOS debug commands provides a valuable source of information and feedback concerning state transitions and functions when assessing problems. However, the snasw dlctrace and snasw ipstrace commands should be favored over debug snaswdlc and debug snasw ips commands in an SNASw environment. The snasw trace commands write directly to a cyclic buffer rather than to the router log, thereby avoiding flooding and providing flexibility in accessing the trace records.
Other debug commands, such as debug dlsw or debug llc, may be useful in environments where DLSw+ is used in conjunction with SNASw or to trace activity at the interface level.
Core Files
If your router crashes, it is sometimes useful to obtain a full copy of the memory image (called a core dump) to identify the cause of the crash. Not all crash types produce a core dump. The following example configures a router to use FTP to dump a core file named dumpfile to the FTP server at 172.17.92.2 when it crashes:
61865984 bytes copied in 321.672 secs (192728 bytes/sec)
cheney#
You might be requested to perform this action by the Cisco Technical Assistance Center (TAC) for debug purposes even if your router did not crash.
Note: The snasw ipstrace and snasw dlctrace commands provide additional important debug information for the development engineers. If these trace facilities are activated, stop them by issuing snasw stop dlctrace and snasw stop ipstrace before forcing wr core. If the traces are not stopped prior to the wr core command, some corruption of trace records can occur.
Host Commands and Traces
In some cases, it may be necessary or helpful to perform traces and displays from the host in addition to traces at the SNASw router. This section provides examples of various host-based trace facilities and associated job control information.
VTAM Internal Trace
Because VTAM is a NNS and Dependent Logical Unit Server (DLUS) for SNASw, it is often necessary to collect a VTAM Internal Trace (VIT) to diagnose problems. The VIT has many options and can be collected in several ways (GTF or Data Space), so it is best to refer to the VTAM Diagnosis Guide (a licensed manual) for details.
Collecting Buffer and CCW Traces Using the Generalized Trace Facility
Use JCL similar to the following statements to invoke the generalized trace facility (GTF):
If you need to get a channel command word (CCW) trace, start the GTF and enter these statements where addr is the address to trace, len is how much of each datastream to collect (the default is 256), and num ccws is the number of CCWs to collect:
s gtf
r nn,trace=siop,iop,ccwp
r nn,io=sio=<addr>,ccw=(data=<len>,ccwn=<num ccws>),end
r nn,u
S GTF
IRR813I NO PROFILE WAS FOUND IN THE STARTED CLASS FOR 214
GTF WITH JOBNAME GTF. RACF WILL USE ICHRIN03.
$HASP100 GTF ON STCINRDR
IEF695I START GTF WITH JOBNAME GTF IS ASSIGNED TO USER
++++++++
$HASP373 GTF STARTED
IEF403I GTF - STARTED - TIME=13.32.44
AHL121I TRACE OPTION INPUT INDICATED FROM MEMBER GTFPARM OF PDS
SYS1.PARMLIB
TRACE=RNIO,USR
00010000
AHL103I TRACE OPTIONS SELECTED --USR,RNIO
*11 AHL125A RESPECIFY TRACE OPTIONS OR REPLY U
R 11,TRACE=SIOP,IOP,CCWP
IEE600I REPLY TO 11 IS;TRACE=SIOP,IOP,CCWP
TRACE=SIOP,IOP,CCWP
AHL138I SIO TRACE OPTION REPLACED BY SSCH TRACE OPTION
IEE600I REPLY TO 12 IS;IO=SIO=400,CCW=(DATA=1024,CCWN=50),END
IO=SIO=400,CCW=(DATA=1024,CCWN=50),END
AHL103I TRACE OPTIONS SELECTED --IO=SSCH=(0400)
AHL103I CCW=(SI,CCWN=50,DATA=1024)
13 AHL125A RESPECIFY TRACE OPTIONS OR REPLY U
R 13,U
IEE600I REPLY TO 13 IS;U
Recreate your problem and then stop the trace facility. After you have trace data, you can format the trace information using interprocess communications subsystem (IPCS). The following example shows sample JCL to format a buffer trace with IPCS:
SETDEF DSNAME('SYS4.TRACE') LIST NOCONFIRM NOPRINT
GTF USR(ALL) CCW(SI) SSCHIO(400)
END
TROUBLESHOOTING SNASw OPERATIONAL PROBLEMS
Problems related to SNASw can be categorized into several basic areas:
• Upstream link activation problems
• Downstream device activation problems
• DLUR/DLUS problems
• Session failures
• Performance-related problems
In addition, problems can be categorized as being associated with particular types of equipment or issues with particular data paths. Because of similarities between symptoms and problems for these different situations, this document addresses these diagnostic topics collectively.
Begin troubleshooting by following the process suggested in the section Troubleshooting Methodology Overview. The diagnostics summaries in this section address the troubleshooting process using three basic stages:
1. Identifying symptoms
2. Isolating problems
3. Resolving problems
Each diagnostic section includes suggestions for identifying and isolating problems. It is assumed that relevant network topology diagrams have been obtained for reference prior to troubleshooting. Specific diagnostic output is included to illustrate how network entities react to failures and how to discern specific failures. Sample output for some of the commands is shown in Appendix B, Diagnostic Output Examples. If you need additional help in debugging or analyzing a particular problem, please contact the Cisco TAC at www.cisco.com.
Uplink Fails to Connect
If the uplink fails to connect, follow these troubleshooting steps:
Step 1. Verify the status of the defined uplinks using the sh snasw link command.
Step 2. Use show snasw pdlog detail all | includelinkname to see if there are any entries specific to this link name in the pdlog. If so, you will need to show or dump the entire pdlog and find out which records apply.
Step 3. A defined uplink will attempt to establish connection when SNASw is started if the nostart parameter is not used. Issue the sh run | include snasw command to see the configuration for SNASw.
Step 4. If the link definition uses ip-destip-address, then the link is defined for HPR/IP EE. Verify IP connectivity to the host by issuing an extended ping originating from the interface associated with the hpr-ip port.
Step 5. If the ping fails, continue troubleshooting the IP connectivity issue using commands such as trace, sh ip ospf. Check neighbor connectivity to the host, Open Shortest Path First (OSPF) definitions on the host, and routing to the Virtual IP Addressing (VIPA) address.
Step 6. If the ping succeeds, then check the interaction between Virtual Telecommunications Access Method (VTAM) and the TCP/IP stack, including that vtam TCPNAME points to the correct stack (see d net,vtamspts) and VTAM external communication adapter (XCA) major node is set for medium=HPRIP.
Step 7. If the upstream link is SNA LLC2, then begin troubleshooting connectivity at Layer 2.
Step 8. Verify that the remote MAC and remote service access point (SAP) is defined on the snasw link.
Step 9. Trace the LLC2 layer using debug llc2 state and debug llc2 packet. Be sure to set access-list 1100 to limit debug output.
Step 10. You can also use the SNASw trace facility to trace the SNASw DLC layer. Issue snasw dlctrace. Try the link again with the trace on. Display the trace using the sh snasw dlctrace or snasw dump dlctrace command.
Step 11. Examine and collect system or netlog information from the host network node.
Step 12. Use the information gathered to diagnose the cause of the failure.
Step 13. Check the VTAM definitions, node type, and CPNAME.
Downstream PU Does Not Activate
The downstream PU may be having trouble trying to connect to SNASw or the problem may be upstream of SNASw for DLUR PUs. Follow these troubleshooting steps:
Step 1. Issue the sh snasw link command.
Step 2. Examine the pdlog for error or exception data related to this link or PU.
Step 3. Issue the sh snasw dlus command. The DLUS will be active if, and only if, there is DLUR traffic.
Step 4. Issue the sh snasw pu command.
Step 5. Check to see if other PUs have established connectivity through this node.
Step 6. Gather host information, including D NET,ID=puname; D NET,DLURS.
Step 7. Issue the sh snasw port command. Determine the port through which the downstream PU connects and verify that it is active.
Step 8. If the port is not active, troubleshoot as a configuration problem or interface problem.
Step 9. Check that the MAC/SAP on the downstream device matches that defined for SNASw on interface.
Step 10. Ensure that you have enabled port event notifications using the snasw event dlc implicit-ls port command. This causes messages to be written to the router log for certain events.
Step 11. Examine snasw dlctrace data.
Problem Establishing Connection for Downstream End Node
You may encounter a problem with an APPN device downstream from SNASw. After you have established that no physical or lower layer problem exists, begin troubleshooting the connection establishment sequence using these steps:
Step 1. Issue the sh snasw link command.
Step 2. Try starting the link on the downstream device and observe pdlog messages. If there is a problem with the XID between the downstream device and snaswitch, the detailed pdlog message will have additional information, including the last sent and received XIDs.
Step 3. Check that the MAC/SAP on the downstream device matches that defined for SNASw on interface.
Step 4. Verify the node name and node type.
Step 5. Trace the link activation using the snasw dlctrace command.
Step 6. Examine the snasw dlctrace data.
User Cannot Connect to Application
The reason an end user cannot connect to the application may be due to a network problem in establishing a dynamic link to the EN host. In this case, use the following troubleshooting steps:
Step 1. Issue the sh snasw link command. Determine whether an active link has been established to the EN data host.
Step 2. If no link exists, perform snasw dlctrace on the upstream port.
Step 3. Verify the connection network definition (that is, the virtual routing node [VRN] name) between the SNASw and host definitions.
Step 4. Observe any error messages in pdlog, in the upstream NN server, and at the destination host.
Step 5. Examine information gathered for the cause of failure.
Intermittent Session Failures
Intermittent session failures are sometimes hard to troubleshoot, particularly if you cannot readily recreate the problem. You can use the snasw msgdump command to trigger a dump of trace files when a particular message occurs. If the problem is repeatable, follow these steps:
Step 1. Determine any messages related to the last occurrence of a problem.
Step 2. Use snasw msgdump <msg-id> to trigger a dump of dlctrace information on failure.
Step 3. Examine the snasw dlctrace data.
Poor Performance
There are many reasons that an end user may experience performance problems or observe high response time or low throughput. It is important to determine the correct cause of the poor performance. Try to determine whether poor performance results from excessive traffic rates (lack of router capacity) or if it is related to specific session parameters or connection types, using the following steps:
Step 1. Issue the sh snasw port det command.
Step 2. Examine the router for high CPU utilization (see the next section).
Step 3. Examine any historical and trending information that is available (Cisco Internet Performance Monitor data, for example).
Step 4. Examine the links along the path between the user and the host. Check the utilization and quality of service (QoS) settings.
Step 5. Issue the sh interface command and look for dropped packets.
Step 6. If using HPR, issue the sh snasw rtp detail command.
Step 7. Work with a specific user to isolate performance.
Step 8. Gather session information using snasw dlctrace.
Step 9. If using HPR, and as advised by Cisco service personnel, gather snasw arbdata log messages.
High CPU Utilization
If the router CPU utilization is above 95 percent, the performance of the router may be affected, and packets can be delayed or dropped. It is important to investigate the cause to determine if there is extraneous traffic, a misconfiguration, a need for a more powerful router platform, or a possible software defect. If you have access to the router and can enter show commands, follow these steps to determine if SNASw is the cause of the high CPU:
Step 1. Issue the show processes cpu command. If process switched IP traffic is causing problems, then the IP Input process will reflect this in the output. In this situation it would be important to collect the output from the show interfaces, show interfaces stat, and show interface switching commands to further diagnose the problem.
Step 2. If the high CPU is attributed to the process SNA Switch, then SNASw is using high CPU.
Step 3. Issue the show snasw statistics command to determine which SNASw component is responsible.
Step 4. Collect dlctrace, ipstrace, and sniffer traces and look for patterns. The ipstrace in particular can be useful in detecting software loops within SNASw.
Step 5 It may be that the traffic load is simply beyond the capability of the platform in use. See capacity planning and performance data at http://www.cisco.com/en/US/tech/tk331/tk336/technologies_design_guide09186a0080214a16.shtml.
SNASw CHARACTERISTICS AND KNOWN ISSUES
In some cases, the normal mode of operation is not immediately understood and a problem is perceived when there really is none. One particular case is observation of messages indicating a loss of DLUS connection. The DLUS connection is taken down as a normal course of operation if there are no downstream DLUR PUs that require the services of the DLUS. Therefore, the loss of connectivity to the DLUS does not always indicate a problem. Also, repeated activation and deactivation of the DLUR/DLUS session pipe may be the result of a single PU failure.
Another case is that of a REQACTPU failure. It may be that the PU is simply not defined to VTAM or is inactive rather than in a connectable state. Or it could be that the PU definition has the wrong control point name or station identifier. Always check for basic configuration problems before embarking on a full analysis session. In many cases, a quick look with the sh snasw pdlog command can determine the cause of the failure.
Session Pacing
You may encounter performance issues with interactive traffic if batch traffic is allowed to operate unpaced or with too large a variable pacing window. Cisco recommends that batch devices such as printers be configured with a fixed pacing window of 7. You can also adjust the maximum receive pacing window for variable pacing using the max-pacing-window parameter on the snasw cpname configuration command:
For more information, refer to the SNASw documentation listed in Appendix A, Related Publications.
Production Recovery and Data Collection
Murphy's Law states, "If anything can go wrong, it will," and furthermore, it certainly will happen at the most inopportune time. For this reason, it is useful to establish a basic procedure for off-hours operations staff to follow in the event that a problem arises and no one is available to perform detailed troubleshooting.
In many cases, stopping and restarting SNASw on a specific router will clear up a problem. This can be done with several commands. Use the snasw stop command to terminate all sessions, stop all ports and links, and shut down SNASw. To start SNASw, use the snasw start privileged EXEC command. Before recycling SNASw, Cisco recommends that operations staff collect the following information at a minimum:
• show tech
• snasw dump pdlog
• snasw dump dlctrace
APPENDIX A: RELATED PUBLICATIONS
For Cisco publications, if you are using a version of Cisco IOS different than what is referenced below, you can find a matching version of the documentation by searching for the title at http://www.cisco.com/public/pubsearch.html.
IST1188I VTAM CSV2R8 STARTED AT 09:28:08 ON 10/29/01
IST1189I VERIFYCP = NONE VFYRED = YES
IST1189I VFYREDTI = OFF VOSDEACT = NO
IST1189I VRTG = NO VRTGCPCP = YES
IST1189I VTAMEAS = 32001 WARM = NO
IST1189I XCFINIT = YES XNETALS = NO
IST314I END
APPENDIX C: TROUBLESHOOTING COMMAND SUMMARY
Stopping SNASw and SNASw Ports and Links
Unless otherwise defined with the nostart operand, SNASw and SNASw port and link definitions are started automatically when SNASw starts. To stop SNASw or to stop SNASw ports and links when making configuration changes or when resetting the ports or links, use one of the commands in Table 1 in privileged EXEC mode, as needed.
Table 1. SNASw Start and Stop Commands
Command
Purpose
Router#snasw start | stop
Activates/Deactivates SNASw
Router#snasw start | stop linklinkname
Activates/Deactivates the specified SNASw link
Router#snasw start | stop portportname
Activates/Deactivates the specified SNASw port
Note: Removing a CP name definition stops SNASw and deletes other SNASw configuration statements.
Verifying SNASw
To verify that you have connectivity between SNASw and other nodes supporting the APINGD transaction program, issue the ping sna command.
Monitoring and Maintaining SNASw
You can monitor the status and configuration of SNASw by issuing any of the commands listed in Table 2 in privileged EXEC mode.
Initiates an Advanced Program-to-Program Communications (APPC) session with a named destination LU to run the APING transaction program to check network integrity and timing characteristics
Controls logging of messages to the console and the SNA problem determination log cyclic buffer
APPENDIX D: SENSE DATA
Messages may include "sense" data to describe particular types of failures and causes. Table 5 lists common sense codes and their meanings.
Table 5. Native IP DLC Link Activation Failure Sense Data
Error Description
Sense Data
The link specified in the RSCV is not available.
X'08010000'
The limit for null exchange identifier (XID) responses by a called node was reached.
X'0809003A'
A BIND was received over a subarea link, but the next hop is over a port that supports only HPR links. The receiver does not support this configuration.
X'08400002'
The contents of the DLC Signaling Type (X'91') subfield of the TG Descriptor (X'46') control vector contained in the RSCV were invalid.
X'086B4691'
The contents of the IP Address and Link Service Access Point (LSAP) Address (X'A5') subfield of the TG Descriptor (X'46') control vector contained in the RSCV were invalid.
X'086B46A5'
No DLC Signaling Type (X'91') subfield was found in the TG Descriptor (X'46') control vector contained in the RSCV.
X'086D4691'
No IP Address and Link Service Access Point Address (X'A5') subfield was found in the TG Descriptor (X'46') control vector contained in the RSCV.
X'086D46A5'
Multiple sets of DLC signaling information were found in the TG Descriptor (X'46') control vector contained in the RSCV. IP supports only one set of DLC signaling information.
X'08770019'
Link Definition Error: A link is defined as not supporting HPR, but the port only supports HPR links.
X'08770026'
A called node found no TG Identifier (X'80') subfield within a TG Descriptor (X'46') control vector in a prenegotiation XID for a defined link in an IP network.
X'088C4680'
The XID3 received from the adjacent node does not contain an HPR Capabilities (X'61') control vector. The IP port supports only HPR links.
X'10160031'
The RTP Supported indicator is set to 0 in the HPR Capabilities (X'61') control vector of the XID3 received from the adjacent node. The IP port supports only links to nodes that support RTP.
X'10160032'
The Control Flows over RTP Supported indicator is set to 0 in the HPR Capabilities (X'61') control vector of the XID3 received from the adjacent node. The IP port supports only links to nodes that support control flows over RTP.
X'10160033'
The LDLC Supported indicator is set to 0 in the HPR Capabilities (X'61') control vector of the XID3 received from the adjacent node. The IP port supports only links to nodes that support LDLC.
X'10160034'
The HPR Capabilities (X'61') control vector received in XID3 does not include an IEEE 802.2 LLC (X'80') HPR Capabilities subfield. The subfield is required on an IP link.
X'10160044'
Multiple defined links between a pair of switched ports is not supported by the local node. A link activation request was received for a defined link, but there is an active defined link between the paired switched ports.
X'10160045'
Multiple dynamic links across a connection network between a pair of switched ports is not supported by the local node. A link activation request was received for a dynamic link, but there is an active dynamic link between the paired switched ports across the same connection network.
X'10160046'
Link failure.
X'80020000'
Route selection services has determined that no path to the destination node exists for the specified COS.
X'80140001'
For other sense code information, issue the command SENSExxxxxxxx, where xxxxxxxx is the sense code from the NetView console, or refer to the IBM SNA Formats manual.
[an error occurred while processing this directive]