-
Cisco CallManager Serviceability Administration Guide, Release 4.1(3)
-
Preface
-
Introduction
-
Alarm Configuration
-
Alarm Definitions
-
Alarm Information
-
Trace Configuration
-
Trace Collection Configuration
-
Trace Analysis Configuration
-
Q.931 Translator
-
Troubleshooting Trace Setting Configuration
-
Service Activation
-
Control Center
-
Real-Time Monitoring Configuration
-
QRT Viewer
-
Serviceability Reports Archive Configuration
-
CDR Analysis and Reporting
-
CAR System Configuration
-
CAR Report Configuration
-
CAR User Reports Configuration
-
CAR System Reports Configuration
-
CAR Device Reports Configuration
-
CDR Search Configuration
-
Export CDR/CMR Records Configuration
-
Microsoft Performance
-
Bulk Trace Analysis
-
Overview of CiscoWorks2000
-
Path Analysis Configuration
-
System Log Management Configuration
-
Cisco Discovery Protocol Support Configuration
-
Cisco Secure Telnet Configuration
-
Show Command Line Interface
-
Simple Network Management Protocol Configuration
-
Understanding CAR Reports
-
Index
-
 Feedback
Table Of Contents
Starting the Microsoft Performance Program
Viewing Performance Statistics
Microsoft Performance
This chapter provides procedural information for using the Microsoft Performance application with Cisco CallManager.
This chapter contains the following topics:
•
Starting the Microsoft Performance Program
•
Starting the Microsoft Performance Program
You can use the Microsoft Performance application to monitor various conditions on a Cisco CallManager system. For example, you can find the number of calls in progress on a particular Cisco CallManager node at any time or the number of calls attempted on a Cisco CallManager system.
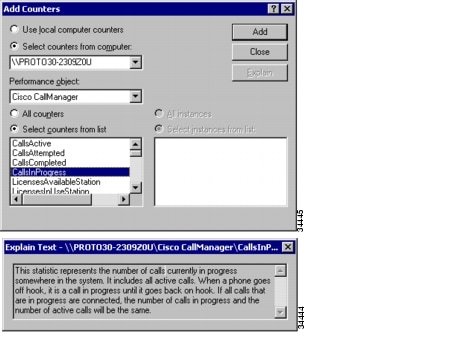
Setting up Performance can yield statistics that are customized to reflect your Cisco CallManager system. For example, you may use the information that Performance returns to manage traffic on the system by monitoring the number of calls in progress at any particular time. (See Figure 23-2.)
This section describes how to start the Performance tool and add Cisco CallManager object counters for monitoring.
Procedure
Step 1
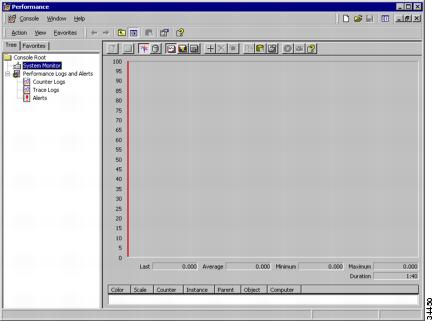
The Performance window displays (Figure 23-1).
Figure 23-1 Windows 2000 Performance Monitoring Tool
Step 2
Figure 23-2 Set Up Performance Monitoring
Step 3
Step 4
Step 5
Step 6
Related Topics
•
Viewing Performance Statistics
The statistical data that is retrieved through Performance provides the information that you need for analysis and interpretation of any local or remote Cisco CallManager system. You may choose specific counters to return data describing changing activity levels in your system, or you may choose to react as events occur.
Performance visually formats the statistical data to facilitate your quick comprehension of the state of the system. Using the visual formats provided, you can display Cisco CallManager data in graphical, histogram, or report form.
This section describes how to report Cisco CallManager performance statistics.
Procedure
Step 1
The Performance graphical interface (Figure 23-1) displays.
Step 2
Step 3
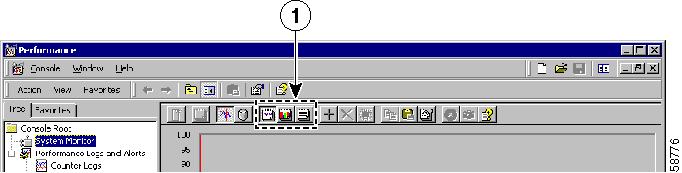
Figure 23-3 View Report Icons
Related Topics
•
Extending Your Data Display
Each report form offers a different visual rendition of the statistical data. You can repeat the process to choose the most effective display.
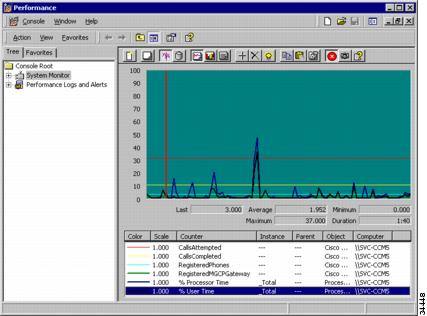
You can add counters from other objects to see how dynamic data affects your Cisco CallManager data. For purposes of illustration, Figure 23-4 shows active operating system conditions with inactive Cisco CallManager data. When your Cisco CallManager data is added, you can interpret that information in the context of any number of system counters.
By combining standard counters with the Cisco CallManager criteria, you get a clear picture of your systems, so you can manage them more efficiently.
Figure 23-4 Line Graph of Static Call Data