-
Cisco CDA Visual Quality Experience Application User Guide, Release 3.0
-
Preface
-
Chapter 1: Introduction to Cisco CDA Visual Quality Experience Application
-
Chapter 2: Getting Started with the VQE Startup Configuration Utility
-
Chapter 3: Using the VQE Channel Provisioning Tool
-
Chapter 4: Using the VQE-S Application Monitoring Tool
-
Chapter 5: Troubleshooting VQE Software Components
-
Chapter 6: Configuring VQE Server and VQE Tools
-
Appendix A: VQE, System, and Network Parameters
-
Appendix B: Using Net-SNMP
-
Appendix C: VQE System Messages
-
Appendix D: Manual Initial VQE System Configuration
-
Appendix E: Configuring DHCP and DNS Servers for VCDS
-
 Feedback
Table Of Contents
Using the VQE-S Application Monitoring Tool
Logging in to and Navigating in VQE-S AMT
Monitoring the Health of the VQE-S Processes
Viewing Channel Configuration and Status
Monitoring Unicast Retransmission and RCC
Viewing Error Repair and RCC Configuration
Viewing Error Repair and RCC Statistics
Monitoring Multicast Load Balancer
Using the VQE-S Application Monitoring Tool
This chapter describes how to use Cisco VQE-S Application Monitoring Tool (VQE-S AMT or AMT). The tasks that you can perform with VQE-S AMT are listed in Table 4-1.
Note
VQE-S AMT supports configuration capabilities for logging levels and debugging options. However, the configured values do not persist when AMT is restarted.
Logging in to and Navigating in VQE-S AMT
Before logging into VQE-S AMT, you need a valid Linux username and password on the Cisco CDE110 hosting AMT. The username does not have to belong to any special group. Creation of the username is the responsibility of the Cisco CDE110 system administrator.
VQE-S AMT supports two web browsers: Microsoft Internet Explorer version 6.0 or later, and Mozilla Firefox version 2.0 or later. The minimum screen resolution required for VQE-S AMT is 1024 x 768 pixels.
VQE-S AMT uses secure HTTPS. Access by multiple simultaneous browsers is supported.
To display the Channels Status Summary graph of active, inoperative, and inactive channels in the AMT VQE-S Status window, Adobe Flash Player must be installed on the computer that hosts the browser accessing AMT. Adobe Flash Player is free and can be found at this URL:
http://get.adobe.com/flashplayer/
To login to VQE-S AMT, follow these steps:
Step 1
https://ip_addressor
https://fully_qualified_domain_nameThe AMT login dialog box is displayed.
Step 2
Step 3
If the username and password are valid, the AMT VQE-S Status window is displayed.
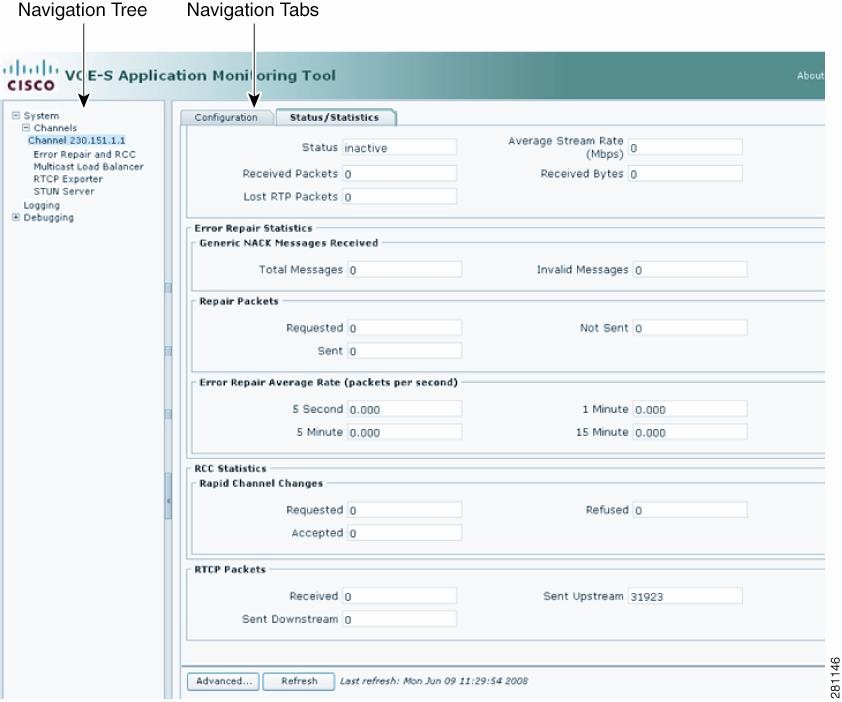
Figure 4-1 shows the VQE-S AMT navigation controls and buttons.
Figure 4-1 VQE-S AMT Navigation
VQE-S AMT (Figure 4-1) provides these controls and buttons for navigating and displaying VQE data:
•
–
–
•
•
•
Monitoring the Health of the VQE-S Processes
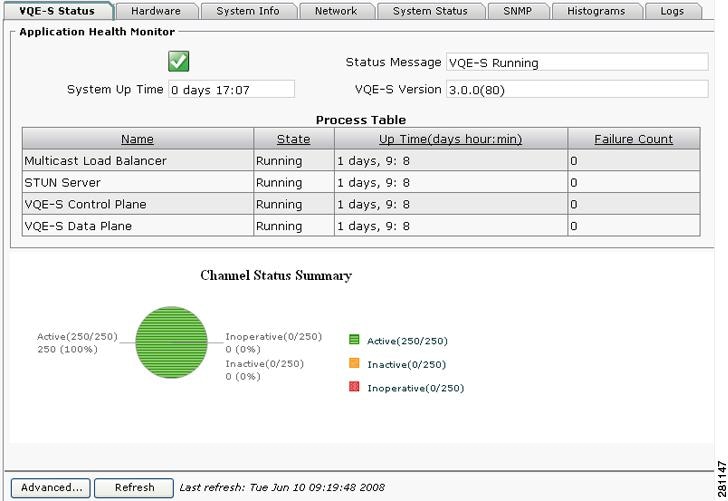
When you click the System node in the navigation tree and the VQE-S Status tab, VQE-S AMT displays the VQE-S Status window (Figure 4-2). The Application Health Monitor and a Channel Status Summary are displayed in the VQE-S Status window.
Figure 4-2 VQE-S Status Window
In the Application Health Monitor, a green icon with a checkmark indicates the VQE-S system is running and healthy. A red icon with an X indicates one or more problems with the VQE-S processes.
Using the Application Health Monitor, you can view the following status information:
•
•
•
•
–
–
–
–
In the Process Table, Failure Count is the number of times the process has failed and been restarted by VQE-S Process Monitor. Process Monitor is responsible for starting and monitoring the preceding processes.
The Channels Status Summary section provides the number of and a graph for active, inoperative, and inactive channels.
In addition to the VQE-S Status tab, you can get information on the VQE-S system on the five other tabs. Table 4-2 lists the information that is available from each tab accessible from the System node.
Viewing Channel Configuration and Status
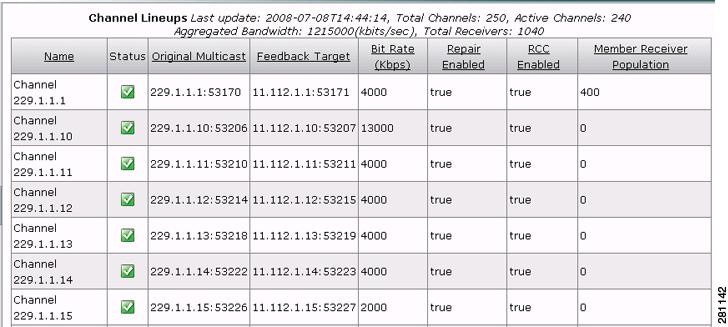
When you click the Channels node in the navigation tree, VQE-S AMT displays the Channel Lineups window (Figure 4-3).
Figure 4-3 Channel Lineups Window
Using the Channel Lineups window, you can do the following:
•
•
•
In Figure 4-3, the channel-lineup summary data indicates when the lineup was last updated (for example, with VCPT) and provides totals for all channels and active channels as well as aggregated bandwidth and total receivers:
 Last update: 2007-08-06T14:15:31, Total Channels: 10, Active Channels: 9
Aggregated Bandwidth: 88000 (kbits/sec), Total Receivers: 0
The Channel Lineups window has the same information that is defined for channels using VCPT but has the following additions. For information on the other data that appears in the Channel Lineups table, see Table 3-3 on page 3-8.
•
–
–
–
•
Viewing Channel Configuration
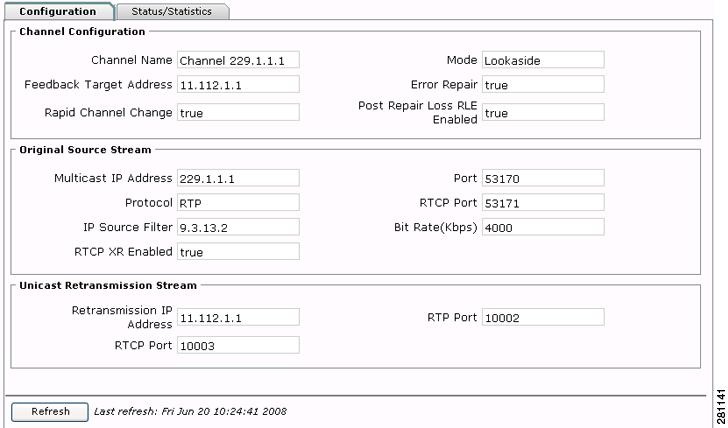
When you click on a channel name in the navigation tree and then click the Configuration tab, VQE-S AMT displays the Channel Configuration window (Figure 4-4).
Figure 4-4 Channel Configuration Window
The Channel Configuration window has the information listed in Table 4-3.
Viewing Channel Statistics
When you click on a channel name in the navigation tree and then click the Statistics tab, VQE-S AMT displays the Channel Statistics window (Figure 4-5).
Figure 4-5 Channel Statistics Window
The Channel Statistics window has the information listed in Table 4-4.
Monitoring Unicast Retransmission and RCC
Note
You can use VQE-S AMT to view Error Repair and RCC statistics.
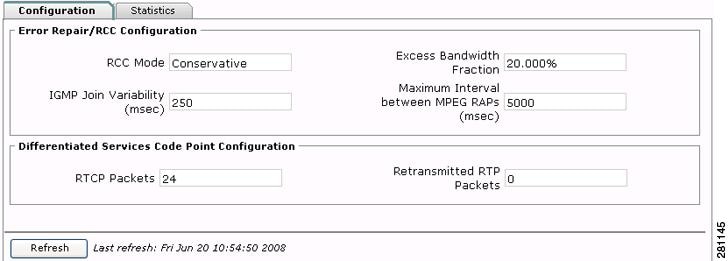
Viewing Error Repair and RCC Configuration
When you click Error Repair and RCC in the navigation tree and click the Configuration tab, VQE-S AMT displays the Error Repair and RCC Configuration window (Figure 4-6).
Figure 4-6 Error Repair and RCC Configuration Window
The Error Repair and RCC Configuration window has the information listed in Table 4-5. Each of the parameters listed in the table can be configured with the VQE Configuration Management System. For information on configuring VQE-S, see Chapter 6, "Configuring VQE Server and VQE Tools."
Table 4-5 Error Repair and RCC Configuration
Error Repair/RCC Configuration
RCC Mode
RCC mode can be aggressive or conservative. This value is configured with the vqe.vqes.rcc_mode parameter in VCDB. For information on this parameter, see Table A-3 on page A-5.
IGMP Join Variability (msec)
Amount of variability (in milliseconds) between the fastest and slowest IGMP joins for RCC. This value is configured with the vqe.vqes.igmp_join_variability parameter. For information on this parameter, see Table A-3 on page A-5.
Excess Bandwidth Fraction
Percent of channel bandwidth that will be available on the access link for Unicast Retransmission and Rapid Channel Change. This value is configured with the vqe.vqes.excess_bw_fraction parameter. For information on this parameter, see Table A-4 on page A-7.
Maximum Interval between MPEG RAPs (msec)
Maximum time interval (in milliseconds) between MPEG RAPs (random access points) for the entire channel lineup. This value is configured with the vqe.vqes.rap_inteval parameter in VCDB. For information on this parameter, see Table A-3 on page A-5.
Differentiated Services Code Point Configuration
RTCP Packets
DCSP value for RTCP packets that VQE-S transmits. This value is configured with the vqe.vqes.rtcp_dscp parameter in VCDB. For information on this parameter, see Table A-1 on page A-2.
Retransmitted RTP Packets
DCSP value for RTP packets that VQE-S transmits. This value is configured with the vqe.vqes.rtp_trans_dscp parameter in VCDB. For information on this parameter, see Table A-1 on page A-2.
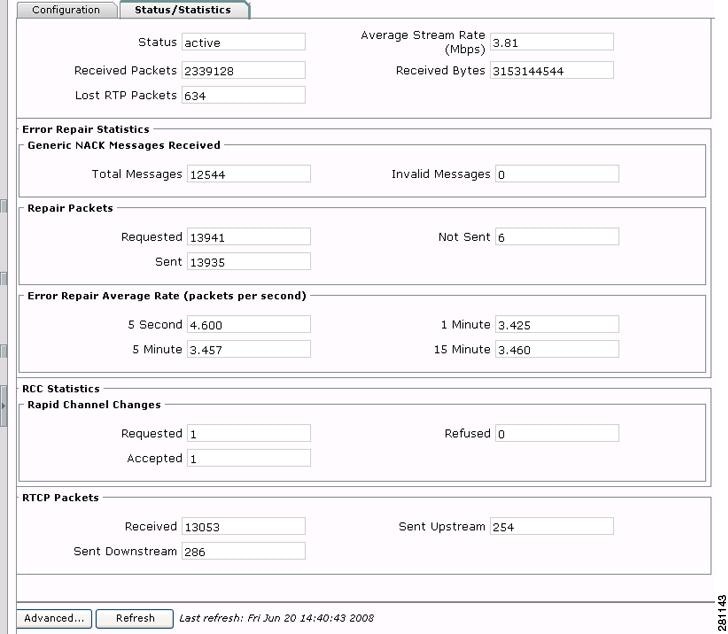
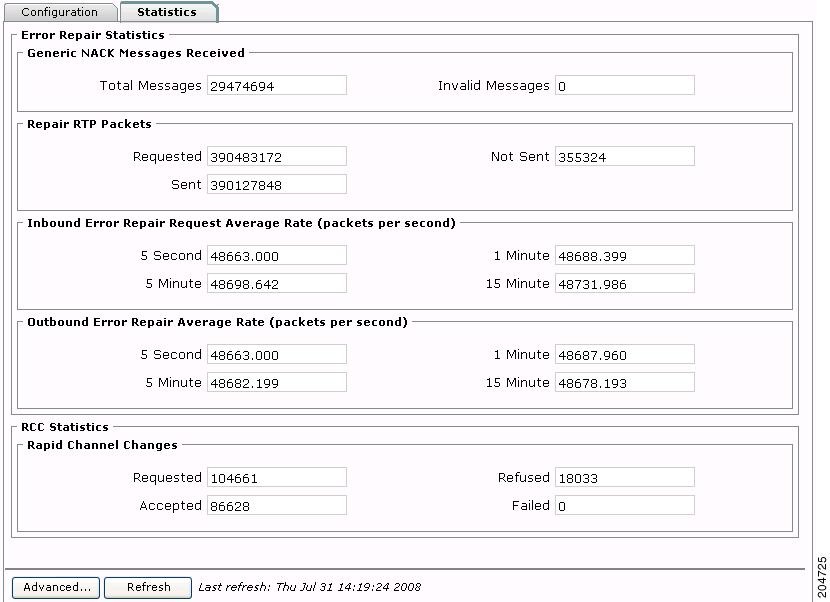
Viewing Error Repair and RCC Statistics
When you click Error Repair and RCC in the navigation tree and click the Statistics tab, VQE-S AMT displays the Error Repair and RCC Statistics window (Figure 4-7). The statistics are for this VQE-S and are similar to the Error Repair and RCC statistics displayed for individual channels but are for all channels in the current channel lineup.
The Error Repair and RCC statistics are reset to 0 when VQE-S restarts or when the channel lineup changes.
Figure 4-7 Error Repair and RCC Statistics Window
The Error Repair and RCC Statistics window has the information listed in Table 4-6.
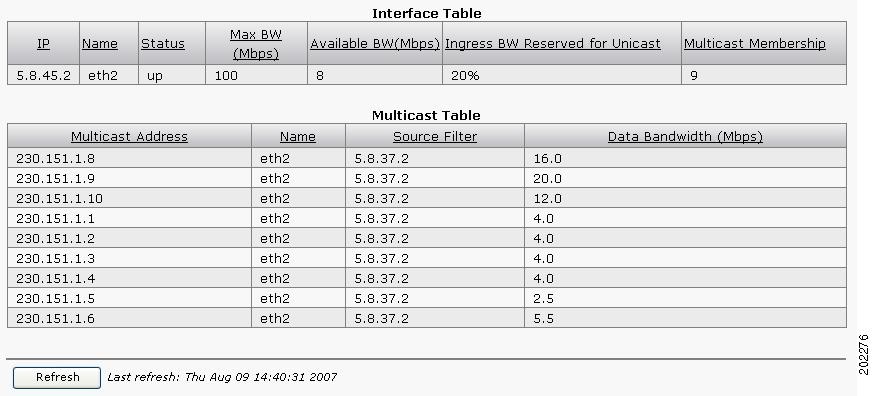
Monitoring Multicast Load Balancer
When you click Multicast Load Balancer in the navigation tree, VQE-S AMT displays two tables associated with the Multicast Load Balancer component of VQE-S: the Interface Table and the Multicast Table. Figure 4-8 shows both tables.
Multicast Load Balancer distributes traffic for incoming multicast streams and outgoing Error Repair over the Ethernet interfaces on the Cisco CDE110 that hosts VQE-S. The interfaces must be correctly configured and operational (up) to participate in this load balancing.
Multicast Load Balancer determines the best interface on which to join or leave the multicast group, distributing the joins across available interfaces to avoid oversubscription. Load Balancer also monitors the status of these interfaces, moving the streams to other interfaces in case of interface failure.
Figure 4-8 Interface Table and the Multicast Table
The Interface Table (Figure 4-8) has the information listed in Table 4-7. The information is about the Ethernet interfaces on the Cisco CDE110 that are currently participating in multicast load balancing.
Table 4-7 Interface Table
IP
IP address assigned to this Ethernet interface.
Name
Name that is assigned to this Ethernet interface by Linux. For information on these names, see "Configuring the Linux Operating System for VQE-S" section on page D-3.
Status
Either up or down.
Max BW
Maximum speed of the interface.
Available BW
Interface bandwidth that is currently not being used.
Ingress BW Reserved for Unicast
Percent of the interface's ingress bandwidth that is reserved for Error Repair requests from VQE Clients. This value is configured by the burst-rate option in the VQE-S configuration file.
Multicast Membership
Number of channels that are currently using this interface for Error Repair.
The Multicast Table (Figure 4-8) has the information listed in Table 4-8. The information is about the multicast streams on this VQE-S that are currently participating in multicast load balancing.
Monitoring RTCP Exporter
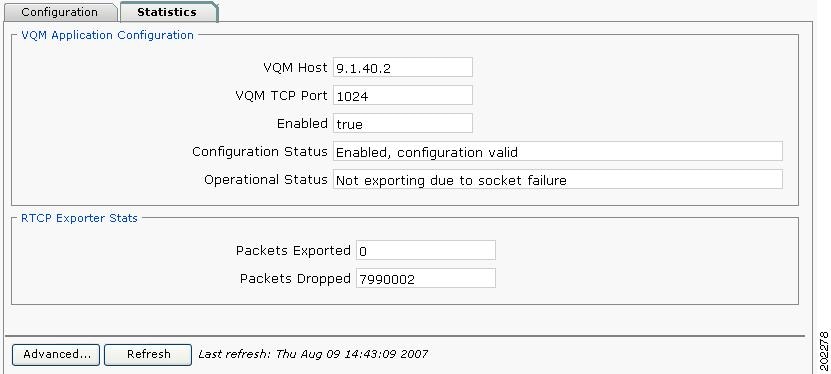
When you click RTCP Exporter in the navigation tree and click the Configuration tab, VQE-S AMT displays the VQE-S RTCP Exporter parameters. RTCP Exporter currently has no parameters that can be configured with VQE-S AMT, and the parameters are for viewing only. For information on configuring RTCP Exporter, see the "Configuring VQE-S RTCP Exporter" section on page 2-25.
When you click RTCP Exporter in the navigation tree and click the Statistics tab, VQE-S AMT displays the RTCP Exporter Statistics window (Figure 4-9).
Figure 4-9 RTCP Exporter Statistics Window
The RTCP Exporter Statistics window has the information listed in Table 4-9. The statistics are for this VQE Server's RTCP Exporter.
For information on RTCP Exporter and the video-quality monitoring application, see the "VQE-S RTCP Exporter for Video-Quality Monitoring" section on page 1-19.
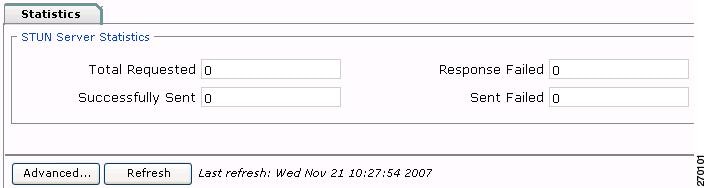
Monitoring the STUN Server
When you click STUN Server in the navigation tree, VQE-S AMT displays the STUN Server Statistics window (Figure 4-10).
Figure 4-10 STUN Server Statistics Window
The STUN Server Statistics window has the information listed in Table 4-10.
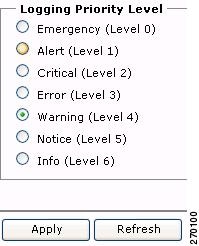
Configuring VQE-S Logging
When you click Logging in the navigation tree, VQE-S AMT displays the logging priority levels (Figure 4-11) for VQE-S. The priority levels allow you to control the logging level for system messages for all VQE-S processes (Process Monitor, Control Plane, Data Plane, and Multicast Load Balancer). By default, all VQE-S system messages are written to the file /var/log/vqe/vqe.log.
Figure 4-11 Logging Priority Levels
To configure a VQE-S logging priority level, click the button next to the level you want and click Apply.
In VQE-S AMT, the logging priority levels are listed from least verbose to most verbose. The Emergency level generates the smallest number of messages, and the Info level generates the greatest number of messages. The default value is Warning.
When you select a logging level, log messages are generated for the levels below that level. For example, when the level is set to Error, messages are generated for Emergency, Alert, Critical, and Error.
The selected logging priority level does not persist when VQE-S is stopped. When VQE-S restarts, the logging priority level goes back to the default. Logging priority levels that do persist can be set using the process_monitor command options or the VQE-S configuration file. For information on these methods, see Appendix A, "VQE, System, and Network Parameters."
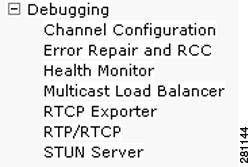
Configuring VQE-S Debugging
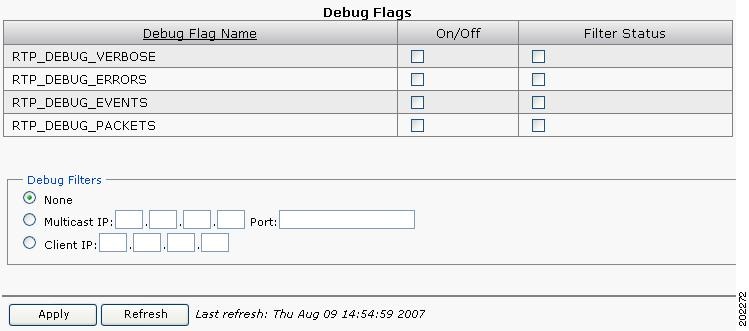
When you click Debugging in the navigation tree and click a debug component, the debugging options for that component are displayed. Figure 4-12 shows the debug components. The options allow you to control the types of debugging messages that are written to the syslog file. By default, debug messages are written to the file /var/log/vqe/vqe.log.
Figure 4-12 Debug Components
To configure VQE-S debugging, follow these steps:
Step 1
The debug flags and filters for that component are displayed. For example, Figure 4-13 shows the flags and filters for the RTP/RTCP category.
Figure 4-13 RTP/RTCP Flags and Filters
Step 2
Note
Step 3
a.
b.
•
•
Step 4
The selected debugging options are enabled.
The selected debugging options do not persist when VQE-S is stopped. When VQE-S restarts, debugging goes back to the default—no options are enabled.