Feedback
Table Of Contents
About the Cisco Fabric Analyzer
Configuring the Cisco Fabric Analyzer
Sending Captures to Remote IP Addresses
Clearing Configured fcanalyzer Information
Verifying Loop Monitoring Configuration
The show tech-support brief Command
The show tech-support zone Command
The show tech-support port-channel Command
The show tech-support vsan Command
The show tech-support fcdomain Command
Enabling the IP Network Simulator
Simulating a Finite Queue Size
Displaying IP Network Simulator Statistics
IP Network Simulator Configuration Example
Troubleshooting Your Fabric
This chapter describes basic troubleshooting methods used to resolve issues with switches. This chapter includes the following sections:
•
The show tech-support Command
fctrace
The fctrace feature allows you to:
•
•
You can invoke fctrace by providing the FC ID, the N port, or the NL port WWN, or the device alias of the destination. The frames are routed normally as long as they are forwarded through TE ports.
Once the frame reaches the edge of the fabric (the F port or FL port connected to the end node with the given port WWN or the FC ID), the frame is looped back (swapping the source ID and the destination ID) to the originator.
If the destination cannot be reached, the path discovery starts, which traces the path up to the point of failure.
Note
Tip
To perform a fctrace operation, follow this step:
fcping
The fcping feature verifies reachability of a node by checking its end-to-end connectivity. You can invoke the fcping feature by providing the FC ID, the destination port WWN, or the device alias information.
To perform a fcping operation, follow these steps:
Verifying Switch Connectivity
You can verify connectivity to a destination switch.
Note
To verify connectivity to a destination switch, follow these steps:
Cisco Fabric Analyzer
Fibre Channel protocol analyzers capture, decode, and analyze frames and ordered sets on a link. Existing Fibre Channel analyzers can capture traffic at wire rate speed. They are expensive and support limited frame decoding. Also, to snoop traffic, the existing analyzers disrupt the traffic on the link while the analyzer is inserted into the link.
The Cisco MDS 9000 Family switches support protocol analysis within a storage network with the Cisco Fabric Analyzer. You can capture Fibre Channel control traffic from a switch and decode it without having to disrupt any connectivity, and without having to be local to the point of analysis.
The Cisco Fabric Analyzer is based on two popular public-domain software applications:
•
•
Note
This section includes the following topics:
•
•
•
About the Cisco Fabric Analyzer
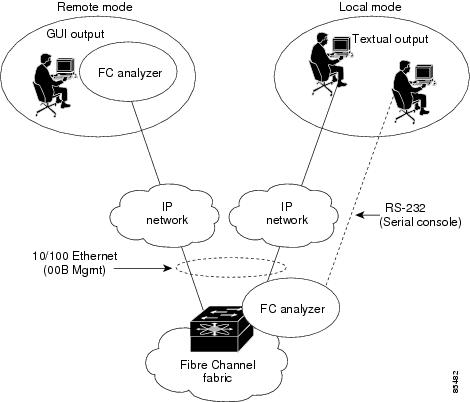
The Cisco Fabric Analyzer consists of two separate components (see Figure 59-1):
•
–
–
•
Figure 59-1 Cisco Fabric Analyzer Usage
Local Text-Based Capture
This component is a command-line driven text-based interface that captures traffic to and from the supervisor module in a Cisco MDS 9000 Family switch. It is a fully functional decoder that is useful for quick debug purposes or for use when the remote capture daemon is not enabled. Additionally, because this tool is accessed from within the Cisco MDS 9000 Family switch, it is protected by the roles-based policy that limits access in each switch.
See the "Capturing Frames Locally" section.
Remote Capture Daemon
This daemon is the server end of the remote capture component. The Ethereal analyzer running on a host is the client end. They communicate with each other using the Remote Capture Protocol (RPCAP). RPCAP uses two endpoints, a TCP-based control connection and a TCP or UDP-based data connection based on TCP (default) or UDP. The control connection is used to remotely control the captures (start or stop the capture, or specify capture filters). Remote capture can only be performed to explicitly configured hosts. This technique prevents an unauthorized machine in the network from snooping on the control traffic in the network.
RPCAP supports two setup connection modes based on firewall restrictions.
•
•
Using capture filters, you can limit the amount of traffic that is actually sent to the client. Capture filters are specified at the client end—on Ethereal, not on the switch.
See the "Sending Captures to Remote IP Addresses" section.
GUI-Based Client
The Ethereal software runs on a host, such as a PC or workstation, and communicates with the remote capture daemon. This software is available in the public domain from http://www.ethereal.com. The Ethereal GUI front-end supports a rich interface such as a colorized display, graphical assists in defining filters, and specific frame searches. These features are documented on Ethereal's web site.
While remote capture through Ethereal supports capturing and decoding Fibre Channel frames from a Cisco MDS 9000 Family switch, the host running Ethereal does not require a Fibre Channel connection to the switch. The remote capture daemon running on the switch sends the captured frames over the out-of-band Ethernet management port. This capability allows you to capture and decode Fibre Channel frames from your desktop or laptop.
See the "Displaying Captured Frames" section.
Configuring the Cisco Fabric Analyzer
You can configure the Cisco Fabric Analyzer to perform one of two captures.
•
•
To use the Cisco Fabric Analyzer feature, traffic should be flowing to or from the supervisor module.
Capturing Frames Locally
To capture frames locally, follow these steps:
Sending Captures to Remote IP Addresses
Caution
To capture frames remotely using IPv4, follow these steps:
To capture frames remotely using IPv6, follow these steps:
To capture remote traffic, use one of the following options:
•
rpcap://<ipaddress or switch hostname>/eth2For example:
rpcap://cp-16/eth2rpcap://17.2.1.1/eth2•
ethereal -i rpcap://<ipaddress|hostname>[:<port>]/<interface>For example:
ethereal -i rpcap://172.22.1.1/eth2or
ethereal -i rpcap://customer-switch.customer.com/eth2
Note
Clearing Configured fcanalyzer Information
Use the clear fcanalyzer command to clear the entire list of configured hosts. Note that the existing connections are not terminated.
Displaying Configured Hosts
Use the show fcanalyzer command to display the list of hosts configured for a remote capture. See Example 59-1.
Example 59-1 Displays Configured Hosts
switch# show fcanalyzerPassiveClient = 10.21.0.3PassiveClient = 10.21.0.3ActiveClient = 10.21.0.3, DEFAULT
Note
Displaying Captured Frames
You can selectively view captured frames by using the display filters feature. For example, instead of viewing all the frames from a capture, you may only want to view Exchange Link Protocol (ELP) request frames. This feature only limits the captured view—it does not affect the captured or the saved frames. Procedures to specify, use, and save display filters are already documented in the Ethereal web site (http://www.ethereal.com). Some examples of how you can use this feature are as follows:
•
mdshdr.vsan == 2•
fcswils•
mdshdr.sof == SOFf•
swils.opcode == HLO || swils.opcode == LSU || swils.opcode == LSA•
fcels.opcode == FLOGI•
fcels.opcode == FLOGI && mdshdr.vsan == 2•
dNSDefining Display Filters
Display filters limit the frames that can be displayed, but not what is captured (similar to any view command). The filters to be displayed can be defined in multiple ways in the GUI application:
•
•
•
•
•
Regardless of the definition, each filter must be saved and identified with a name.
Note
Examples of Display Filters
Some examples of using display filters with the Fabric Analyzer local are provided in this section. The brief option is used in all examples to restrict the size of the output. See Example 59-2.
Example 59-2 Displays Only Fabric Login Server Traffic on VSAN 1
switch(config)# fcanalyzer local brief display-filter
(mdshdr.vsan==0x01)&&((fc.d_id==\"ff.ff.fe\"\|\|fc.s_id==\"ff.ff.fe\"))
Capturing on eth28.904145 00.00.00 -> ff.ff.fe FC ELS 1 0x28f8 0xffff 0x3 -> 0xf FLOGI8.918164 ff.ff.fe -> 79.03.00 FC ELS 1 0x28f8 0x12c6 0xff -> 0x0 ACC (FLOGI)You can trace all frames to and from a particular N port device. For example, you can observe RSCNs from the Fabric Controller and registration, and/or you can query requests to the name server. See Example 59-3.
Note
Example 59-3 Displays All Traffic for a Particular N Port on VSAN 1
switch(config)# fcanalyzer local brief
display-filter(mdshdr.vsan==0x01)&&((fc.d_id==\"79.03.00\"\|\|fc.s_id==\"79.03.00\"))
Capturing on eth2 8.699162 ff.ff.fe -> 79.03.00 FC ELS 1 0x35b8 0x148e 0xff -> 0x0 ACC (FLOGI) 8.699397 79.03.00 -> ff.ff.fc FC ELS 1 0x35d0 0xffff 0x3 -> 0xf PLOGI 8.699538 ff.ff.fc -> 79.03.00 FC ELS 1 0x35d0 0x148f 0xff -> 0x0 ACC (PLOGI) 8.699406 79.03.00 -> ff.ff.fd FC ELS 1 0x35e8 0xffff 0x3 -> 0xf SCR 8.700179 79.03.00 -> ff.ff.fc dNS 1 0x3600 0xffff 0x3 -> 0xf GNN_FT 8.702446 ff.ff.fd -> 79.03.00 FC ELS 1 0x35e8 0x1490 0xff -> 0x0 ACC (SCR) 8.704210 ff.ff.fc -> 79.03.00 dNS 1 0x3600 0x1491 0xff -> 0x0 ACC (GNN_FT) 8.704383 79.03.00 -> ff.ff.fc dNS 1 0x3618 0xffff 0x3 -> 0xf GPN_ID 8.707857 ff.ff.fc -> 79.03.00 dNS 1 0x3618 0x1496 0xff -> 0x0 ACC (GPN_ID)The VSAN ID is specified in hex. See Example 59-4.
Example 59-4 Displays All Traffic for a Specified VSAN
switch(config)# fcanalyzer local brief display-filter mdshdr.vsan==0x03e7
Capturing on eth2
12.762577   ff.ff.fd -> ff.ff.fd   SW_ILS 999   0xb2c 0xffff  0x1 ->  0xf HLO
12.762639   ff.ff.fd -> ff.ff.fd   FC     999   0xb2c  0xd32 0xff ->  0x0 Link Ctl, ACK1
13.509979   ff.ff.fd -> ff.ff.fd   SW_ILS 999   0xd33 0xffff 0xff ->  0x0 HLO
13.510918   ff.ff.fd -> ff.ff.fd   FC     999   0xd33  0xb2d  0x1 ->  0xf Link Ctl, ACK1
14.502391   ff.fc.64 -> ff.fc.70   SW_ILS 999   0xd34 0xffff 0xff ->  0x0 SW_RSCN
14.502545   ff.ff.fd -> 64.01.01   FC ELS 999   0xd35 0xffff 0xff ->  0x0 RSCN
14.502804   64.01.01 -> ff.ff.fd   FC ELS 999   0xd35  0x215  0x0 ->  0xf ACC (RSCN)
14.503387   ff.fc.70 -> ff.fc.64   FC     999   0xd34  0xb2e  0x1 ->  0xf Link Ctl, ACK1
14.503976   ff.fc.70 -> ff.fc.64   SW_ILS 999   0xd34  0xb2e  0x1 ->  0xf SW_ACC (SW_RSCN)
14.504025   ff.fc.64 -> ff.fc.70   FC     999   0xd34  0xb2e 0xff ->  0x0 Link Ctl, ACK1
By excluding FSPF hellos and ACK1, you can focus on the frames of interest. See Example 59-5.
Example 59-5 Displays All VSAN 1 Traffic Excluding FSPF Hellos and ACK1 Frames.
switch(config)# fcan lo bri dis (mdshdr.vsan==0x01)&¬((swils.opcode==0x14)or(fc.r_ctl==0xc0))Capturing on eth2 10.589934 ff.fc.79 -> ff.fc.7a FC-FCS 1 0x1b23 0xffff 0xff -> 0x0 GCAP 10.591253 ff.fc.7a -> ff.fc.79 FC-FCS 1 0x1b23 0x2f70 0x4 -> 0xf MSG_RJT (GCAP) 25.277981 ff.fc.79 -> ff.fc.7a SW_ILS 1 0x1b27 0xffff 0xff -> 0x0 SW_RSCN 25.278050 ff.fc.79 -> ff.fc.89 SW_ILS 1 0x1b28 0xffff 0xff -> 0x0 SW_RSCN 25.279232 ff.fc.89 -> ff.fc.79 SW_ILS 1 0x1b28 0xadd7 0x5 -> 0xf SW_ACC (SW_RSCN) 25.280023 ff.fc.7a -> ff.fc.79 Unzoned NS 1 0x3b2b 0xffff 0x5 -> 0xf GE_PT 25.280029 ff.fc.7a -> ff.fc.79 SW_ILS 1 0x1b27 0x2f71 0x4 -> 0xf SW_ACC (SW_RSCN) 25.282439 ff.fc.79 -> ff.fc.7a dNS 1 0x3b2b 0x1b29 0xff -> 0x0 RJT (GE_PT) 38.249966 00.00.00 -> ff.ff.fe FC ELS 1 0x36f0 0xffff 0x3 -> 0xf FLOGI 38.262622 ff.ff.fe -> 79.03.00 FC ELS 1 0x36f0 0x1b2b 0xff -> 0x0 ACC (FLOGI) 38.262844 79.03.00 -> ff.ff.fc FC ELS 1 0x3708 0xffff 0x3 -> 0xf PLOGI 38.262984 ff.ff.fc -> 79.03.00 FC ELS 1 0x3708 0x1b2c 0xff -> 0x0 ACC (PLOGI) 38.262851 79.03.00 -> ff.ff.fd FC ELS 1 0x3720 0xffff 0x3 -> 0xf SCR 38.263514 ff.fc.79 -> ff.fc.7a SW_ILS 1 0x1b2e 0xffff 0xff -> 0x0 SW_RSCN 38.263570 ff.fc.79 -> ff.fc.89 SW_ILS 1 0x1b2f 0xffff 0xff -> 0x0 SW_RSCN 38.263630 79.03.00 -> ff.ff.fc dNS 1 0x3738 0xffff 0x3 -> 0xf GNN_FT 38.263884 ff.ff.fd -> 79.03.00 FC ELS 1 0x3720 0x1b2d 0xff -> 0x0 ACC (SCR) 38.264066 ff.fc.89 -> ff.fc.79 SW_ILS 1 0x1b2f 0xaddf 0x5 -> 0xf SW_ACC (SW_RSCN) 38.264417 ff.fc.89 -> ff.fc.79 dNS 1 0xade0 0xffff 0x5 -> 0xf GE_ID 38.264585 ff.fc.79 -> ff.fc.89 dNS 1 0xade0 0x1b31 0xff -> 0x0 ACC (GE_ID) 38.265132 ff.ff.fc -> 79.03.00 dNS 1 0x3738 0x1b30 0xff -> 0x0 ACC (GNN_FT) 38.265210 ff.fc.7a -> ff.fc.79 Unzoned NS 1 0x3b2f 0xffff 0x5 -> 0xf GE_PT 38.265414 79.03.00 -> ff.ff.fc dNS 1 0x3750 0xffff 0x3 -> 0xf GPN_ID 38.265502 ff.fc.7a -> ff.fc.79 SW_ILS 1 0x1b2e 0x2f73 0x4 -> 0xf SW_ACC (SW_RSCN) 38.267196 ff.fc.79 -> ff.fc.7a dNS 1 0x3b2f 0x1b32 0xff -> 0x0 ACC (GE_PT)Use this command to focus on TE port initialization. This example allows two VSANs on the TE port and the port VSAN is 666. Hence the ELP, ESC, and EPP (0x71) go out on VSAN 666. Once the EPP negotiation is complete, we see EFP, DIA, RDI, MR, FSPF, and other updates flow for each allowed VSAN. See Example 59-6.
Example 59-6 Displays SW_ILS Traffic Between Fabric Controllers for all VSANs and Exclude FSPF Hellos and ACK1 Frames.
switch(config)# fcan lo bri dis
fc.type==0x22&&((fc.d_id==\"ff.fc.ef\"\|\|fc.s_id==\"ff.fc.ef\"))
Warning:Couldn't obtain netmask info (eth2:no IPv4 address assigned).Capturing on eth29.472181 ff.fc.ef -> ff.fc.61 0x5e0a 0xffff SW_ILS ACA9.472777 ff.fc.61 -> ff.fc.ef 0x5e0a 0x5e09 SW_ILS SW_ACC (ACA)9.474551 ff.fc.ef -> ff.fc.61 0x5e0b 0xffff SW_ILS SFC9.475706 ff.fc.61 -> ff.fc.ef 0x5e0b 0x5e0a SW_ILS SW_ACC (SFC)9.476694 ff.fc.ef -> ff.fc.61 0x5e0c 0xffff SW_ILS UFC9.483612 ff.fc.61 -> ff.fc.ef 0x5e0c 0x5e0b SW_ILS SW_ACC (UFC)9.488187 ff.fc.ef -> ff.fc.61 0x5e0d 0xffff SW_ILS RCA9.493703 ff.fc.61 -> ff.fc.ef 0x5e0d 0x5e0c SW_ILS SW_ACC (RCA)This example focuses on zone server changes. Prior knowledge of the domain controller ID is required. The switch domain ID where the fcanalyzer is run is x79, the domain controller is FF.FC.79. See Example 59-7.
Example 59-7 Display Switch Internal Link Services (SW_ILS) Traffic to and from Fabric Domain Controller ff.fc.79
switch(config)# fcan lo bri dis fc.type==0x22&&((fc.d_id==\ ff.fc.79\
\|\|fc.s_id==\"ff.fc.79\"))
Capturing on eth264.053927 ff.fc.79 -> ff.fc.7a SW_ILS 0x1e15 0xffff 0xff -> 0x0 ACA64.053995 ff.fc.79 -> ff.fc.89 SW_ILS 0x1e16 0xffff 0xff -> 0x0 ACA64.054599 ff.fc.89 -> ff.fc.79 SW_ILS 0x1e16 0xb1e2 0x5 -> 0xf SW_ACC (ACA)64.054747 ff.fc.7a -> ff.fc.79 SW_ILS 0x1e15 0x3037 0x4 -> 0xf SW_ACC (ACA)64.057643 ff.fc.79 -> ff.fc.7a SW_ILS 0x1e17 0xffff 0xff -> 0x0 SFC64.057696 ff.fc.79 -> ff.fc.89 SW_ILS 0x1e18 0xffff 0xff -> 0x0 SFC64.058788 ff.fc.7a -> ff.fc.79 SW_ILS 0x1e17 0x3038 0x5 -> 0xf SW_ACC (SFC)64.059288 ff.fc.89 -> ff.fc.79 SW_ILS 0x1e18 0xb1e3 0x5 -> 0xf SW_ACC (SFC)64.062011 ff.fc.79 -> ff.fc.7a SW_ILS 0x1e19 0xffff 0xff -> 0x0 UFC64.062060 ff.fc.79 -> ff.fc.89 SW_ILS 0x1e1a 0xffff 0xff -> 0x0 UFC64.073513 ff.fc.7a -> ff.fc.79 SW_ILS 0x1e19 0x3039 0x5 -> 0xf SW_ACC (UFC)64.765306 ff.fc.89 -> ff.fc.79 SW_ILS 0x1e1a 0xb1e4 0x5 -> 0xf SW_ACC (UFC)64.765572 ff.fc.79 -> ff.fc.7a SW_ILS 0x1e1b 0xffff 0xff -> 0x0 RCA64.765626 ff.fc.79 -> ff.fc.89 SW_ILS 0x1e1c 0xffff 0xff -> 0x0 RCA64.766386 ff.fc.7a -> ff.fc.79 SW_ILS 0x1e1b 0x303a 0x4 -> 0xf SW_ACC (RCA)64.766392 ff.fc.89 -> ff.fc.79 SW_ILS 0x1e1c 0xb1e5 0x5 -> 0xf SW_ACC (RCA)
Note
switch# show fcs ie vsan 999
IE List for VSAN:999
------------------------------------------------------------------------
IE-WWN IE-Type Mgmt-Id Mgmt-Addr
------------------------------------------------------------------------
23:e7:00:05:30:00:91:5f Switch (Remote) 0xfffc04 10.66.78.51
23:e7:00:05:30:00:9b:9f Switch (Adjacent) 0xfffc01 10.66.78.52
23:e7:00:0d:ec:00:93:81 Switch (Local) 0xfffc79 10.66.78.54
[Total 3 IEs in Fabric]
Capture Filters
You can limit what frames are captured by using the capture filters feature in a remote capture. This feature limits the frames that are captured and sent from the remote switch to the host. For example, you can capture only class F frames. Capture filters are useful in restricting the amount of bandwidth consumed by the remote capture.
Unlike display filters, capture filters restrict a capture to the specified frames. No other frames are visible until you specify a completely new capture.
The syntax for capture filters is different from the syntax for display filters. Capture filters use the Berkeley Packet Filter (BPF) library that is used in conjunction with the libpcap freeware. The list of all valid Fibre Channel capture filter fields are provided later in this section.
Procedures to configure capture filters are already documented in the Ethereal web site (http://www.ethereal.com). Some examples of how you can use this feature follows:
•
vsan = 1•
class_f•
els•
dns•
fcp_cmd
Note
Permitted Capture Filters
This section lists the permitted capture filters.
o vsan
o src_port_idx
o dst_port_idx
o sof
o r_ctl
o d_id
o s_id
o type
o seq_id
o seq_cnt
o ox_id
o rx_id
o els
o swils
o fcp_cmd   (FCP Command frames only)
o fcp_data (FCP data frames only)
o fcp_rsp   (FCP response frames only)
o class_f
o bad_fc
o els_cmd
o swils_cmd
o fcp_lun
o fcp_task_mgmt
o fcp_scsi_cmd
o fcp_status
o gs_type      (Generic Services type)
o gs_subtype   (Generic Services subtype)
o gs_cmd
o gs_reason
o gs_reason_expl
o dns   (name server)
o udns (unzoned name server)
o fcs   (fabric configuration server)
o zs    (zone server)
o fc    (use as fc[x:y] where x is offset and y is length to compare)
o els   (use as els[x:y] similar to fc)
o swils (use as swils[x:y] similar to fc)
o fcp   (use as fcp[x:y] similar to fc)
o fcct (use as fcct[x:y] similar to fc)
Loop Monitoring
This section includes the following topics:
•
About Loop Monitoring
By default, loop monitoring is disabled in all switches in the Cisco MDS 9000 Family. When a disk is removed from a loop port, the loop stays active based on the bypass circuit. Thus the disk removal is not known until you try to communicate with the disk. To detect such removals, the disks can be polled periodically (every 20 seconds).
Caution
Enabling Loop Monitoring
To enable the loop monitoring feature, follow these steps:
Verifying Loop Monitoring Configuration
Use the show running-config command to verify the loop monitoring configuration.
switch# show running-config | include loop-monitorfcinterop loop-monitorThe show tech-support Command
The show tech-support command is useful when collecting a large amount of information about your switch for troubleshooting purposes. The output of this command can be provided to technical support representatives when reporting a problem.
The show tech-support command displays the output of several show commands at once. The output from this command varies depending on your configuration. Use the show tech-support command in EXEC mode to display general information about the switch when reporting a problem.
You can choose to have detailed information for each command or even specify the output for a particular interface, module, or VSAN. Each command output is separated by line and the command precedes the output.
Note
Tip
The default output of the show tech-support command includes the output of the following commands:
•
•
•
•
•
•
•
•
•
•
•
Each command is discussed in both the Cisco MDS 9000 Family CLI Configuration Guide and the Cisco MDS 9000 Family Command Reference. Refer to the Cisco MDS 9000 Family Troubleshooting Guide to obtain debug processes, procedures, and examples.
The show tech-support brief Command
Use the show tech-support brief command to obtain a quick, condensed review of your switch configurations. This command provides a summary of the current running state of the switch (see Example 59-8).
The show tech-support brief command is useful when collecting information about your switch for troubleshooting purposes. The output of this command can be provided to technical support representatives when reporting a problem.
Tip
Example 59-8 Displays the Condensed View of Switch Configurations
vegas01# show tech-support briefSwitch Name : vegas01Switch Type : DS-X9216-K9-SUPKickstart Image : 1.3(2) bootflash:///m9200-ek9-kickstart-mz.1.3.1.10.binSystem Image : 1.3(2) bootflash:///m9200-ek9-mz.1.3.1.10.binIP Address/Mask : 10.76.100.164/24Switch WWN : 20:00:00:05:30:00:84:9eNo of VSANs : 9Configured VSANs : 1-6,4091-4093VSAN 1: name:VSAN0001, state:active, interop mode:defaultdomain id:0x6d(109), WWN:20:01:00:05:30:00:84:9f [Principal]active-zone:VR, default-zone:denyVSAN 2: name:VSAN0002, state:active, interop mode:defaultdomain id:0x7d(125), WWN:20:02:00:05:30:00:84:9f [Principal]active-zone:<NONE>, default-zone:denyVSAN 3: name:VSAN0003, state:active, interop mode:defaultdomain id:0xbe(190), WWN:20:03:00:05:30:00:84:9f [Principal]active-zone:<NONE>, default-zone:denyVSAN 4: name:VSAN0004, state:active, interop mode:defaultdomain id:0x5a(90), WWN:20:04:00:05:30:00:84:9f [Principal]active-zone:<NONE>, default-zone:denyVSAN 5: name:VSAN0005, state:active, interop mode:defaultdomain id:0x13(19), WWN:20:05:00:05:30:00:84:9f [Principal]active-zone:<NONE>, default-zone:denyVSAN 6: name:VSAN0006, state:active, interop mode:defaultdomain id:0x1f(31), WWN:20:06:00:05:30:00:84:9f [Principal]active-zone:<NONE>, default-zone:denyVSAN 4091: name:VSAN4091, state:active, interop mode:defaultdomain id:0x08(8), WWN:2f:fb:00:05:30:00:84:9f [Principal]active-zone:<NONE>, default-zone:denyVSAN 4092: name:VSAN4092, state:active, interop mode:defaultdomain id:0x78(120), WWN:2f:fc:00:05:30:00:84:9f [Principal]active-zone:<NONE>, default-zone:denyVSAN 4093: name:VSAN4093, state:active, interop mode:defaultdomain id:0x77(119), WWN:2f:fd:00:05:30:00:84:9f [Principal]active-zone:<NONE>, default-zone:deny-------------------------------------------------------------------------------Interface Vsan Admin Admin Status FCOT Oper Oper PortMode Trunk Mode Speed ChannelMode (Gbps)-------------------------------------------------------------------------------fc1/1 1 auto on fcotAbsent -- -- --fc1/2 1 auto on fcotAbsent -- -- --fc1/3 1 auto on fcotAbsent -- -- --fc1/4 1 auto on fcotAbsent -- -- --fc1/5 1 auto on notConnected swl -- --fc1/6 1 auto on fcotAbsent -- -- --fc1/7 1 auto on fcotAbsent -- -- --fc1/8 1 auto on fcotAbsent -- -- --fc1/9 1 auto on fcotAbsent -- -- --fc1/10 1 auto on fcotAbsent -- -- --fc1/11 1 auto on fcotAbsent -- -- --fc1/12 1 auto on fcotAbsent -- -- --fc1/13 1 auto on fcotAbsent -- -- --fc1/14 1 auto on fcotAbsent -- -- --fc1/15 1 auto on fcotAbsent -- -- --fc1/16 1 auto on fcotAbsent -- -- ---------------------------------------------------------------------------------Interface Status Speed(Gbps)-------------------------------------------------------------------------------sup-fc0 up 1-------------------------------------------------------------------------------Interface Status IP Address Speed MTU-------------------------------------------------------------------------------mgmt0 up 10.76.100.164/24 100 Mbps 1500The show tech-support zone Command
Use the show tech-support zone command to obtain information about the zoning configuration on your switch (see Example 59-9).
The output of the show tech-support zone command includes the output of the following commands:
•
•
•
•
•
•
•
•
•
•
•
•
•
•
•
•
•
•
•
•
Tip
Example 59-9 Displays the Zoning Configurations
switch# show tech-support zone vsan 1`show zone status vsan 1`VSAN: 1 default-zone: permit distribute: active only Interop: defaultmode: basic merge-control: allow session: nonehard-zoning: enabledDefault zone:qos: disabled broadcast: disabled ronly: disabledFull Zoning Database :Zonesets:0 Zones:0 Aliases: 0Active Zoning Database :Name: vhost-zone Zonesets:1 Zones:9Status: Activation failed [Error: Unknown error Dom 21]:at 23:36:44 UTC Dec 19 2005The show tech-support port-channel Command
Use the show tech-support port-channel command to obtain information about the PortChannel configuration on your switch (see Example 59-10).
The output of the show tech-support port-channel command includes the output of the following commands:
•
•
•
•
•
•
•
•
Tip
Example 59-10 Displays the PortChannel Configurations
switch# show tech-support port-channelcp: missing destination fileTry `cp --help' for more information.`show port-channel internal event-history all`Low Priority Pending queue: len(0), max len(1) [Wed Jan 4 18:29:18 2006]High Priority Pending queue: len(0), max len(14) [Wed Jan 4 18:29:18 2006]PCM Control Block info:pcm_max_channels : 128pcm_max_channel_in_use : 1has Vegas Line CardTotal of 1 Vegas Line cardsPCM total_vlans info: 0x0====================================================PORT CHANNELS:====================================================ALL PORTS:GigabitEthernet3/1peer : 00:00:00:00:00:00:00:00my wwn : 00:00:00:00:00:00:00:00state : downupdate : noneintent : unknownstatus : unknownmode : onfcip timeout : 0 mssigloss : FALSEflags :cfg flags :up_time : 0 usecs after Thu Jan 1 00:00:00 1970auto pc : noneauto retry : 0last pcp err : 0 at 0 usecs after Thu Jan 1 00:00:00 1970No auto create compat failure...The show tech-support vsan Command
Use the show tech-support vsan command to obtain information about the VSAN configuration on your switch (see Example 59-11).
The output of the show tech-support vsan command includes the output of the following commands:
•
•
•
•
•
•
•
•
•
•
•
•
•
•
•
•
•
Tip
Example 59-11 Displays the VSAN Configurations
switch# show tech-support vsan 1`show vsan 1`vsan 1 informationname:VSAN0001 state:activeinteroperability mode:defaultloadbalancing:src-id/dst-id/oxidoperational state:up`show vsan 1 membership`vsan 1 interfaces:fc3/1 fc3/2 fc3/3 fc3/4 fc3/5 fc3/6 fc3/7 fc3/8fc3/9 fc3/10 fc3/11 fc3/12 fc3/13 fc3/14 port-channel 1 iscsi3/1 iscsi3/2...The show tech-support fcdomain Command
Use the show tech-support fcdomain command to obtain information about the fcdomain configuration on your switch (see Example 59-9).
The output of the show tech-support fcdomain command includes the output of the following commands:
•
•
•
•
•
•
•
•
•
•
•
•
•
Tip
Example 59-12 Displays the fcdomain Configurations
switch# show tech-support fcdomain`show fcdomain status`fcdomain distribution is disabled`show fcdomain session-status`Session parameters for VSAN 1-----------------------------------Last Action: none yetResult: not available`show fcdomain`VSAN 1The local switch is the Principal Switch.Local switch run time information:State: StableLocal switch WWN: 20:01:00:0c:85:90:3e:81Running fabric name: 20:01:00:0c:85:90:3e:81Running priority: 128Current domain ID: 0x72(114)Local switch configuration information:State: EnabledFCID persistence: EnabledAuto-reconfiguration: DisabledContiguous-allocation: DisabledConfigured fabric name: 20:01:00:05:30:00:28:dfConfigured priority: 128Configured domain ID: 0x00(0) (preferred)Principal switch run time information:Running priority: 128No interfaces available....IP Network Simulator
The IP Network Simulator tool is supported on the 8-port IP Storage Services (IPS-8) module and 4-port IP Storage Services (IPS-4) module only. You must also have either the SAN extension over IP package for IPS-8 modules (SAN_EXTN_OVER_IP) or SAN extension over IP package for IPS-4 modules (SAN_EXTN_OVER_IP_IPS4) so that you can enable the SAN Extension Tuner, which is a prerequisite for enabling and using the network simulator.
Note
Note
Ports dedicated to network simulation must be adjacent, and always begin with an odd-numbered port. For example, GE 1/1 and GE 1/2 would be a valid pair, while GE 2/2 and GE 2/3 would not.Network simulator enables you to simulate a variety of IP data network conditions, including the ability to test the impact of network latency. Network simulator is a generic tool that can provide simulation features for all Ethernet traffic; it is not limited to FCIP and iSCSI traffic to or from the Cisco MDS 9000 Family.
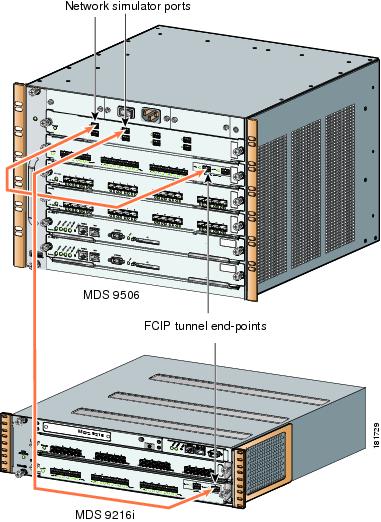
The simulation handles full duplex Gigabit Ethernet traffic at full line rate. Figure 59-2 depicts the physical topology using a Cisco MDS 9506 director with an IPS-8 module. GE ports 1 and 2 serve as the network simulator. The FCIP tunnel runs between the Cisco MDS 9506 director port GE 2/1 and the Cisco 9216 module port GE 2/2.
Figure 59-2
Network Simulator - Physical Topology Example
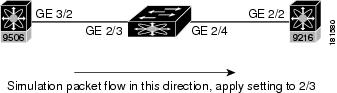
Figure 59-3 depicts the packet flow between the Cisco MDS 9506 and Cisco MDS 9216. Simulations such as delays, drops, and packet reordering are applied independently in each direction. To configure a delay simulation in both directions, you must configure the simulation on both the Cisco MDS 9506 GE 1/1 and 1/2 ports. Simulations are applied to ingress traffic only. All packets received on one Gigabit Ethernet port are sent out of the other Gigabit Ethernet port, and all network configuration simulations are made with respect to the ingress Gigabit Ethernet port.
Figure 59-3 Network Simulator Packet Flow
The network simulator tool can simulate the following network functions:
•
•
•
•
•
Enabling the IP Network Simulator
Because the network simulator commands and functionality are part of the SAN Extension Tuner, you must first enable the tuner; after doing so, you can view and use the network simulator commands in EXEC mode.
To enable the network simulator (in this case, on a Cisco MDS 9506 director), follow these steps:
Simulating Network Delays
You can configure the network simulator to delay all packets entering the Gigabit Ethernet ports. After configuring the delay in one direction, you need to also enter the same command to introduce the delay in the opposite direction, if desired. You can specify the delay in either milliseconds (allowable range is 0 to150 ms) or microseconds (allowable range is 0 to 150000 µs).
To configure the network simulator to delay all packets entering the Gigabit Ethernet ports 2/3 and 2/4 by 100 ms (round-trip), follow these steps:
Simulating Maximum Bandwidth
You can configure the network simulator to restrict the maximum bandwidth in a single direction. Simulating a maximum bandwidth less than that provided by Gigabit Ethernet allows you to control the pacing of packets through the network. So simulating maximum bandwidth in this way actually gives you an idea of the actual bandwidth across a WAN link (for example, an OC3).
You can specify the allowable bandwidth range in either kilobits per second (1000 to 1000000) or megabits per second (1 to 1000).
To configure the network simulator to limit the bandwidth in a specified direction, follow these steps.
Simulating a Finite Queue Size
You can configure network simulator to simulate a finite queue size in a network device. Data packets are dropped after the queue is full. To simulate a realistic network device, you should specify a queue size of 50 to150 KB. The maximum acceptable queue size is 1000 KB.
To configure the network simulator to simulate a finite queue size, follow these steps.
Simulating Packet Drops
You can configure network simulator to simulate packet drops (even when the queue is not full) randomly (specified as a percentage) or every Nth packet.
Percentage is represented as the number of packets in 10000. For example, if you wish to drop one percent of packets, then you would specify it as 100 packets in 10000. To simulate a realistic scenario for IP networks using random drops, the drop percentage should be between zero and one percent of packet drops in the specified traffic direction.
If you use the optional burst parameter, then the specified number of packets will be dropped each time a decision is made to drop a packet. If you do not specify the burst parameter, then only one packet is dropped each time a decision is made to drop packets. The burst limit for either random or Nth drops is between 1 and 100 packets. Take the burst parameter into account when specifying the percentage of packet drops. For example, if you select random drops of 100 packets in 10,000 (one percent) with a burst size of 2, then 200 packets (or two percent) are dropped every 10,000 packets.
To configure the network simulator to simulate packet drops, follow these steps:
Simulating Packet Reordering
You can configure network simulator to simulate that a percentage of packets be reordered, either randomly or every Nth packet. Percentage is represented as the number of packets to be reordered in 10000 packets. The acceptable range is between 0 and 10000. So, a specified value of 100 is equal to 1 percent; a value of 1000 is equal to 10 percent.
If you specify the optional distance parameter, then the packet at the head of the queue is reordered with the packet at the distance specified. For example, if you specify a distance of 2 for every 100 packets, then packets 100 and 102 are reordered. The packet sequence would be 1...99, 101, 102, 103...199, 201, 202, 200, 203 and so on. Hence, distance determines how far back in the queue a reordered packet is placed.
To configure the network simulator to simulate packet reordering, follow these steps:
Displaying IP Network Simulator Statistics
You can view a summary of the IP ports that are currently operating in network simulation mode using the show ips netsim command.
switch# show ips netsimFollowing ports operate in network simulator modeGigabitEthernet2/3 and GigabitEthernet2/4You can view a summary of the configured parameters and statistics of network simulation using the show ips stats netsim ingress gigabit ethernet x/y command. The configuration parameters displayed by default are:
•
•
•
•
The optional configuration parameters are displayed only if they are currently configured on the specified port.
The following network statistics are also displayed:
•
•
•
•
switch# show ips stats netsim ingress gigabitethernet 2/3Network Simulator Configuration for Ingress on GigabitEthernet2/3Delay : 50000 microsecondsRate : 1000000 kbpsMax_q : 100000 bytesMax_qdelay : 600000 clocksRandom Drop % : 1.00%Network Simulator Statistics for Ingress on GigabitEthernet2/3Dropped (tot) = 28Dropped (netsim) = 14Reordered (netsim) = 0Max Qlen(pkt) = 7Qlen (pkt) = 0Max Qlen (byte) = 326Qlen (byte) = 0Mintxdel(poll) = 852Mintxdel(ethtx) = 360empty = 757txdel = 8late = 617Average speed = 0 Kbpsswitch# show ips stats netsim ingress gigabitethernet 2/4Network Simulator Configuration for Ingress on GigabitEthernet2/4Delay : 50000 microsecondsRate : 1000000 kbpsMax_q : 100000 bytesMax_qdelay : 600000 clocksReorder nth pkt : 50distance : 2Network Simulator Statistics for Ingress on GigabitEthernet2/4Dropped (tot) = 0Dropped (netsim) = 0Reordered (netsim) = 2Max Qlen(pkt) = 8Qlen (pkt) = 0Max Qlen (byte) = 0Qlen (byte) = 0Mintxdel(poll) = 3788Mintxdel(ethtx) = 360empty = 595txdel = 0late = 335Average speed = 0 KbpsIP Network Simulator Configuration Example
The following example shows how to set up and use the network simulator to introduce a network delay simulation. For continuity, the procedures for creating the Gigabit Ethernet interfaces and enabling the FCIP tunnels are included.
Step 1
switch# config tswitch(config)# interface gigabitethernet 2/3 no shutswitch(config)# interface gigabitethernet 2/4 no shutStep 2
switch(config)# san-ext-tuner enableswitch(config)# exitStep 3
switch# ips netsim enable interface gigabitethernet 2/3 gigabitethernet 2/4switch# show ips netsimFollowing ports operate in network simulator modeGigabitEthernet2/3 and GigabitEthernet2/4Step 4
switch# ips netsim delay-ms 50 ingress gigabitethernet 2/3switch# ips netsim delay-ms 50 ingress gigabitethernet 2/4Step 5
switch# show ips stats netsim ingress gigabitethernet 2/3Network Simulator Configuration for Ingress on GigabitEthernet2/3Delay : 50000 microsecondsRate : 1000000 kbpsMax_q : 100000 bytesMax_qdelay : 600000 clocksNetwork Simulator Statistics for Ingress on GigabitEthernet2/3Dropped (tot) = 0Dropped (ne) = 0Reordered (ne) = 0Max Qlen(pkt) = 5Qlen (pkt) = 0Max Qlen (byte) = 0Qlen (byte) = 0Mintxdel(poll) = 128322Mintxdel(ethtx) = 360empty = 9txdel = 0late = 7Average speed = 0 Kbps
Default Settings
Table 59-1 lists the default settings for the features included in this chapter.