Feedback Feedback
|
Table Of Contents
Cisco MDS 9000 Family Port Analyzer Adapter
Installation and Configuration NoteCisco MDS 9000 SPAN Usage Instructions
No Truncate Mode (NTM) for Ethernet Encapsulation
Ethernet Truncate Mode (ETM) for Maximum Payload
Deep Truncate Mode (DTM) for Most Frames per Second
Management Mode (MNM) for Troubleshooting
Installing the Port Analyzer Adapter
Troubleshooting the Port Analyzer Adapter
Ethernet Link LED Not Blinking
Setting Up the Cisco Traffic Analyzer
Using Cisco Traffic Analyzer with Fabric Manager Web Services
Installing Cisco Traffic Analyzer
Launching Cisco Traffic Analyzer
Discovering Cisco Traffic Analyzer from Fabric Manager Web Services
Accessing Cisco Traffic Analyzer from Fabric Manager Web Services
Configuring Cisco Traffic Analyzer for Fabric Manager Releases Prior to 2.1(2)
Setting Up the Cisco Protocol Analyzer
Ethernet Frame Addressing Format
Regulatory Compliance and Safety Information
Installation and Configuration Note
Cisco MDS 9000 Family Port Analyzer Adapter
Installation and Configuration Note
Text Part Number: OL-9077-01
This document describes the Cisco MDS 9000 Family Port Analyzer Adapter (DS-PAA and DS-PAA2), and the procedures required to install and configure it. It also describes setting up Cisco Traffic Analyzer and Cisco Protocol Analyzer solutions. This installation and configuration note includes the following sections:
•
Installing the Port Analyzer Adapter
•
•
•
•
•
Overview
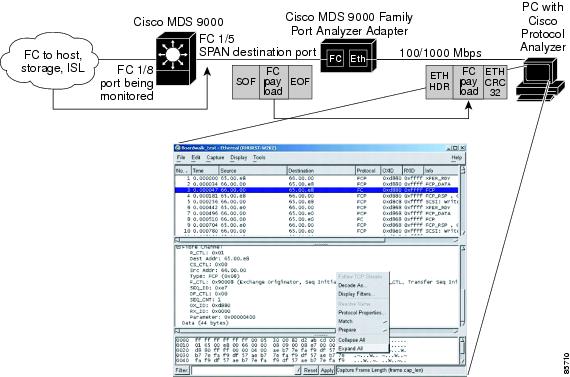
The PAA enables effective, low-cost analysis of Fibre Channel traffic. The device is a standalone Fibre Channel-to-Ethernet adapter, designed primarily to analyze Fibre Channel Switched Port Analyzer (SPAN) traffic from a Fibre Channel port on a Cisco MDS 9000 Family switch. The main function of the adapter is to encapsulate Fibre Channel frames into Ethernet frames. This encapsulation allows low-cost analysis of Fibre Channel traffic while leveraging the existing Ethernet infrastructure.
The PAA allows you to examine Fibre Channel frames of various sizes. Fibre Channel frames from Layers 2, 3, and 4 may be examined without network disruption.
The PAA works in conjunction with the SPAN feature on the Cisco MDS 9000 Family of switches. The SPAN feature allows storage network administrators to nondisruptively replicate any port's traffic to any other port that is programmed as a SPAN destination(SD port). It encapsulates the Fibre Channel frames from the SD port into Ethernet frames that can be analyzed on a PC. Storage administrators can troubleshoot the network quickly and cost-effectively, with no network disruption.
You can copy frames using the Cisco Protocol Analyzer or the Cisco Traffic Analyzer. The Cisco Protocol Analyzer is a modified version of Ethereal, and the Cisco Traffic Analyzer is a modified version of nTop, a network traffic probe. Both analyzers are modified to support Fibre Channel and SCSI.
Note
The PAA sets appropriate bits in the encapsulated trailer to indicate different types of errors (for example, CRC-errors, empty frame, jumbo frame, or other errors) during a data transfer. Both the Cisco Protocol Analyzer and the Cisco Traffic Analyzer can decode these packets, but they do so for different purposes. The Cisco Traffic Analyzer decodes packets for traffic analysis, and the Cisco Protocol Analyzer decodes packets for protocol analysis.
The adapter has two primary interfaces:
•
•
Note
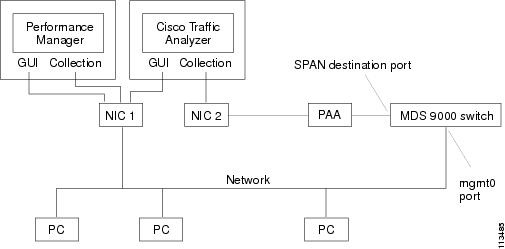
Figure 1 shows the PAA connected to a Fibre Channel port acting as an SD port on the Cisco MDS 9000 Family switch. The switch is connected by Ethernet to the PC that is running Cisco Protocol Analyzer.
Figure 1 Cisco MDS 9000 Family Port Analyzer Adapter Network Topology Example
Installation Requirements
Before using the adapter in a network, verify the following:
•
•
•
•
•
Cisco MDS 9000 SPAN Usage Instructions
On the Cisco MDS 9000 Family switch, traffic through any Fibre Channel interface can be replicated to an SD port. When a port is configured in SD mode, a copy of traffic (ingress, egress, or both) from a set of configured ports is sent to the SD port.
Tip
Note
A valid Fibre Channel port on a Cisco MDS 9000 Family switch must be configured as an SD port. Once a Fibre Channel port is in SD port mode, it cannot be used for normal data traffic.
In SD port mode, the Fibre Channel port of the switch has the following characteristics:
•
•
•
•
The following usage considerations apply to a PAA connected to a Cisco MDS 9000 Family switch:
•
•
Hardware Description
See the front view of the Port Analyzer Adapter in Figure 2and the rear view in Figure 3.
Figure 2 Cisco MDS 9000 Family Port Analyzer Adapter—Front View
Status LED
Ethernet LED for 100 Mbps
Fibre Channel Link LED
Ethernet port
Fibre Channel port
Ethernet LED for 1 Gbps
Fibre Channel Speed LED
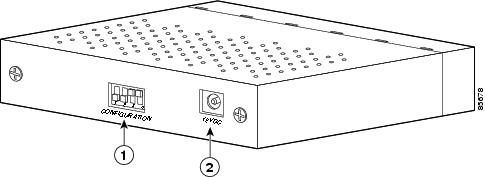
Figure 3 Cisco MDS 9000 Family Port Analyzer Adapter—Rear View
The four DIP switches, numbered 1 through 4 from left to right, are used to select the truncate mode as described in the "Modes of Operation" section.
LED Descriptions
The PAA has five LEDs on its faceplate (see Figure 2).
Table 1 lists the LEDs, their conditions, and what the conditions indicate.
Power Generation
The PAA requires 12-VDC external power. An AC converter is provided and connects to the power input at the rear of the unit.
Modes of Operation
The PAA has five modes of operation, four truncation modes and one no-truncate mode. These modes are used to configure the size of the frames that will be copied from the Fibre Channel interface. The two factors that are used to determine the setting are:
•
•
This balance can be achieved by using one of the four truncate modes to increase or decrease the frame rate at the expense of reducing or increasing the payload. By truncating the Fibre Channel payload, the adapter can transmit more frames per second on the Ethernet interface.
There are four external DIP switches on the rear of the adapter, numbered 1 through 4, from left to right. These switches configure the PAA to operate at either 1-Gbps or 2-Gbps Fibre Channel speed in one of the five modes of operation.
The modes of operation are as follows:
•
•
•
•
•
A speed mismatch between the Fibre Channel and the Ethernet side of the adapter could affect the frame throughput on the Ethernet side. For example, if the Fibre Channel speed is set at 2 Gbps, and the Ethernet speed is set at 1 Gbps, and all packets on the Fibre Channel side are 2164 bytes in size, you must configure the adapter to DTM or STM mode for the Ethernet side to receive all frames. If the adapter were in ETM (or NTM) mode, it would drop packets on the Ethernet side, and the Ethereal Network Analyzer might not see all the frames. Table 2 shows how the DIP switches should be configured for each Fibre Channel port speed and operating mode.
Note
Caution
Truncate Mode
If you want to use truncate mode, you need the DS-PAA-2. DS-PAA does not support this.
The Cisco Traffic Analyzer's Fibre Channel throughput values are not accurate when used with the DS-PAA if data truncate is enabled. The DS-PAA-2 is required to achieve accurate results with truncate because it adds a count that enables the Cisco Traffic Analyzer to determine how many data bytes were actually transferred. By truncating a frame, you can push more packets through the PAA (2 Gbps for Fibre Channel to 1 Gbps or slower for Ethernet) and preserve privacy of the traffic being captured.
Selecting Truncate Mode
Note
Table 3 shows an example of how to select the truncate mode according to the average size of the Fibre Channel frame and the Fibre Channel-to-Ethernet speed. For example, with a 2164-byte Fibre Channel frame size, 1-Gbps Fibre Channel speed, and 100-Mbps Ethernet speed, you would select DTM mode.
The truncate modes can be hot switched (no power off is necessary). However, if you configure a new speed setting (for example, changing the Fibre Channel port speed from 2 Gbps to 1 Gbps), the adapter must be power cycled for the new setting to take effect. Power cycling consists of unplugging the adapter wall plug, waiting for four seconds or more, and then plugging it back in and powering on.
No Truncate Mode (NTM) for Ethernet Encapsulation
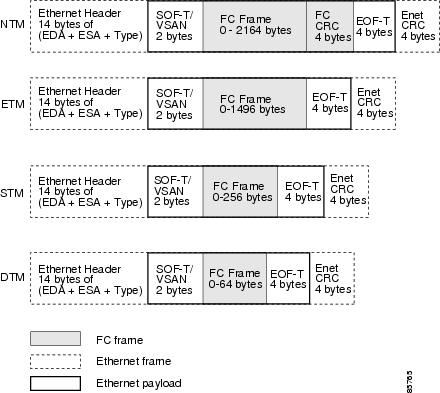
In NTM, Fibre Channel frames are encapsulated into Ethernet frames without any modification to the payload (the full 2164 bytes are transmitted). Ethernet devices must support jumbo frames for this mode to work; otherwise, the Ethernet MAC may not work properly for the frames larger than the maximum Ethernet size. Jumbo frames are Ethernet frames greater than 1520 bytes. (See Figure 4.)
Ethernet Truncate Mode (ETM) for Maximum Payload
This mode is appropriate when jumbo frames are not supported by the Ethernet devices. In that case, this mode provides the maximum amount of Fibre Channel payload within a single Ethernet frame.
Figure 4
Ethernet Frames and the Four Truncate Modes
In ETM, the adapter truncates a Fibre Channel frame to a maximum payload of 1496 bytes on the Ethernet side. Fibre Channel frames larger than 1496 bytes will be truncated. The Fibre Channel payload transmitted is 1472 bytes. (See Figure 4.)
Shallow Truncate Mode (STM)
STM provides less payload than ETM but more frames per second. In STM, the adapter truncates the Fibre Channel frame to 256 bytes. (See Figure 4.) Use this mode when you want more frames per second.
Deep Truncate Mode (DTM) for Most Frames per Second
As a default, the adapter comes configured in DTM mode and 1-Gbps Fibre Channel speed. This mode should be used when you want the most frames per second. DTM provides less payload than STM but more frames per second.
In DTM, the adapter truncates the Fibre Channel frame to 64 bytes. The total packet length including the Ethernet header and trailer is 88 bytes. (See Figure 4.)
Management Mode (MNM) for Troubleshooting
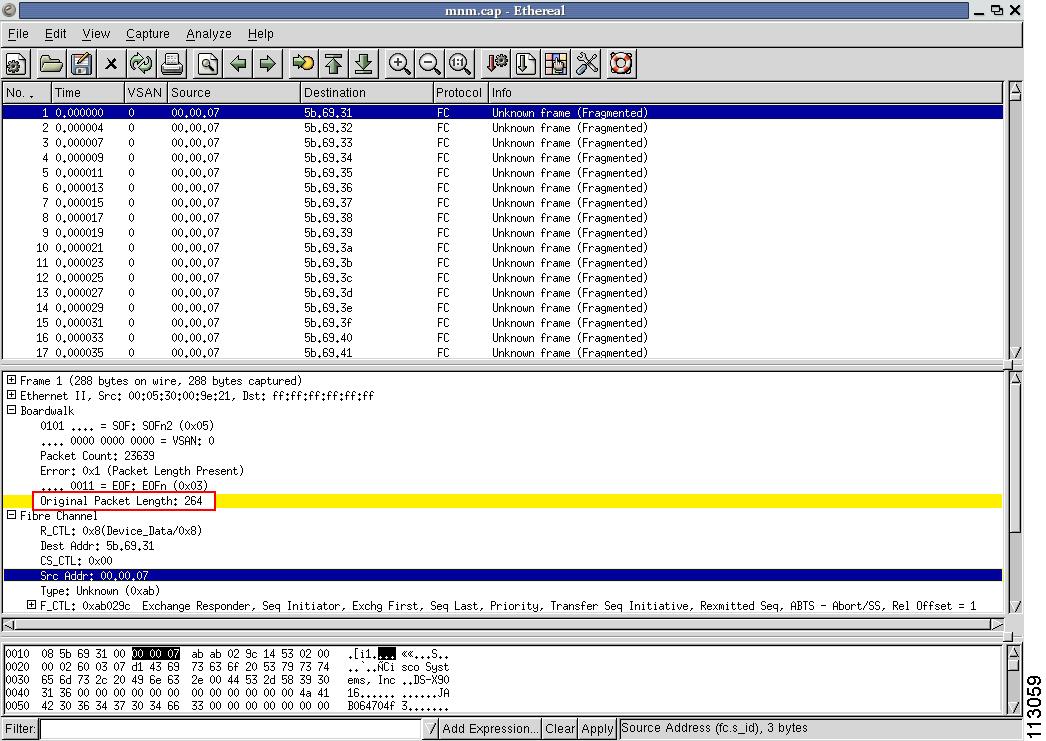
MNM mode should be used only when troubleshooting the PAA. In this mode, the adapter will not accept any Fibre Channel frames.
In MNM, the adapter transmits a fixed 288-byte Ethernet frame that contains debug information for your use or for technical support calls. When calling technical support, also know the version number of the adapter . There are two versions of PAA, PAA-1 and PAA-2. If you see the Original Packet Length field in the debug information (highlighted in Figure 5), you are using a PAA-2. If this field is not present, you are using PAA-1.
Note
Figure 5 Finding the PAA Version in Management Mode
The modes of operation are as follows:
•
•
•
•
•
Installing the Port Analyzer Adapter
Note
To install the Cisco MDS 9000 Family Port Analyzer Adapter, follow these steps:
Step 1
Step 2
Step 3
Figure 6
Connecting the Fibre Channel and Ethernet Ports
Figure 7 Multimode Fiber with LC Connector
Step 4
Table 4 lists the connector pinouts and signal names for straight-through cables that operate in Media-Dependent Interface (MDI) mode for Fast Ethernet ports.
Figure 8 Cross-over Cable for Connection to Ethernet Switch
Table 5 lists the connector pinouts and signal names for the cross-over cable.
Table 5 Cross-over Ethernet Cable Pinout
1
Tx+
3
Rx+
2
Tx-
6
Rx-
3
Rx+
1
Tx+
6
Rx-
2
Tx-
4, 5, 7, 8
-
4, 5, 7, 8
-
Step 5
Troubleshooting the Port Analyzer Adapter
The front panel LEDs are the quickest way to evaluate the adapter operation.
Fibre Channel LED Not On
If the green Fibre Channel LED is not on, check to see if the GBIC is fully inserted. Try removing and reinstalling the GBIC. See the appropriate Cisco MDS hardware installation guide for installation of the required chassis.
Ethernet Link LED Not Blinking
If the Fibre Channel link is up but the Ethernet link LED is not blinking, do the following:
•
•
Setting Up the Cisco Traffic Analyzer
The Cisco Traffic Analyzer provides real-time analysis of SPAN traffic or analysis of captured traffic through a web browser user interface. Traffic encapsulated by one or more adapters can be analyzed concurrently with a single PC running nTop software, which is public domain software enhanced by Cisco for Fibre Channel traffic analysis.
This traffic analysis solution enables throughput to be determined for traffic between specific Fibre Channel sources and destinations, for all traffic in a particular virtual SAN (VSAN), or for all SPAN traffic. The following information is provided: round trip response times, SCSI I/Os per second, SCSI read versus write traffic throughput and frame counts, and SCSI session status and management task information. Additional statistics are also available on Fibre Channel frame sizes and network management protocols.
For seamless performance analysis and troubleshooting, launch the Cisco Traffic Analyzer in-context from Cisco Fabric Manager. Port world wide name (pWWN), Fibre Channel ID (FC ID), FC alias, and VSAN names are then passed to the Cisco Traffic Analyzer.
Note
The nTop software runs on a host, such as a PC or workstation running Windows or Linux. This software, which supports VSANs and Fibre Channel decoding through the adapter, includes enhancements provided by Cisco to the public domain.
Note
Caution
Tip
Caution
Using Cisco Traffic Analyzer with Fabric Manager Web Services
You can run Cisco Traffic Analyzer from within Fabric Manager Web Services in Fabric Manager Release 2.1(2) or later.
Note
This section includes the following topics:
•
•
•
•
•
Installing Cisco Traffic Analyzer
You must launch Cisco Traffic Analyzer before you can discover and access it from Fabric Manager Web Services. At a minimum, you need to provide the directory where Cisco Traffic Analyzer stores its database, including the RRD files that it creates for trending.
Note
Verify that you have sufficient space in the partition where the Cisco Traffic Analyzer database is stored.
To install and launch Cisco Traffic Analyzer on a UNIX workstation, follow these steps:
Step 1
http://cisco.com/cgi-bin/tablebuild.pl/mds-fm.Step 2
http://www.ntop.org.Step 3
ntop -P database_directorywhere database_directory is the directory where you want Cisco Traffic Analyzer to save its database files (for example, /var/ntop).
Note
ntop.exe /c -P tmp -w port_number, where port_number is equal to the port that you want Cisco Traffic Analyzer to use. Set the port number to 3001 if you want to use SSL. Fabric Manager Web Services can only detect Cisco Traffic Analyzer if you use port 3000 (the default port).Step 4
Figure 9 Fibre Channel Port on the PAA connected to an SD Port
Step 5
Step 6
Step 7
Step 8
In Windows, you can use the \tmp directory provided with the distribution to store the Cisco Traffic Analyzer database.
To install and launch Cisco Traffic Analyzer on a Windows workstation, follow these steps:
Step 1
http://cisco.com/cgi-bin/tablebuild.pl/mds-fm.Step 2
Step 3
Note
http://winpcap.polito.it/.Step 4
Step 5
a.
b.
c.
d.
Note
Note
ntop.exe /c -P tmp -w port_number, where port_number is equal to the port that you want Cisco Traffic Analyzer to use. Set the port number to 3001 if you want to use SSL. Fabric Manager Web Services can only detect Cisco Traffic Analyzer if you use port 3000 (the default port).e.
Note
Step 6
Step 7
Step 8
Step 9
Step 10
Step 11
Step 12
Tip
—Linux platforms use the shell script path. The nTop output is sent to the syslog file (/var/log/messages by default).
—Windows platforms use the batch file. The nTop output is sent to a file located in the same directory as the one from which nTop is launched.You can remove Cisco Traffic Analyzer as a service by entering the following command at the Windows command prompt:
ntop.exe /rLaunching Cisco Traffic Analyzer
To access an instance of Cisco Traffic Analyzer running in your fabric from Fabric Manager Web Services, follow these steps:
Step 1
Step 2
To launch the Cisco Traffic Analyzer outside Fabric Manager, follow these steps:
Step 1
cd /usr/local/fc-ntopsh -x ntop.shStep 2
Tip
—Linux platforms use the shell script path. The nTop output is sent to the syslog file (/var/log/messages by default).
—Windows platforms use the batch file. The nTop output is sent to a file located in the same directory as the one from which nTop is launched.
Discovering Cisco Traffic Analyzer from Fabric Manager Web Services
Fabric Manager Release 2.1(2) or later supports discovering instances of Cisco Traffic Analyzer and SPAN ports configured within your fabric from Fabric Manager Web Services.
Fabric Manager Web Services supports the following Traffic Analyzer integration features:
•
•
•
•
•
To discover instances of Traffic Analyzer running in your fabric from Fabric Manager Web Services, follow these steps:
Step 1
Step 2
Step 3
Step 4
Note
Accessing Cisco Traffic Analyzer from Fabric Manager Web Services
To access an instance of Cisco Traffic Analyzer running in your fabric from Fabric Manager Web Services, follow these steps:
Step 1
Step 2
If you did not configure the switch and switch port information in Cisco Traffic Analyzer, you can still discover it, but Fabric Manager Web Services cannot associate that instance of Cisco Traffic Analyzer with any fabric. Cisco Traffic Analyzer also cannot inherit the device alias information from Fabric Manager Web Services.
Fabric Manager Web Services updates Cisco Traffic Analyzer with the latest device alias information every five minutes.
Configuring Cisco Traffic Analyzer for Fabric Manager Releases Prior to 2.1(2)
To configure Performance Manager to work with Cisco Traffic Analyzer for Fabric Manager releases prior to Release 2.1(2), follow these steps:
Step 1
•
•
•
Step 2
a.
b.
http://ip_address:port_numberwhere ip_address is the address of the management workstation on which you have installed the Cisco Traffic Analyzer, and :port_number is the port that is used by Cisco Traffic Analyzer (the default is :3000).
c.
d.
e.
D:directory\ntop.batwhere D: is the drive letter for the disk drive where Cisco Traffic Analyzer is installed, and
directory is the directory containing the ntop.bat file.
f.
Step 3
Step 4
a.
b.
c.
http://ip address/directorywhere ip address is the address of the management workstation on which you have installed Cisco Traffic Analyzer, and directory is the path to the directory where Cisco Traffic Analyzer is installed.
d.
e.
f.
Note
Step 5
Setting Up the Cisco Protocol Analyzer
The Cisco Protocol Analyzer enables Fibre Channel traffic to be analyzed at the frame level in real-time or from captured SPAN traffic through a graphical user interface. Traffic encapsulated by an adapter can be analyzed by Ethereal, a public domain software enhanced by Cisco for Fibre Channel and SCSI protocol decoding.
Ethereal can analyze traffic from a single adapter at a time when running on Microsoft Windows, but it can capture and analyze aggregate traffic from multiple adapters when running on Linux. Ethereal filters captured data to reduce file size, and it filters the information displayed so that it is easy to locate the frames of greatest interest. Its unique ability to match Fibre Channel requests and responses greatly simplifies analysis and searching for detailed information, including response times. Ethereal has also been enhanced to be VSAN aware.
The Ethereal software runs on a host, such as a PC or workstation running Windows or Linux. This software, which supports VSAN and Fibre Channel decoding through the adapter, includes enhancements provided by Cisco to the public domain.
Download the latest version of Ethereal from http://www.ethereal.com. If you need to perform remote captures, use the version provided at the Cisco Software Center.
Note
To install the Ethereal software on a PC with the Windows operating system, follow these steps:
Step 1
Step 2
Step 3
Step 4
Step 5
Step 6
Creating Display Filters
You can selectively view captured frames by using the display filters feature. For example, instead of viewing all the frames from a capture, you may want to view only ELP request frames. This feature limits the captured view only—it does not affect the captured or the saved frames. Procedures to specify, use, and save display filters are already documented at the following website under MDS 9000 Family software: http://www.cisco.com/kobayashi/sw-center/sw-stornet.shtml. Click Cisco MDS 9000 Family Port Analyzer Adapter to view the filters. The following list includes examples of ways to use this feature:
•
mdshdr.vsan == 2 || brdwlk.vsan == 2•
fcswils•
mdshdr.sof == SOFf || brdwlk.sof == SOFf•
swils.opcode == JLO || swils.opcode == LSU || swils.opcode == LSA•
fcels.opcode == FLOGI•
fcels.opcode == FLOGI && (mdshdr.vsan == 2 || brdwlk.vsan == 2)•
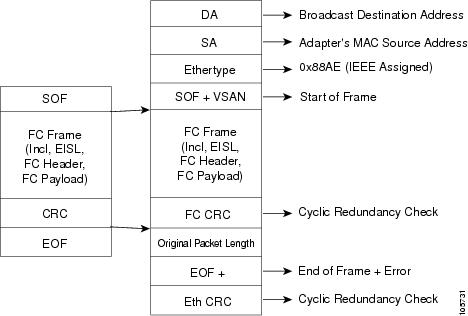
dNSEthernet Frame Addressing Format
This section describes fields in the Ethernet frame, after the adapter encapsulates the Fibre Channel frame into an Ethernet frame. (See Figure 10.)
Figure 10 Fibre Channel Encapsulation
The following list shows the fields of an Ethernet frame:
•
•
•
•
Related Documentation
The documentation set for the Cisco MDS 9000 Family includes the following documents. To find a document online, use the Cisco MDS SAN-OS Documentation Locator at:
http://www.cisco.com/en/US/products/ps5989/products_documentation_roadmap09186a00804500c1.html.
For information on IBM TotalStorage SAN Volume Controller Storage Software for the Cisco MDS 9000 Family, refer to the IBM TotalStorage Support website:
http://www.ibm.com/storage/support/2062-2300/
Release Notes
•
•
•
•
Compatibility Information
•
•
•
•
•
Regulatory Compliance and Safety Information
•
Hardware Installation
•
•
•
•
•
27
Cisco Fabric Manager
•
•
•
•
Command-Line Interface
•
•
•
•
•
•
•
Troubleshooting and Reference
•
•
•
•
•
•
Installation and Configuration Note
•
•
Obtaining Documentation
Cisco documentation and additional literature are available on Cisco.com. Cisco also provides several ways to obtain technical assistance and other technical resources. These sections explain how to obtain technical information from Cisco Systems.
Cisco.com
You can access the most current Cisco documentation at this URL:
http://www.cisco.com/techsupport
You can access the Cisco website at this URL:
You can access international Cisco websites at this URL:
http://www.cisco.com/public/countries_languages.shtml
Product Documentation DVD
Cisco documentation and additional literature are available in the Product Documentation DVD package, which may have shipped with your product. The Product Documentation DVD is updated regularly and may be more current than printed documentation.
The Product Documentation DVD is a comprehensive library of technical product documentation on portable media. The DVD enables you to access multiple versions of hardware and software installation, configuration, and command guides for Cisco products and to view technical documentation in HTML. With the DVD, you have access to the same documentation that is found on the Cisco website without being connected to the Internet. Certain products also have .pdf versions of the documentation available.
The Product Documentation DVD is available as a single unit or as a subscription. Registered Cisco.com users (Cisco direct customers) can order a Product Documentation DVD (product number DOC-DOCDVD=) from Cisco Marketplace at this URL:
http://www.cisco.com/go/marketplace/
Ordering Documentation
Beginning June 30, 2005, registered Cisco.com users may order Cisco documentation at the Product Documentation Store in the Cisco Marketplace at this URL:
http://www.cisco.com/go/marketplace/
Nonregistered Cisco.com users can order technical documentation from 8:00 a.m. to 5:00 p.m. (0800 to 1700) PDT by calling 1 866 463-3487 in the United States and Canada, or elsewhere by calling 011 408 519-5055. You can also order documentation by e-mail at tech-doc-store-mkpl@external.cisco.com or by fax at 1 408 519-5001 in the United States and Canada, or elsewhere at 011 408 519-5001.
Documentation Feedback
You can rate and provide feedback about Cisco technical documents by completing the online feedback form that appears with the technical documents on Cisco.com.
You can send comments about Cisco documentation to bug-doc@cisco.com.
You can submit comments by using the response card (if present) behind the front cover of your document or by writing to the following address:
Cisco Systems
Attn: Customer Document Ordering
170 West Tasman Drive
San Jose, CA 95134-9883We appreciate your comments.
© 2002 - 2005 Cisco Systems, Inc. All rights reserved.
Printed in the USA on recycled paper containing 10% postconsumer waste.