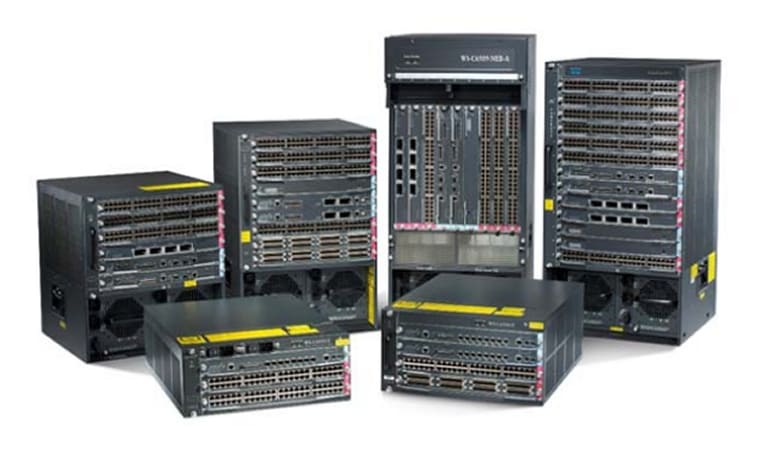
Table Of Contents
show service-policy through show xlate Commands
show service-policy
show service-policy inspect gtp
show shun
show sip
show skinny
show snmp-server statistics
show ssh sessions
show startup-config
show sunrpc-server active
show tcpstat
show tech-support
show traffic
show uauth
show url-block
show url-cache statistics
show url-server
show version
show vlan
show vpn-sessiondb
show vpn-sessiondb ratio
show vpn-sessiondb summary
show xlate
show service-policy through show xlate Commands
show service-policy
To display the configured service policies, use the show service-policy command in global configuration mode.
show service-policy [global | interface intf] [inspect application_type [option] | set connection |
flow protocol {host src_host | src_ip src_mask} [eq src_port] {host dest_host |
dest_ip dest_mask} [eq dest_port] [icmp_number | icmp_control_message]]
Syntax Description
application_type
|
Sets the application type for which to show inspect statistics. Supported applications include esmtp, gtp, http, and sip.
|
dest_ip
|
The destination IP address of the traffic flow.
|
dest_mask
|
The subnet mask of the traffic flow destination IP address.
|
eq dest_port
|
(Optional) If you specify the flow protocol to be TCP or UDP, then you can specify the destination port used in the traffic flow.
|
eq src_port
|
(Optional) If you specify the flow protocol to be TCP or UDP, then you can specify the source port used in the traffic flow.
|
flow
|
(Optional) Specifies a traffic flow for which you want to see the policies that the FWSM would apply to the flow. The arguments and keywords following the flow keyword specify the flow in ip-5-tuple format.
|
global
|
(Optional) Limits output to the global policy, which applies to all interfaces.
|
host dest_host
|
The host destination IP address of the traffic flow.
|
host src_host
|
The host source IP address of the traffic flow.
|
icmp_control_message
|
(Optional) If you specify the flow protocol to be ICMP, this argument specifies an ICMP control message of the traffic flow. For valid values for the icmp_control_message argument, enter the show service-policy flow icmp {host src_host | src_ip src_mask} {host dest_host | dest_ip dest_mask} ? command.
|
icmp_number
|
(Optional) If you specify the flow protocol to be ICMP, this argument specifies the ICMP protocol number of the traffic flow.
|
inspect
|
(Optional) Limits the output to policies that include an inspect command.
|
interface intf
|
(Optional) Displays policies applied to the interface specified by the intf argument, where intf is the interface name given by the nameif command.
|
option
|
(Optional) Depending on the application type you specify with the inspect keyword, you can narrow the kind of statistics shown.
For esmtp and http:
• table—Shows runtime tables such as classification rules.
For gtp:
• pdp-context—Shows the status of GTP PDP contexts.
• pdpmcb—Shows the status of the GTP PDP Master Control Block
• requests—Shows the status of GTP requests.
• statistics—Shows the statistics of of the GTP inspection policy.
|
protocol
|
The protocol used in the traffic flow. For valid values for the protocol argument, enter the show service-policy flow ? command.
|
set connection
|
(Optional) Limits output to policies that include the set connection command.
|
src_ip
|
The source IP address used in the traffic flow.
|
src_mask
|
The source IP netmask used in the traffic flow.
|
Defaults
No default behavior or values.
Command Modes
The following table shows the modes in which you can enter the command:
Command Mode
|
Firewall Mode
|
Security Context
|
Routed
|
Transparent
|
Single
|
Multiple
|
Context
|
System
|
Global configuration
|
•
|
•
|
•
|
•
|
—
|
Command History
Release
|
Modification
|
3.1(1)
|
This command was introduced.
|
Usage Guidelines
The flow keyword lets you determine, for any flow that you can describe, the policies that the FWSM would apply to that flow. You can use this to check that your service policy configuration will provide the services you want for specific connections. The arguments and keywords following the flow keyword specifies the flow in ip-5-tuple format with no object grouping.
Because the flow is described in ip-5-tuple format, not all match criteria are supported. Following are the list of match criteria that are supported for flow match:
•
match access-list
•
match port
•
match default-inspection-traffic
The number of embryonic connections displayed in the show service-policy command output indicates the current number of embryonic connections to an interface for traffic matching that defined by the class-map command.
Note
When you configure the set connection conn-rate-limit command, the output of show service-policy does not show current connection rate and drop count even if the policy is hit:
hostname# show service-policy
Set connection policy: conn-rate-limit 10
current conn rate 0, drop 0
This is because of a limitation in the network processor.
Examples
The following is sample output from the show service-policy global command:
hostname# show service-policy global
Service-policy: global_policy
Class-map: inspection_default
Inspect: dns maximum-length 512, packet 0, drop 0, reset-drop 0
Inspect: ftp, packet 0, drop 0, reset-drop 0
Inspect: h323 h225, packet 0, drop 0, reset-drop 0
Inspect: h323 ras, packet 0, drop 0, reset-drop 0
Inspect: netbios, packet 0, drop 0, reset-drop 0
Inspect: rsh, packet 0, drop 0, reset-drop 0
Inspect: skinny, packet 0, drop 0, reset-drop 0
Inspect: sqlnet, packet 0, drop 0, reset-drop 0
Inspect: sunrpc, packet 0, drop 0, reset-drop 0
Inspect: tftp, packet 0, drop 0, reset-drop 0
Inspect: sip, packet 0, drop 0, reset-drop 0
Inspect: xdmcp, packet 0, drop 0, reset-drop 0
The following is sample output from the show service-policy flow command:
hostname# show service-policy flow udp host 209.165.200.229 host 209.165.202.158 eq 5060
Service-policy: global_policy
Class-map: inspection_default
Match: default-inspection-traffic
Access rule: permit ip 209.165.200.229 255.255.255.224 209.165.202.158
255.255.255.224
Input flow: set connection conn-max 10
The following is sample output from the show service-policy inspect http command. This example shows the statistics of each match command in a match-any class map.
hostname# show service-policy inspect http
Service-policy: global_policy
Class-map: inspection_default
Inspect: http http, packet 1916, drop 0, reset-drop 0
class http_any (match-any)
Match: request method get, 638 packets
Match: request method put, 10 packets
Match: request method post, 0 packets
Match: request method connect, 0 packets
Related Commands
Command
|
Description
|
clear configure service-policy
|
Clears service policy configurations.
|
clear service-policy
|
Clears all service policy configurations.
|
service-policy
|
Configures the service policy.
|
show running-config service-policy
|
Displays the service policies configured in the running configuration.
|
show service-policy inspect gtp
To display the GTP configuration, use the show service-policy inspect gtp command in privileged EXEC mode.
show service-policy [interface int] inspect gtp {pdp-context [apn ap_name | detail | imsi
IMSI_value | ms-addr IP_address | tid tunnel_ID | version version_num ] | pdpmcb | requests
| statistics [gsn IP_address] }
Syntax Description
apn
|
(Optional) Displays the detailed output of the PDP contexts based on the APN specified.
|
ap_name
|
Identifies the specific access point name for which statistics are displayed.
|
detail
|
(Optional) Displays the detailed output of the PDP contexts.
|
imsi
|
Displays the detailed output of the PDP contexts based on the IMSI specified.
|
IMSI_value
|
Hexadecimal value that identifies the specific IMSI for which statistics are displayed.
|
interface
|
(Optional) Identifies a specific interface.
|
int
|
Identifies the interface for which information will be displayed.
|
gsn
|
(Optional) Identifies the GPRS support node, which is interface between the GPRS wireless data network and other networks.
|
gtp
|
(Optional) Displays the service policy for GTP.
|
IP_address
|
IP address for which statistics are displayed.
|
ms-addr
|
(Optional) Displays the detailed output of the PDP contexts based on the MS Address specified.
|
pdp-context
|
(Optional) Identifies the Packet Data Protocol context.
|
pdpmcb
|
(Optional) Displays the status of the PDP master control block.
|
requests
|
(Optional) Displays status of GTP requests.
|
statistics
|
(Optional) Displays GTP statistics.
|
tid
|
(Optional) Displays the detailed output of the PDP contexts based on the TID specified.
|
tunnel_ID
|
Hexadecimal value that identifies the specific tunnel for which statistics are displayed.
|
version
|
(Optional) Displays the detailed output of the PDP contexts based on the GTP version.
|
version_num
|
Specifies the version of the PDP context for which statistics are displayed. The valid range is 0 to 255.
|
.
Defaults
No default behavior or values.
Command Modes
The following table shows the modes in which you can enter the command:
Command Mode
|
Firewall Mode
|
Security Context
|
Routed
|
Transparent
|
Single
|
Multiple
|
Context
|
System
|
Privileged EXEC
|
•
|
•
|
•
|
•
|
—
|
Command History
Release
|
Modification
|
3.1(1)
|
This command was introduced.
|
Usage Guidelines
You can use the vertical bar | to filter the display. Type | for more display filtering options.
The show pdp-context command displays PDP context-related information.
The Packet Data Protocol context is identified by the tunnel ID, which is a combination of IMSI and NSAPI. A GTP tunnel is defined by two associated PDP Contexts in different GSN nodes and is identified with a Tunnel ID. A GTP tunnel is necessary to forward packets between an external packet data network and a mobile station user.
The show gtp requests command displays current requests in the request queue.
Examples
The following is sample output from the show gtp requests command:
hostname# show gtp requests
0 in use, 0 most used, 200 maximum allowed
You can use the vertical bar | to filter the display, as in the following example:
hostname# show service-policy gtp statistics | grep gsn
This example shows the GTP statistics with the word gsn in the output.
The following command shows the statistics for GTP inspection:
hostname# show service-policy inspect gtp statistics
version_not_support | 0 | msg_too_short | 0
unknown_msg | 0 | unexpected_sig_msg | 0
unexpected_data_msg | 0 | ie_duplicated | 0
mandatory_ie_missing | 0 | mandatory_ie_incorrect | 0
optional_ie_incorrect | 0 | ie_unknown | 0
ie_out_of_order | 0 | ie_unexpected | 0
total_forwarded | 0 | total_dropped | 0
signalling_msg_dropped | 0 | data_msg_dropped | 0
signalling_msg_forwarded | 0 | data_msg_forwarded | 0
total created_pdp | 0 | total deleted_pdp | 0
total created_pdpmcb | 0 | total deleted_pdpmcb | 0
The following command displays information about the PDP contexts:
hostname# show service-policy inspect gtp pdp-context
1 in use, 1 most used, timeout 0:00:00
Version TID | MS Addr | SGSN Addr | Idle | APN
v1 | 1234567890123425 | 1.1.1.1 | 11.0.0.2 0:00:13 gprs.cisco.com
| user_name (IMSI): 214365870921435 | MS address: | 1.1.1.1
| primary pdp: Y | nsapi: 2
| sgsn_addr_signal: | 11.0.0.2 | sgsn_addr_data: | 11.0.0.2
| ggsn_addr_signal: | 9.9.9.9 | ggsn_addr_data: | 9.9.9.9
| sgsn control teid: | 0x000001d1 | sgsn data teid: | 0x000001d3
| ggsn control teid: | 0x6306ffa0 | ggsn data teid: | 0x6305f9fc
| seq_tpdu_up: | 0 | seq_tpdu_down: | 0
| upstream_signal_flow: | 0 | upstream_data_flow: | 0
| downstream_signal_flow: | 0 | downstream_data_flow: | 0
Table 30-1 describes each column the output from the show service-policy inspect gtp pdp-context command.
Table 30-1 PDP Contexts
Column Heading
|
Description
|
Version
|
Displays the version of GTP.
|
TID
|
Displays the tunnel identifier.
|
MS Addr
|
Displays the mobile station address.
|
SGSN Addr
|
Displays the serving gateway service node.
|
Idle
|
Displays the time for which the PDP context has not been in use.
|
APN
|
Displays the access point name.
|
Related Commands
Commands
|
Description
|
class-map
|
Defines the traffic class to which to apply security actions.
|
clear service-policy inspect gtp
|
Clears global GTP statistics.
|
debug gtp
|
Displays detailed information about GTP inspection.
|
gtp-map
|
Defines a GTP map and enables GTP map configuration mode.
|
inspect gtp
|
Applies a specific GTP map to use for application inspection.
|
show shun
To display shun information, use the show shun command in privileged EXEC mode.
show shun [src_ip | statistics]
Syntax Description
src_ip
|
(Optional) Displays the information for that address.
|
statistics
|
(Optional) Displays the interface counters only.
|
Defaults
No default behavior or values.
Command Modes
The following table shows the modes in which you can enter the command:
Command Mode
|
Firewall Mode
|
Security Context
|
Routed
|
Transparent
|
Single
|
Multiple
|
Context
|
System
|
Privileged EXEC
|
•
|
•
|
•
|
•
|
—
|
Command History
Release
|
Modification
|
1.1(1)
|
This command was introduced.
|
Examples
The following is sample output from the show shun command:
shun (outside) 10.1.1.27 10.2.2.89 555 666 6
shun (inside1) 10.1.1.27 10.2.2.89 555 666 6
Related Commands
Command
|
Description
|
clear shun
|
Disables all the shuns that are currently enabled and clears the shun statistics.
|
shun
|
Enables a dynamic response to an attacking host by preventing new connections and disallowing packets from any existing connection.
|
show sip
To display SIP sessions, use the show sip command in privileged EXEC mode.
show sip
Syntax Description
This command has no arguments or keywords.
Defaults
No default behavior or values.
Command Modes
The following table shows the modes in which you can enter the command:
Command Mode
|
Firewall Mode
|
Security Context
|
Routed
|
Transparent
|
Single
|
Multiple
|
Context
|
System
|
Privileged EXEC
|
•
|
•
|
•
|
•
|
•
|
Command History
Release
|
Modification
|
3.1(1)
|
This command was introduced.
|
Usage Guidelines
The show sip command assists in troubleshooting SIP inspection engine issues and is described with the inspect protocol sip udp 5060 command. The show timeout sip command displays the timeout value of the designated protocol.
The show sip command displays information for SIP sessions established across the FWSM. Along with the debug sip and show local-host commands, this command is used for troubleshooting SIP inspection engine issues.
Note
We recommend that you configure the pager command before using the show sip command. If there are a lot of SIP session records and the pager command is not configured, it will take a while for the show sip command output to reach its end.
Examples
The following is sample output from the show sip command:
call-id c3943000-960ca-2e43-228f@10.130.56.44
| state Call init, idle 0:00:01
call-id c3943000-860ca-7e1f-11f7@10.130.56.45
| state Active, idle 0:00:06
This sample shows two active SIP sessions on the FWSM (as shown in the Total field). Each call-id represents a call.
The first session, with the call-id c3943000-960ca-2e43-228f@10.130.56.44, is in the state Call Init, which means the session is still in call setup. Call setup is complete only when the ACK is seen. This session has been idle for 1 second.
The second session is in the state Active, in which call setup is complete and the endpoints are exchanging media. This session has been idle for 6 seconds.
Related Commands
Commands
|
Description
|
class-map
|
Defines the traffic class to which to apply security actions.
|
debug sip
|
Enables debug information for SIP.
|
inspect sip
|
Enables SIP application inspection.
|
show conn
|
Displays the connection state for different connection types.
|
timeout
|
Sets the maximum idle time duration for different protocols and session types.
|
show skinny
To troubleshoot SCCP (Skinny) inspection engine issues, use the show skinny command in privileged EXEC mode.
show skinny [audio | video]
Syntax Description
audio
|
Limits output to audio-related information.
|
video
|
Limits output to video-related information.
|
Defaults
If you do not use the audio or video keywords, output contains information for both audio and video, as applicable.
Command Modes
The following table shows the modes in which you can enter the command:
Command Mode
|
Firewall Mode
|
Security Context
|
Routed
|
Transparent
|
Single
|
Multiple
|
Context
|
System
|
Privileged EXEC
|
•
|
•
|
•
|
•
|
—
|
Command History
Release
|
Modification
|
3.1(1)
|
This command was introduced.
|
Usage Guidelines
The show skinny command assists in troubleshooting SCCP (Skinny) inspection engine issues.
Examples
The following is sample output from the show skinny command under the following conditions. There are two active Skinny sessions set up across the FWSM. The first session is an audio session established between an internal Cisco IP Phone at local address 10.0.0.11 and an external Cisco CallManager at 172.18.1.33. TCP port 2000 is the CallManager. The second one is a video session established between another internal Cisco IP Phone at local address 10.0.0.22 and the same Cisco CallManager.
---------------------------------------------------------------
1 10.0.0.11/52238 172.18.1.33/2000 1
AUDIO 10.0.0.11/22948 172.18.1.22/20798
2 10.0.0.22/52232 172.18.1.33/2000 1
VIDEO 10.0.0.22/20798 172.18.1.11/22948
The output indicates a call has been established between both internal Cisco IP Phones. The RTP listening ports of the first and second phones are UDP 22948 and 20798 respectively.
The following is the xlate information for these Skinny connections:
hostname# show xlate debug
Flags: D | DNS, d | dump, I | identity, i | inside, n | no random,
| o | outside, r | portmap, s | static
NAT from inside:10.0.0.11 to outside:172.18.1.11 flags si idle 0:00:16 timeout 0:05:00
NAT from inside:10.0.0.22 to outside:172.18.1.22 flags si idle 0:00:14 timeout 0:05:00
If you use the video keyword, output is limited to information about video sessions, as shown in the following example:
hostname# show skinny video
---------------------------------------------------------------
1 10.0.0.22/52232 172.18.1.33/2000 1
VIDEO 10.0.0.22/20798 172.18.1.11/22948
If you use the audio keyword, output is limited to information about audio sessions, as show in the following example:
hostname# show skinny audio
---------------------------------------------------------------
1 10.0.0.11/52238 172.18.1.33/2000 1
AUDIO 10.0.0.11/22948 172.18.1.22/20798
Related Commands
Commands
|
Description
|
class-map
|
Defines the traffic class to which to apply security actions.
|
debug skinny
|
Enables SCCP debug information.
|
inspect skinny
|
Enables SCCP application inspection.
|
show conn
|
Displays the connection state for different connection types.
|
timeout
|
Sets the maximum idle time duration for different protocols and session types.
|
show snmp-server statistics
To display information about the SNMP server statistics, use the show snmp-server statistics command in privileged EXEC mode.
show snmp-server statistics
Syntax Description
This command has no arguments or keywords.
Defaults
This command has no default settings.
Command Modes
The following table shows the modes in which you can enter the command:
Command Mode
|
Firewall Mode
|
Security Context
|
Routed
|
Transparent
|
Single
|
Multiple
|
Context
|
System
|
Privileged EXEC
|
·
|
·
|
·
|
·
|
|
Command History
Release
|
Modification
|
3.1(1)
|
Support for this command was introduced.
|
Examples
This example shows how to display the SNMP server statistics:
hostname# show snmp-server statistics
0 Bad SNMP version errors
0 Illegal operation for community name supplied
0 Number of requested variables
0 Number of altered variables
0 Set-request PDUs (Not supported)
0 Too big errors (Maximum packet size 512)
Related Commands
Command
|
Description
|
snmp-server
|
Provides the security appliance event information through SNMP.
|
clear configure snmp-server
|
Disables the Simple Network Management Protocol (SNMP) server.
|
show running-config snmp-server
|
Displays the SNMP server configuration.
|
show ssh sessions
To display information about the active SSH session on the FWSM, use the show ssh sessions command in privileged EXEC mode.
show ssh sessions [ip_address]
Syntax Description
ip_address
|
(Optional) Displays session information for only the specified IP address.
|
Defaults
No default behavior or values.
Command Modes
The following table shows the modes in which you can enter the command:
Command Mode
|
Firewall Mode
|
Security Context
|
Routed
|
Transparent
|
Single
|
Multiple
|
Context
|
System
|
Privileged EXEC
|
•
|
•
|
•
|
•
|
—
|
Command History
Release
|
Modification
|
1.1(1)
|
This command was introduced.
|
Usage Guidelines
The SID is a unique number that identifies the SSH session. The Client IP is the IP address of the system running an SSH client. The Version is the protocol version number that the SSH client supports. If the SSH only supports SSH version 1, then the Version column displays 1.5. If the SSH client supports both SSH version 1 and SSH version 2, then the Version column displays 1.99. If the SSH client only supports SSH version 2, then the Version column displays 2.0. The Encryption column shows the type of encryption that the SSH client is using. The State column shows the progress that the client is making as it interacts with the FWSM. The Username column lists the login username that has been authenticated for the session.
Examples
The following example shows sample output from the show ssh sessions command:
hostname# show ssh sessions
SID Client IP Version Mode Encryption Hmac State Username
0 172.69.39.39 1.99 IN aes128-cbc md5 SessionStarted pat
OUT aes128-cbc md5 SessionStarted pat
1 172.23.56.236 1.5 - 3DES - SessionStarted pat
2 172.69.39.29 1.99 IN 3des-cbc sha1 SessionStarted pat
OUT 3des-cbc sha1 SessionStarted pat
Related Commands
Command
|
Description
|
ssh disconnect
|
Disconnects an active SSH session.
|
ssh timeout
|
Sets the timeout value for idle SSH sessions.
|
show startup-config
To show the startup configuration or to show any errors when the startup configuration loaded, use the show startup-config command in privileged EXEC mode.
show startup-config [errors]
Syntax Description
errors
|
(Optional) Shows any errors that were generated when the FWSM loaded the startup configuration.
|
Defaults
No default behavior or values.
Command Modes
The following table shows the modes in which you can enter the command:
Command Mode
|
Firewall Mode
|
Security Context
|
Routed
|
Transparent
|
Single
|
Multiple
|
Context
|
|
Privileged EXEC
|
•
|
•
|
•
|
•
|
•
|
Command History
Release
|
Modification
|
1.1(1)
|
This command was introduced.
|
3.1(1)
|
The errors keyword was added.
|
Usage Guidelines
In multiple context mode, this command shows the startup configuration for your current execution space: the system configuration or the security context.
To clear the startup errors from memory, use the clear startup-config errors command.
Examples
The following is sample output from the show startup-config command:
hostname# show startup-config
: Written by enable_15 at 01:44:55.598 UTC Thu Apr 17 2003
interface GigabitEthernet0/0
ip address 10.86.194.60 255.255.254.0
interface GigabitEthernet0/1
ip address 10.10.4.200 255.255.0.0
enable password 8Ry2YjIyt7RRXU24 encrypted
passwd 2KFQnbNIdI.2KYOU encrypted
boot system disk0:/cdisk.bin
access-list xyz extended permit ip host 192.168.0.4 host 150.150.0.3
deny-request-cmd appe stor stou
Cryptochecksum:4edf97923899e712ed0da8c338e07e63
The following is sample output from the show startup-config errors command:
hostname# show startup-config errors
ERROR: 'Mac-addresses': invalid resource name
*** Output from config line 18, " limit-resource Mac-add..."
INFO: Admin context is required to get the interfaces
*** Output from config line 30, "arp timeout 14400"
Creating context 'admin'... WARNING: Invoked the stub function ibm_4gs3_context_
WARNING: Invoked the stub function ibm_4gs3_context_set_max_mgmt_sess
*** Output from config line 33, "admin-context admin"
WARNING: VLAN *24* is not configured.
*** Output from config line 12, context 'admin', " nameif inside"
*** Output from config line 37, " config-url disk:/admin..."
Related Commands
Command
|
Description
|
clear startup-config errors
|
Clears the startup errors from memory.
|
show running-config
|
Shows the running configuration.
|
show sunrpc-server active
To display the pinholes open for Sun RPC services, use the show sunrpc-server active command in privileged EXEC mode.
show sunrpc-server active
Defaults
No default behavior or values.
Command Modes
The following table shows the modes in which you can enter the command:
Command Mode
|
Firewall Mode
|
Security Context
|
Routed
|
Transparent
|
Single
|
Multiple
|
Context
|
System
|
Privileged EXEC
|
•
|
•
|
•
|
•
|
|