Table Of Contents
Performance Monitoring
5.1 Threshold Performance Monitoring
5.2 Intermediate-Path Performance Monitoring
5.3 Pointer Justification Count
5.4 Performance-Monitoring Parameter Definitions
5.5 Optical Card Performance Monitoring
5.5.1 OC-48/STM16 and OC-192/STM64 Card Performance Monitoring Parameters
5.5.2 Physical Layer Parameters
5.6 ASAP Card Performance Monitoring
5.6.1 ASAP Card Optical Performance Monitoring Parameters
5.6.2 ASAP Card Ethernet Performance Monitoring Parameters
Performance Monitoring
Note  The terms "Unidirectional Path Switched Ring" and "UPSR" may appear in Cisco literature. These terms do not refer to using Cisco ONS 15xxx products in a unidirectional path switched ring configuration. Rather, these terms, as well as "Path Protected Mesh Network" and "PPMN," refer generally to Cisco's path protection feature, which may be used in any topological network configuration. Cisco does not recommend using its path protection feature in any particular topological network configuration.
Use performance monitoring (PM) parameters to gather, store, threshold, and report performance data for early detection of problems. This chapter defines PM parameters and concepts for Cisco ONS 15600 optical cards.
Note For additional information regarding PM parameters, refer to Telcordia documents GR-1230-CORE, GR-820-CORE, GR-499-CORE, and GR-253-CORE and the ANSI T1.231 document entitled Digital Hierarchy - Layer 1 In-Service Digital Transmission Performance Monitoring.
For information about enabling and viewing PM values, refer to the Cisco ONS 15600 Procedure Guide.
Chapter topics include:
•Threshold Performance Monitoring
•Intermediate-Path Performance Monitoring
•Pointer Justification Count
•Performance-Monitoring Parameter Definitions
•Optical Card Performance Monitoring
•ASAP Card Performance Monitoring
5.1 Threshold Performance Monitoring
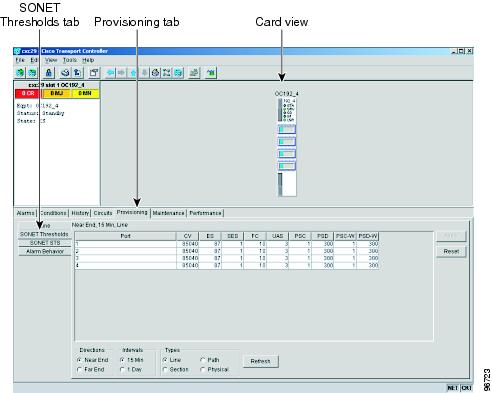
Thresholds are used to set error levels for each PM. You can program PM threshold ranges from the Provisioning > SONET Thresholds tabs on the Cisco Transport Controller (CTC) card view. To provision card thresholds, such as line, path, and SONET thresholds, refer to the Cisco ONS 15600 Procedure Guide.
During the accumulation cycle, if the current value of a performance monitoring parameter reaches or exceeds its corresponding threshold value, a threshold crossing alert (TCA) is generated by the node and sent to CTC. TCAs provide early detection of performance degradation. When a threshold is crossed, the node continues to count the errors during a given accumulation period. If 0 is entered as the threshold value, the performance monitoring parameter is disabled. Figure 5-1 shows the Provisioning > SONET Thresholds tabs for an OC-48/STM-16 card.
Figure 5-1 SONET Thresholds Tab for Setting Threshold Values
Change the threshold if the default value does not satisfy your error monitoring needs. For example, customers with a critical STS-1 installed for 911 calls must guarantee the best quality of service on the line; therefore, they lower all thresholds so that the slightest error raises a TCA.
5.2 Intermediate-Path Performance Monitoring
Intermediate-path performance monitoring (IPPM) allows a nonterminating node to transparently monitor a constituent channel of an incoming transmission signal. ONS 15600 networks only use line terminating equipment (LTE), not path terminating equipment (PTE). Table 5-1 shows ONS 15600 cards that are considered LTEs.
Table 5-1 Line Terminating Traffic Cards
Line Terminating Equipment
|
OC48/STM16 SR/SH 16 Port 1310
|
OC48/STM16 LR/LH 16 Port 1550
|
OC192/STM64 SR/SH 4 Port 1310
|
OC192/STM64 LR/LH 4 Port 1550
|
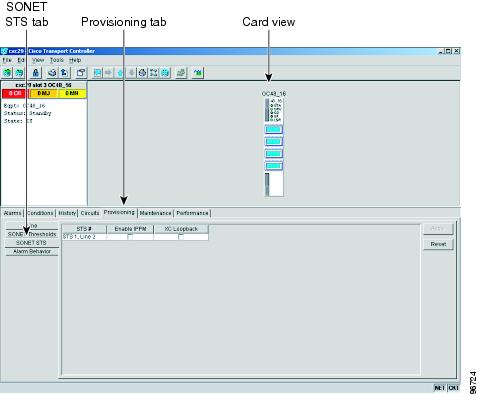
Figure 5-2 shows the Provisioning > SONET STS tabs for an OC-48 card.
Figure 5-2 STS Tab for Enabling IPPM
Software Release 1.0 and later allows LTE cards to monitor near-end path PM data on individual synchronous transport signal (STS) payloads by enabling IPPM. After enabling IPPM on provisioned STS ports, service providers can monitor large amounts of STS traffic through intermediate nodes, thus making troubleshooting and maintenance activities more efficient.
IPPM occurs only on STS paths that have IPPM enabled, and TCAs are raised only for PM parameters on the selected IPPM paths. The monitored IPPMs are STS CV-P, STS ES-P, STS SES-P, STS UAS-P, and STS FC-P. To enable IPPM, refer to the Cisco ONS 15600 Procedure Guide.
The ONS 15600 performs IPPM by examining the overhead in the monitored path and reading all of the near-end path performance monitoring parameters in the incoming transmission direction. The IPPM process allows the path overhead to pass bidirectionally through the node completely unaltered.
For detailed information about specific performance monitoring parameters, see the "Performance-Monitoring Parameter Definitions" section.
5.3 Pointer Justification Count
Pointers are used to compensate for frequency and phase variations. Pointer justification counts indicate timing differences on SONET networks. When a network is not synchronized, frequency and phase variations occur on the transported signal. Excessive frequency and phase variations can cause terminating equipment to slip. These variations also cause slips at the SDH and plesiosynchronous digital hierarchy (PDH) boundaries.
Slips cause different effects in service. Voice service has intermittent audible clicks. Compressed voice technology has short transmission errors or dropped calls. Fax machines lose scanned lines or experience dropped calls. Digital video transmission has distorted pictures or frozen frames. Encryption service loses the encryption key, which causes data to be transmitted again.
Pointers align the phase variations in STS and Virtual Tributary (VT) payloads. The STS payload pointer is located in the H1 and H2 bytes of the line overhead. Clocking differences are measured by the offset in bytes from the pointer to the first byte of the STS synchronous payload envelope (SPE) called the J1 byte. A small number of pointer justification counts per day is not cause for concern. If the pointer justification count continues to rise or becomes large, action must be taken to correct the problem.
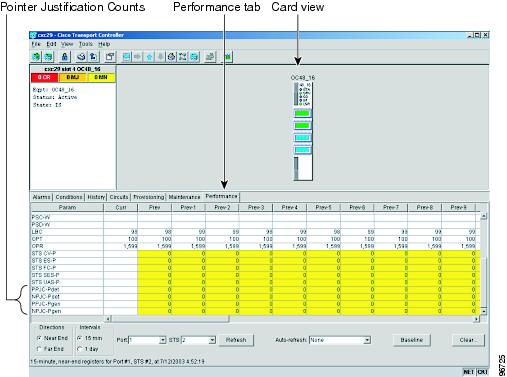
Figure 5-3 shows pointer justification count parameters on the performance monitoring window. You can enable positive pointer justification count (PPJC) and negative pointer justification count (NPJC) performance monitoring parameters for LTE cards.
Figure 5-3 Viewing Pointer Justification Count Parameters
PPJC is a count of path-detected (PPJC-Pdet) or path-generated (PPJC-Pgen) positive pointer justifications depending on the specific PM name. NPJC is a count of path-detected (NPJC-Pdet) or path-generated (NPJC-Pgen) negative pointer justifications depending on the specific PM name.
A consistent pointer justification count indicates clock synchronization problems between nodes. A difference between the counts means the node transmitting the original pointer justification has timing variations with the node detecting and transmitting this count. Positive pointer adjustments occur when the frame rate of the SPE is too slow in relation to the rate of the STS-1.
For pointer justification count definitions, see the "Performance-Monitoring Parameter Definitions" section. In CTC, the PM count fields for PPJC and NPJC appear white and blank unless IPPM is enabled.
5.4 Performance-Monitoring Parameter Definitions
Table 5-2 gives definitions for each type of performance-monitoring parameter found in this chapter.
Table 5-2 Performance Monitoring Parameters
Parameter
|
Definition
|
CV-L
|
Line Code Violation (CV-L) indicates the number of coding violations occurring on the line. This parameter is a count of bipolar violations (BPVs) and excessive zeros (EXZs) occurring over the accumulation period.
|
CV-LFE
|
Far-End Line Code Violation (CV-LFE) is a count of bit interleaved parity (BIP) errors detected by the far-end LTE and reported back to the near-end LTE using the Line remote error indication (REI-L) in the line overhead. For SONET signals at rates below OC-48, up to 8 x n BIP errors per STS-N frame can be indicated using the RDI-L indication. For OC-48 signals, up to 255 BIP errors per STS-N frame can be indicated. The current CV-L second register is incremented for each BIP error indicated by the incoming REI-L.
|
CV-P
|
Near-End STS Path Coding Violations (CV-P) is a count of BIP errors detected at the STS path layer (that is, using the B3 byte). Up to eight BIP errors can be detected per frame; each error increments the current CV-P second register.
|
CV-PFE
|
Far-End STS Path Coding Violations (CV-PFE) is a count of BIP errors detected at the STS path layer (that is, using the B3 byte). Up to eight BIP errors can be detected per frame; each error increments the current CV-PFE second register.
|
CV-S
|
Section Coding Violation (CV-S) is a count of BIP errors detected at the section layer (that is, using the B1 byte in the incoming SONET signal). Up to eight section BIP errors can be detected per STS-N frame; each error increments the current CV-S second register.
|
ES-L
|
Line Errored Seconds (ES-L) is a count of the seconds containing one or more anomalies (BPV+EXZ) and/or defects (that is, loss of signal) on the line.
|
ES-LFE
|
Far-End Line Errored Seconds (ES-LFE) is a count of the seconds when at least one line-layer BIP error was reported by the far-end LTE or a RDI-L defect was present.
|
ES-P
|
Near-End STS Path Errored Seconds (ES-P) is a count of the seconds when at least one STS path BIP error was detected. An AIS-P defect (or a lower-layer, traffic-related, near-end defect) or an LOP-P defect can also cause an ES-P.
|
ES-PFE
|
Far-End STS Path Errored Seconds (ES-PFE) is a count of the seconds when at least one STS path BIP error was detected. An AIS-P defect (or a lower-layer, traffic-related, far-end defect) or an LOP-P defect can also cause an STS ES-PFE.
|
ES-S
|
Section Errored Seconds (ES-S) is a count of the number of seconds when at least one section-layer BIP error was detected or an SEF or LOS defect was present.
|
FC-L
|
Line Failure Count (FC-L) is a count of the number of near-end line failure events. A failure event begins when an AIS-L failure is declared or when a lower-layer, traffic-related, near-end failure is declared. This failure event ends when the failure is cleared. A failure event that begins in one period and ends in another period is counted only in the period where it begins.
|
FC-LFE
|
Far-End Line Failure Count (FC-LFE) is a count of the number of far-end line failure events. A failure event begins when Line RFI-L failure is declared, and it ends when the RFI-L failure clears. A failure event that begins in one period and ends in another period is counted only in the period where it began.
|
FC-P
|
Near-End STS Path Failure Counts (FC-P) is a count of the number of near-end STS path failure events. A failure event begins when an AIS-P failure, an LOP-P failure, a UNEQ-P failure, or a TIM-P failure is declared. A failure event also begins if the STS PTE that is monitoring the path supports ERDI-P for that path. The failure event ends when these failures are cleared.
|
FC-PFE
|
Far-End STS Path Failure Counts (FC-PFE) is a count of the number of near-end STS path failure events. A failure event begins when an AIS-P failure, an LOP-P failure, a UNEQ-P failure, or a TIM-P failure is declared. A failure event also begins if the STS PTE that is monitoring the path supports ERDI-P for that path. The failure event ends when these failures are cleared.
|
LBC
|
Laser Bias Current (LBC) is represented by the percentage of the normal (100%) laser bias current of the laser on the card port. The high laser bias current (LBC-HIGH) threshold is the percentage of the normal laser bias current when a high current TCA occurs. The low laser bias current (LBC-LOW) threshold is the percentage of the normal laser bias current when a low current TCA occurs.
|
NPJC-PDET
|
Negative Pointer Justification Count, STS Path Detected (NPJC-Pdet-P) is a count of the negative pointer justifications detected on a particular path in an incoming SONET signal.
|
NPJC-PGEN
|
Negative Pointer Justification Count, STS Path Generated (NPJC-Pgen-P) is a count of the negative pointer justifications generated for a particular path to reconcile the frequency of the SPE with the local clock.
|
OPT
|
Optical Power Transmitted (OPT) is represented by the percentage of the normal (100%) optical transmit power of the laser on the card port. The high optical power transmitted (OPT-HIGH) threshold is the percentage of the normal transmit optical power when a high transmit power TCA occurs. The low optical power transmitted (OPT-LOW) threshold is the percentage of the normal transmit optical power when a low transmit power TCA occurs.
|
OPR
|
Optical Power Received (OPR) is represented by the percentage of the normal optical receive power of the card port. The high optical power received (OPR-HIGH) threshold is the percentage of the calibrated receive optical power when a high receive power TCA occurs. The low optical power received (OPR-LOW) threshold is the percentage of the calibrated receive optical power when a low receive power TCA occurs.
|
PPJC-PDET
|
Positive Pointer Justification Count, STS Path Detected (PPJC-Pdet-P) is a count of the positive pointer justifications detected on a particular path in an incoming SONET signal.
|
PPJC-PGEN
|
Positive Pointer Justification Count, STS Path Generated (PPJC-Pgen-P) is a count of the positive pointer justifications generated for a particular path to reconcile the frequency of the SPE with the local clock.
|
PSC (1+1)
|
In a 1+1 protection scheme for a working port, Protection Switching Count (PSC) is a count of the number of times service switches from a working port to a protection port plus the number of times service switches back to the working port.
For a protection port, PSC is a count of the number of times service switches to a working port from a protection port plus the number of times service switches back to the protection port. The PSC PM is only applicable if revertive line-level protection switching is used.
|
PSC (BLSR)
|
For a protect line in a two-fiber ring, Protection Switching Count (PSC) refers to the number of times a protection switch has occurred either to a particular span's line protection or away from a particular span's line protection. Therefore, if a protection switch occurs on a two-fiber BLSR, the PSC of the protection span to which the traffic is switched will increment, and when the switched traffic returns to its original working span from the protect span, the PSC of the protect span will increment again.
|
PSC-R
|
In a four-fiber bidirectional line switched ring (BLSR), Protection Switching Count-Ring (PSC-R) is a count of the number of times service switches from a working line to a protection line plus the number of times it switches back to a working line. A count is only incremented if ring switching is used.
|
PSC-S
|
In a four-fiber BLSR, Protection Switching Count-Span (PSC-S) is a count of the number of times service switches from a working line to a protection line plus the number of times it switches back to the working line. A count is only incremented if span switching is used.
|
PSC-W
|
For a working line in a two-fiber BLSR, Protection Switching Count-Working (PSC-W) is a count of the number of times traffic switches away from the working capacity in the failed line and back to the working capacity after the failure is cleared. PSC-W increments on the failed working line and PSC increments on the active protect line.
For a working line in a four-fiber BLSR, PSC-W is a count of the number of times service switches from a working line to a protection line plus the number of times it switches back to the working line. PSC-W increments on the failed line and PSC-R or PSC-S increments on the active protect line.
|
PSD (1+1)
|
In a 1+1 protection scheme, Protection Switching Duration (PSD) applies to the length of time, in seconds, that service is carried on another line. For a working line, PSD is a count of the number of seconds that service was carried on the protection line.
For the protection line, PSD is a count of the seconds that the line was used to carry service. The PSD PM is only applicable if revertive line-level protection switching is used.
|
PSD (BLSR)
|
Protection Switching Duration (PSD) applies to the length of time, in seconds, that service is carried on another line. For a working line, PSD is a count of the number of seconds that service was carried on the protection line.
For the protection line, PSD is a count of the seconds that the line was used to carry service. The PSD PM is only applicable if revertive line-level protection switching is used.
Therefore, if a protection switch occurs on a two-fiber BLSR, the PSD of the protection span to which the traffic is switched will increment, and when the switched traffic returns to its original working span from the protect span, the PSD of the protect span will stop incrementing.
|
PSD-R
|
In a four-fiber BLSR, Protection Switching Duration-Ring (PSD-R) is a count of the seconds that the protection line was used to carry service. A count is only incremented if ring switching is used.
|
PSD-S
|
In a four-fiber BLSR, Protection Switching Duration-Span (PSD-S) is a count of the seconds that the protection line was used to carry service. A count is only incremented if span switching is used.
|
PSD-W
|
For a working line in a two-fiber BLSR Protection Switching Duration-Working (PSD-W) is a count of the number of seconds that service was carried on the protection line. PSD-W increments on the failed working line and PSD increments on the active protect line.
|
SEFS-S
|
Section Severely Errored Framing Seconds (SEFS-S) is a count of the seconds when an SEF defect was present. An SEF defect is expected to be present during most seconds when an LOS or loss of frame (LOF) defect is present. However, there can be situations when the SEFS-S parameter is only incremented based on the presence of the Severely Errored Framing (SEF) defect.
|
SES-L
|
Line Severely Errored Seconds (SES-L) is a count of the seconds containing more than a particular quantity of anomalies (BPV + EXZ > 1544) and/or defects on the line.
|
SES-LFE
|
Far-End Line Severely Errored Seconds (SES-LFE) is a count of the seconds when K (see Telcordia GR-253-CORE for values) or more line-layer BIP errors were reported by the far-end LTE or an RDI-L defect was present.
|
SES-P
|
Near-End STS Path Severely Errored Seconds (SES-P) is a count of the seconds when K (2400) or more STS path BIP errors were detected. An AIS-P defect (or a lower-layer, traffic-related, near-end defect) or an LOP-P defect can also cause an SES-P.
|
SES-PFE
|
Far-End STS Path Severely Errored Seconds (SES-PFE) is a count of the seconds when K (2400) or more STS path BIP errors were detected. An AIS-P defect (or a lower-layer, traffic-related, far-end defect) or an LOP-P defect can also cause an SES-PFE.
|
SES-S
|
Section Severely Errored Seconds (SES-S) is a count of the seconds when K (see Telcordia GR-253-CORE for value) or more section-layer BIP errors were detected or an SEF or LOS defect was present.
|
UAS-L
|
Line Unavailable Seconds (UAS-L) is a count of the seconds when the line is unavailable. A line becomes unavailable when ten consecutive seconds occur that qualify as SES-Ls, and it continues to be unavailable until ten consecutive seconds occur that do not qualify as SES-Ls.
|
UAS-LFE
|
Far-End Line Unavailable Seconds (UAS-LFE) is a count of the seconds when the line is unavailable at the far end. A line becomes unavailable at the onset of ten consecutive seconds that qualify as SES-LFEs, and continues to be unavailable until the onset of ten consecutive seconds occurs that do not qualify as SES-LFEs.
|
UAS-P
|
Near-End STS Path Unavailable Seconds (UAS-P) is a count of the seconds when the STS path was unavailable. An STS path becomes unavailable when ten consecutive seconds occur that qualify as SES-Ps, and continues to be unavailable until ten consecutive seconds occur that do not qualify as SES-Ps.
|
UAS-PFE
|
Far-End STS Path Unavailable Seconds (UAS-PFE) is a count of the seconds when the STS path was unavailable. An STS path becomes unavailable when ten consecutive seconds occur that qualify as SES-PFEs, and continues to be unavailable until ten consecutive seconds occur that do not qualify as SES-PFEs.
|
5.5 Optical Card Performance Monitoring
The following sections define performance monitoring parameters for the OC-48/STM16 and OC-192/STM64 optical cards.
5.5.1 OC-48/STM16 and OC-192/STM64 Card Performance Monitoring Parameters
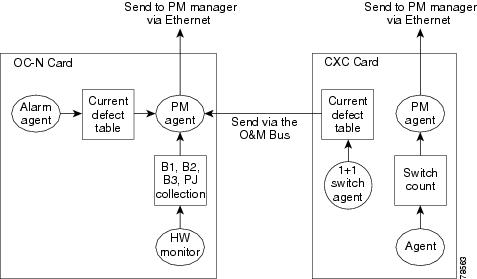
Figure 5-4 shows where overhead bytes detected on the Application-Specific Integrated Circuits (ASICs) produce performance monitoring parameters for the OC-48/STM16 and OC-192/STM64 optical cards.
Figure 5-4 PM Read Points on the OC-48/STM16 and OC-192/STM64 Cards
Note For PM locations relating to protection switch counts, see the Telcordia GR-1230-CORE document.
Table 5-3 lists the near-end and far-end section layer PMs.
Table 5-3 OC48/STM16 and OC-192/STM64 Card PMs
Section (NE)
|
Line (NE)
|
|
Line (FE)
|
|
STS Path (FE)
|
CV-S
ES-S
SES-S
SEF-S
|
CV-L
ES-L
SES-L
UAS-L
FC-L
PSC (1+1)
PSC (BLSR)
PSD
PSC-W
PSD-W
|
CV-P
ES-P
SES-P
UAS-P
FC-P
PPJC-PDET
NPJC-PDET
PPJC-PGEN
NPJC-PGEN
|
CV-LFE
ES-LFE
SES-LFE
UAS-LFE
FC-LFE
|
OPT
OPR
LBC5
|
CV-PFE
ES-PFE
SES-PFE
UAS-PFE
FC-PFE
|
5.5.2 Physical Layer Parameters
The ONS 15600 retrieves the OPR, OPT, and LBC from the line card and stores these values with the PM counts for the 15-minute and 1-day periods. You can retrieve current OPR, OPT, and LBC values for each port by displaying the card view in CTC and clicking the Maintenance > Transceiver tabs.
The physical layer performance parameters consist of normalized and non-normalized values of LBC, OPT, and OPR. Table 5-4 defines the non-normalized values.
Table 5-4 Non-Normalized Transceiver Physical Optics for the OC-48/STM16 and OC-192/STM64 Cards
Parameter
|
Definition
|
Non-normalized LBC (mA)1
|
The actual operating value of laser bias current (mA) for the specified card port.
|
Non-normalized OPR (dbm)2
|
The actual operating value of optical power received (dBm) for the specified card port.
|
Non-normalized OPT (dbm)1
|
The actual operating value of optical power transmitted (dBm) for the specified card port.
|
5.6 ASAP Card Performance Monitoring
The following sections define performance monitoring parameters for the Any Service Any Port (ASAP) card.
5.6.1 ASAP Card Optical Performance Monitoring Parameters
Table 5-5 lists the near-end and far-end section layer PMs.
Table 5-5 ASAP Card PMs
Section (NE)
|
Line (NE)
|
|
Line (FE)
|
|
STS Path (FE)
|
CV-S
ES-S
SES-S
SEF-S
|
CV-L
ES-L
SES-L
UAS-L
FC-L
PSC (1+1)
PSC (BLSR)
PSD (1+1)
PSD (BLSR)
PSC-W
PSD-W
|
CV-P
ES-P
SES-P
UAS-P
FC-P
PPJC-PDET
NPJC-PDET
PPJC-PGEN
NPJC-PGEN
|
CV-L
ES-L
SES-L
UAS-L
FC-L
|
OPT
OPR
LBC5
|
CV-P
ES-P
SES-P
UAS-P
FC-P
|
5.6.2 ASAP Card Ethernet Performance Monitoring Parameters
CTC provides Ethernet performance information, including line-level parameters, port bandwidth consumption, and historical Ethernet statistics. The ASAP card Ethernet performance information is divided into Ether Ports and POS Ports windows within the card view Performance tab window.
5.6.2.1 ASAP Card Ether Port Statistics Window
The Ethernet Ether Ports statistics window lists Ethernet parameters at the line level. The Statistics window provides buttons to change the statistical values. The Baseline button resets the displayed statistics values to zero. The Refresh button manually refreshes statistics. Auto-Refresh sets a time interval at which automatic refresh occurs. The ASAP Statistics window also has a Clear button. The Clear button sets the values on the card to zero, but does not reset the ASAP card.
During each automatic cycle, whether auto-refreshed or manually refreshed (using the Refresh button), statistics are added cumulatively and are not immediately adjusted to equal total received packets until testing ends. To see the final PM count totals, allow a few moments for the PM window statistics to finish testing and update fully. PM counts are also listed in the ASAP card Performance > History window.
Table 5-6 defines the ASAP card statistics parameters.
Table 5-6 ASAP Ethernet Statistics Parameters
Parameter
|
Meaning
|
Time Last Cleared
|
A time stamp indicating the last time statistics were reset.
|
Link Status
|
Indicates whether the Ethernet link is receiving a valid Ethernet signal (carrier) from the attached Ethernet device; up means present, and down means not present.
|
Rx Unicast Packets
|
Number of unicast packets received since the last counter reset.
|
Tx Unicast Packets
|
Number of unicast packets transmitted since the last counter reset.
|
Rx Multicast Packets
|
Number of multicast packets received since the last counter reset.
|
Tx Multicast Packets
|
Number of multicast packets transmitted since the last counter reset.
|
Rx Broadcast Packets
|
Number of broadcast packets received since the last counter reset.
|
Tx Multicast Packets
|
Number of broadcast packets transmitted since the last counter reset.
|
Rx Bytes
|
Number of bytes received since the last counter reset.
|
Tx Bytes
|
Number of bytes transmitted since the last counter reset.
|
Rx Errors
|
The number of inbound packets (or transmission units), that could not be delivered to a higher-layer protocol because of errors.
|
Tx Errors
|
The number of outbound packets (or transmission units), that could not be transmitted because of errors.
|
Rx FCS errors
|
Number of packets with a frame check sequence (FCS) error. FCS errors indicate frame corruption during transmission.
|
Rx Align errors
|
Number of packets with received incomplete frames.
|
Rx Runts
|
The total number of packets received that were less than 64 bytes long (excluding framing bits, but including FCS bytes) and were otherwise well formed.
|
Rx Jabbers
|
The total number of packets received that were longer than 1518 bytes (excluding framing bits, but including FCS bytes), and had either a bad FCS with an integral number of bytes (FCS error) or a bad FCS with a nonintegral number of bytes (alignment error).
|
Rx Giants
|
The total number of packets received that were longer than 1518 bytes (excluding framing bits, but including FCS bytes) and were otherwise well formed.
|
Rx Discards
|
The number of inbound packets that were chosen to be discarded even though no errors had been detected to prevent their being deliverable to a higher-layer protocol. One possible reason for discarding such a packet could be to free up buffer space.
|
Tx Discards
|
The number of outbound packets that were chosen to be discarded even though no errors had been detected to prevent their being transmitted. One possible reason for discarding such a packet could be to free up buffer space.
|
Rx Pause Frames
|
Number of received Ethernet IEEE 802.3z pause frames.
|
Tx Pause Frames
|
Number of transmitted IEEE 802.3z pause frames.
|
Port Drop Counts
|
Number of received frames dropped at the port level.
|
etherStatsDropEvents
|
Number of received frames dropped at the port level.
|
etherStatsOctets
|
The total number of bytes of data (including those in bad packets) received on the network (excluding framing bits but including FCS bytes.
|
etherStatsPkts
|
The total number of packets (including bad packets, broadcast packets, and multicast packets) received.
|
etherStatsBroadcastPkts
|
The total number of good packets received that were directed to the broadcast address. Note that this does not include multicast packets.
|
etherStatsMulticastPkts
|
The total number of good packets received that were directed to a multicast address. Note that this number does not include packets directed to the broadcast address.
|
etherStatsFragments
|
The total number of packets received that were less than 64 bytes in length (excluding framing bits but including FCS bytes) and had either a bad FCS with an integral number of bytes (FCS error) or a bad FCS with a nonintegral number of bytes (alignment error).
Note It is entirely normal for etherStatsFragments to increment. This is because it counts both runts (which are normal occurrences due to collisions) and noise hits.
|
etherStatsPkts64Octets
|
The total number of packets (including bad packets) received that were 64 bytes in length (excluding framing bits but including FCS bytes).
|
etherStatsPkts65to127Octets
|
The total number of packets (including bad packets) received that were between 65 and 127 bytes in length inclusive (excluding framing bits but including FCS bytes).
|
etherStatsPkts128to255Octets
|
The total number of packets (including bad packets) received that were between 128 and 255 bytes in length inclusive (excluding framing bits but including FCS bytes).
|
etherStatsPkts256to511Octets
|
The total number of packets (including bad packets) received that were between 256 and 511 bytes in length inclusive (excluding framing bits but including FCS bytes).
|
etherStatsPkts512to1023Octets
|
The total number of packets (including bad packets) received that were between 512 and 1023 bytes in length inclusive (excluding framing bits but including FCS bytes).
|
etherStatsPkts1024to1518Octets
|
The total number of packets (including bad packets) received that were between 1024 and 1518 bytes in length inclusive (excluding framing bits but including FCS bytes).
|
Rx Utilization
|
The percentage of receive (Rx) line bandwidth used by the Ethernet ports during consecutive time segments.
|
Tx Utilization
|
Same as Rx Utilization, except calculated over the transmit (Tx) line bandwidth.
|
Rx Alignment Errors
|
A count of frames received on a particular interface that are not an integral number of bytes in length and do not pass the FCS check.
|
Rx FCS Errors
|
A count of frames received on a particular interface that are an integral number of bytes in length but do not pass the FCS check.
|
dot3StatsInternalMacTransmitErrors
|
A count of frames for which transmission on a particular interface fails due to an internal MAC sublayer transmit error. A frame is only counted by an instance of this object if it is not counted by the corresponding instance of the dot3StatsLateCollisions object, the dot3StatsExcessiveCollisions object, or the dot3StatsCarrierSenseErrors object.
|
dot3StatsFrameTooLongs
|
A count of frames received on a particular interface that exceed the maximum permitted frame size.
|
dot3StatsInternalMacReceiveErrors
|
A count of frames for which reception on a particular interface fails due to an internal MAC sublayer receive error. A frame is only counted by an instance of this object if it is not counted by the corresponding instance of the dot3StatsFrameTooLongs object, the dot3StatsAlignmentErrors object, or the dot3StatsFCSErrors object. The precise meaning of the count represented by an instance of this object is implementation-specific. In particular, an instance of this object may represent a count of receive errors on a particular interface that are not otherwise counted.
|
dot3StatsSymbolErrors
|
A count of frames for which transmission on a particular interface fails due to an internal MAC sublayer transmit error. A frame is only counted by an instance of this object if it is not counted by the corresponding instance of either the dot3StatsLateCollisions object, the dot3StatsExcessiveCollisions object, or the dot3StatsCarrierSenseErrors object. The precise meaning of the count represented by an instance of this object is implementation-specific. In particular, an instance of this object might represent a count of transmission errors on a particular interface that are not otherwise counted.
|
5.6.2.2 ASAP Card Ether Ports Utilization Window
The Ether Ports Utilization window shows the percentage of Tx and Rx line bandwidth used by the Ethernet ports during consecutive time segments. The Utilization window provides an Interval menu that enables you to set time intervals of 1 minute, 15 minutes, 1 hour, and 1 day. Line utilization is calculated with the following formulas:
Rx = (inOctets + inPkts * 20) * 8 / 100% interval * maxBaseRate
Tx = (outOctets + outPkts * 20) * 8 / 100% interval * maxBaseRate
The interval is defined in seconds. The maxBaseRate is defined by raw bits per second in one direction for the Ethernet port (that is,1 Gbps). Table 5-7 provides the maxBaseRate for ASAP Ethernet cards.
Table 5-7 maxBaseRate for STS Circuits
STS
|
maxBaseRate
|
STS-1
|
51840000
|
STS-3c
|
155000000
|
STS-6c
|
311000000
|
STS-12c
|
622000000
|
Note Line utilization numbers express the average of ingress and egress traffic as a percentage of capacity.
5.6.2.3 ASAP Card Ether Ports History Window
The Ethernet Ether Ports History window lists past Ethernet statistics for the previous time intervals. The History window displays the statistics for each port for the number of previous time intervals as shown in Table 5-8. The listed parameters are defined in Table 5-6.
Table 5-8 Ethernet History Statistics per Time Interval
Time Interval
|
Number of Intervals Displayed
|
1 minute
|
60 previous time intervals
|
15 minutes
|
32 previous time intervals
|
1 hour
|
24 previous time intervals
|
1 day (24 hours)
|
7 previous time intervals
|
5.6.2.4 ASAP Card POS Ports Statistics Parameters
The Ethernet POS Ports statistics window lists Ethernet POS parameters at the line level.
Table 5-9 defines the ASAP card Ethernet POS Ports parameters.
Table 5-9 ASAP Card POS Ports Parameters
Parameter
|
Meaning
|
Time Last Cleared
|
A time stamp indicating the last time statistics were reset.
|
Link Status
|
Indicates whether the Ethernet link is receiving a valid Ethernet signal (carrier) from the attached Ethernet device; up means present, and down means not present.
|
Framing Type
|
Layer 1 framing, HDLC or GFP
|
Rx Packets
|
Number of packets received since the last counter reset.
|
Tx Packets
|
Number of packets transmitted since the last counter reset.
|
Rx Octets
|
Number of bytes received (from the SONET/SDH path) prior to the bytes undergoing high-level data link control (HLDC) decapsulation by the policy engine.
|
Tx Octets
|
Number of bytes transmitted (to the SONET/SDH path) after the bytes undergoing HLDC encapsulation by the policy engine.
|
Rx Shorts
|
Number of packets below the minimum packet size received.
|
Rx Runts
|
Total number of frames received that are less than 5 bytes.
|
Rx Longs
|
Number of received frames that exceed the maximum transfer unit (MTU).
|
Rx CRC Errors/HDLC Errors
|
HDLC errors received from SONET/SDH.
|
Rx Single Bit Errors
|
Number of received frames with single bit errors.
|
Rx Multi Bit Errors
|
Number of received frames with multibit errors.
|
Rx Type Invalid
|
Number of received frames with invalid type.
|
Rx Input Abort Packets
|
Number of received packets aborted before input.
|
Rx Input Drop Packets
|
Number of received packets dropped before input.
|
5.6.2.5 ASAP Card POS Ports Utilization Window
The POS Ports Utilization window shows the percentage of Tx and Rx line bandwidth used by the POS ports during consecutive time segments. The Utilization window provides an Interval menu that enables you to set time intervals of 1 minute, 15 minutes, 1 hour, and 1 day. Line utilization is calculated with the following formulas:
Rx = (inOctets * 8) / interval * maxBaseRate
Tx = (outOctets * 8) / interval * maxBaseRate
The interval is defined in seconds. The maxBaseRate is defined by raw bits per second in one direction for the Ethernet port (that is,1 Gbps). The maxBaseRate for ASAP cards is shown in Table 5-7.
Note Line utilization numbers express the average of ingress and egress traffic as a percentage of capacity.
5.6.2.6 ASAP Card Ether Ports History Window
The Ethernet POS Ports History window lists past Ethernet POS Ports statistics for the previous time intervals. The History window displays the statistics for each port for the number of previous time intervals as shown in Table 5-8. The listed parameters are defined in Table 5-9.

 Feedback