Table Of Contents

Planning and Reporting

Using the Planning and Reporting Toolset

Opening the Planning and Reporting Toolset

Launching the Planning and Reporting Toolset From a PAC

Launching the Planning and Reporting Toolset From a Web Client

Navigating the Planning and Reporting Window

Accessing Planning and Reporting Features

Managing Individual Reports

Generating Standard Reports

Defining a Standard Report

Standard Reports List

Generating Executive Reports

Defining an Executive Report

Service Level Verification Reports

Capacity Planning Reports

Selecting a Report Format

Creating a Report Definition

Editing, Copying, or Deleting a Report

Viewing, Printing, or Saving a Report

Managing Report Groups

Creating a Report Group

Copying a Report Group

Deleting a Report Group

Generating a Report Group

Printing or Generating Report Groups from the PAC

Printing a Report Group on Demand From the Web Client

Scheduling a Report Group

Scheduling a Report Group to Save to Files

Report Output Filenames and Formats


Planning and Reporting


Use the Planning and Reporting Toolset to generate reports that help you analyze daily and monthly network performance and usage. You can define reports to use once—to view, print, or output to a file—or to update periodically, and you can organize saved reports into groups for easy retrieval. Cisco WAPMS provides two types of reports:

Standard reports—provide detailed performance statistics on specific network elements

Executive reports—provide selected, high-level statistics showing usage patterns and problem areas across an entire network or set of networks.

Topics in this chapter include:

"Using the Planning and Reporting Toolset"

"Managing Report Groups" section.

Using the Planning and Reporting Toolset

This section explains how to access the Planning and Reporting Toolset and how to use the interface.

Opening the Planning and Reporting Toolset

Open the Planning and Reporting Toolset either from a PAC as you would any other Toolset or from a Web Planning and Reporting Client.

See the Cisco WAN Access Performance Management System Installation and Configuration Guide, 2.0 for details about browser requirements and installing the Web Client software.

Launching the Planning and Reporting Toolset From a PAC

On the Toolset Selector, click Planning and Reporting, or choose Toolsets > Planning and Reporting from the Menu bar.

Launching the Planning and Reporting Toolset From a Web Client


Step 1 Launch your Web browser.

Step 2 Enter the following URL in the address field:

http://<PAM node name or IP address>

Step 3 On the PAM's Cisco WAPMS Web page, click Start Web Planning and Reporting.

Step 4 Log on to Planning and Reporting, then choose the domain that contains your network performance data. Your user ID and password are configured at the PAM by the PAM administrator.


Navigating the Planning and Reporting Window

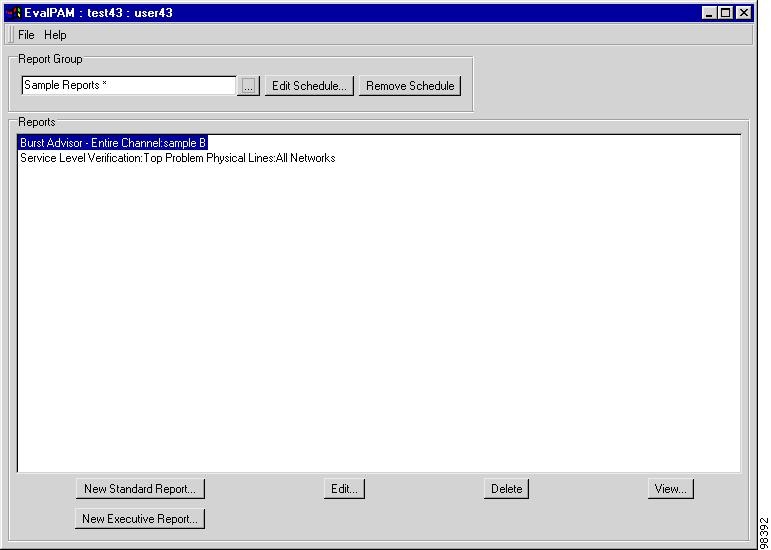
The Planning and Reporting window (Figure 9-1) has the same display on the PAC and Web Client, with two exceptions:

the Web Planning and Reporting window has a Print Reports option rather than a Generate Reports option on the File menu

the Web Planning and Reporting window includes an additional Setup menu allowing you to connect to a different domain, change your user ID, or log off.

Figure 9-1 Planning and Reporting Window on the PAC

The Planning and Reporting window displays a list of all reports included in the current Report Group. You create and manage Report Groups and individual reports in essentially the same manner from both the PAC and the Web Client.

Accessing Planning and Reporting Features

Several Planning and Reporting features may not be available depending on your user ID permissions, as set by the PAM administrator. These include:

the Planning and Reporting button on the Cisco WAPMS Tool bar

new Standard Report and New Executive Report buttons on the Planning and Reporting window

the Add Schedule, Edit Schedule, and Remove Schedule buttons on the Planning and Reporting window.

To gain user access, contact your PAM administrator.

Managing Individual Reports

Cisco WAPMS has two predefined report types: Standard and Executive. Both present network performance data collected by ASEs.

Standard reports provide detailed performance statistics on specific network elements. See the "Generating Standard Reports" section.

Executive reports provide selected, high-level statistics showing usage patterns and problem areas across an entire network or set of networks. See the "Generating Executive Reports" section.

Once you configure a Standard or Executive report, you can save its definition for future use. You can then schedule the report to be auto-generated or simply view the report on an ongoing basis without reconfiguring it. See the "Creating a Report Definition" section.

Once you create reports, they are stored by default in the Default Report Group. You create new report groups to organize reports. You can also define report parameters and schedule when reports will run.

Generating Standard Reports

Standard reports provide performance and usage information about specific access lines, access channels, circuits, Frame Relay DLCIs, or ATM virtual circuits.


Note Standard reports are based on data stored in the long-term database—you cannot generate a report for an ASE or access line for which there is no collected data.


Defining a Standard Report


Step 1 From the Planning and Reporting window, choose the report group to which you want the report to belong.

Step 2 Click New Standard Report.

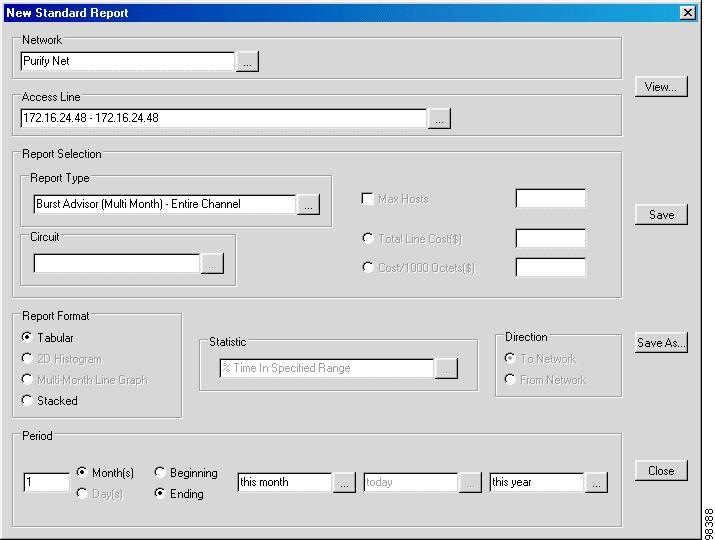
The New Standard Report window, shown in Figure 9-2, appears.

Figure 9-2 New Standard Report Window

Step 3 Select a network and access line on which to generate the report.

Step 4 Choose a report type from the list. The list displays report types relevant to the selected network type and access line. (See Table 9-1 for a list of report types.)

Step 5 When appropriate for the report type, choose a circuit on which to report:

for Frame Relay, choose the DLCI or PVC name. DLCIs only apply to single ended reports

for ATM, choose a VPI/VCI

for IP Transport, choose an IP circuit.

Step 6 Choose a report format (Tabular, 2D Histogram, Stacked, or Multi-Month Line Graph). Options vary by report type (see the "Selecting a Report Format" section).

When you choose a report format other than Tabular, you can choose a statistic on which to report. When you choose Tabular, a report is generated on all available statistics.

Step 7 In the Direction pane, choose:

To Network to report on traffic flowing to the public WAN from the site

From Network to report on traffic flowing from the public WAN into the site.

When these options are not available, the generated report is based on traffic flowing in both directions.

Step 8 Specify the time period of the report. (See the "Scheduling a Report Group" section.)

Enter the number of days or months for the reporting period

Choose either Month or Day and either Beginning or Ending

Choose either a relative or absolute Month, Day, and Year.


Note You cannot exclude a WAN service provider's maintenance window from a reporting time period for any Standard report. However, you can exclude a maintenance window from some Executive reports.


Standard Reports List

Table 9-1 lists all possible standard report types alphabetically. The availability of a specific report depends on the type of network and access line selected.

Table 9-1 Standard Report Types 

Report Type
Description

Burst Advisor—Entire Channel

Displays access channel utilization profile by day or hour. Utilization is calculated as the percentage of time specific percentages of line speed are in use. The report recommends either increasing or decreasing your bandwidth.

Burst Advisor (Multi-Month)—Entire Channel

Displays access channel utilization profile by month. Utilization is calculated as the percentage of time specific percentages of line speed are in use. The report recommends either increasing or decreasing your bandwidth.

DDS CSU/DSU Access Line Performance

Indicates the line status by displaying any abnormal DDS activity during the reporting period. Statistics include the total number of Errored Seconds, Severely Errored Seconds, and Unavailable Seconds.

DS3 Access Line Performance

Indicates the line status by displaying abnormal DS3, T1, or E3 activity during the reporting period. Statistics include the total number of Errored Seconds, Severely Errored Seconds, and Unavailable Seconds. The same report is generated for all three line types.

DSL Access Line Performance

Indicates the line status by displaying abnormal DSL activity during the reporting period. Statistics include Errored Seconds, Severely Errored Seconds, Unavailable Seconds, and Signal Quality.

End-to-End IP Circuit Packet Delivery Ratio

(IP Transport only) Reports on packet delivery ratio (PDR) for a selected class of service in 2D histogram and line graph format for days in a month. For similar reports in table format, use the "End-to-End IP Circuit CoS Service Level Verification" report with all classes.

End-to-End IP Circuit Packet Delivery Ratio (Multi-Month)

(IP Transport only) Reports on packet delivery ratio (PDR) for a selected class of service in 2D histogram and line graph format for multiple months.

End-to-End IP Circuit Protocol Activity

(IP Transport only) Displays the total number of octets sent by either end of an end-to-end IP circuit, up to the maximum number of user-selected application protocols.

End-To-End IP Circuit Round Trip Delay

(IP Transport only) Reports on round trip delay (RTD) for a selected class of service in 2D histogram and line graph format for days in a month. For similar reports in table format, use the "End-to-End IP Circuit CoS Service Level Verification" report with all classes.

End-To-End IP Circuit Round Trip Delay (Multi-Month)

(IP Transport only). Reports on round trip delay (RTD) for a selected class of service in 2D histogram and line graph format for multiple months.

End-To-End IP Circuit CoS Service Level Verification Data

(IP Transport only) Reports Round Trip Delay (RTD) and Packet Delivery Ratio (PDR) for each class of service, in table format only. Availability is obtained per circuit from the ASE.

End-To-End IP Circuit CoS Service Level Verification Data (Multi-Month)

(IP Transport only) Reports Round Trip Delay (RTD) and Packet Delivery Ratio (PDR) for each class of service, in table format only for multiple months.

End-To-End IP Circuit Usage Counts

(IP Transport only) Displays the total number of octets and packets transmitted from both ends of an end-to-end IP circuit.

End-To-End IP Circuit Utilization And Throughput

(IP Transport only) Displays the percentage of access channel capacity utilized and the average throughput in Kbps of each end of an end-to-end IP circuit.

End-to-End Throughput Above/Below CIR

(Frame Relay only) Displays the throughput (in Kbps) that falls above or below the CIR. Measurements are taken to the network from the near end of an end-to-end VC.

End-to-End VC Burst Advisor

Displays utilization by VC by day or hour. For ATM circuits, utilization is calculated as the percentage of time the VC utilization is greater than the SCR or PCR, depending on the CoS. For Frame Relay circuits, utilization is calculated as the percentage of time the VC utilization is greater than the CIR. The report recommends either increasing or decreasing the SCR, PCR, or CIR.

End-to-End VC (Multi-Month) Burst Advisor

Displays utilization by VC by month. See the "End-to-End VC Burst Advisor" entry above for description.

End-to-End VC Congestion Performance

For Frame Relay circuits, displays the total number of seconds during which at least one BECN or FECN frame was received at either end of an end-to-end DLCI. Also displays the total number of DE Frames received at either end.

End-to-End VC Protocol Activity

For Frame Relay circuits, displays the total number of octets sent by either end of an end-to-end circuit, up to the maximum number of user-selected network and/or application protocols.

For ATM circuits, displays the total number of cells sent by either end of an end-to-end circuit, up to the maximum number of user-selected network and/or application protocols.

(For each case, the number of protocols is determined by the capability of the ASE or partner device.)

End-to-End VC Quality of Service Data

Displays quality of service for Availability (%), Cell Loss Ratio (%), and Cell Transfer Delay (%).

End-to-End VC Quality of Service Data (Multi-Month)

Displays quality of service for Availability (%), Cell Loss Ratio (%), and Cell Transfer Delay (%) by month.

End-to-End VC Service Level Verification Data

Displays the average availability, FDR, and RTD for the VC for each day during the reporting period, or for each hour when the period is one day. Available only for AAL-5 circuits in ATM networks.

End-to-End VC Service Level Verification Data (Multi-Month)

Displays the average availability, FDR, and RTD for the VC by month. Available only for AAL-5 circuits in ATM networks.

End-to-End VC Usage Counts

Displays the total number of cells, octets, frames, or PDUs transmitted from both ends of an end-to-end VC.

End-to-End VC Utilization and Throughput

Displays the percentage of access channel capacity utilized and the average throughput in Kbps of each end of an end-to-end VC. Also displays the average throughput as a percent of CIR (for Frame Relay) or SCR (for ATM) utilized.

IP CoS Throughput Above/Below Policing Threshold—Entire Channel

(IP Transport only) Displays throughput above and below the class of service (CoS) policing threshold to the network for each class of service over the entire channel.

IP Usage Counts—Entire Channel

Displays the total count of IP statistics for the entire access channel.


Generating Executive Reports

Executive reports provide quick access to a select set of network-wide statistics. You can use these reports to verify service levels and plan the capacity for individual network elements. Unless otherwise specified, values displayed in Executive reports apply to the data transmitted and received on the access line.

Service Level Verification reports are available for Frame Relay and AAL-5 circuits in ATM. Circuit reports for IP Transport ASEs show only the PVC name. These reports provide objective verification of end-to-end carrier services and help users plan for future service needs. Capacity planning reports are also available.


Note Executive reports are based on data stored in the long-term database—you cannot generate a report for an ASE or access line for which there is no collected data.


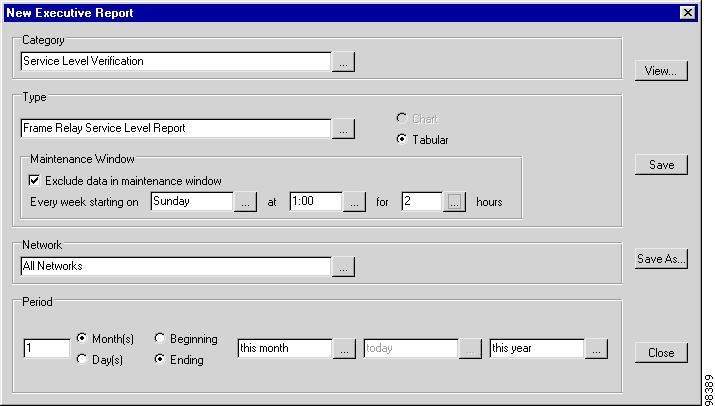
Figure 9-3 New Executive Report Window

Defining an Executive Report


Step 1 From the Planning and Reporting window, choose the report group to which you want the report to belong.

Step 2 Click New Executive Report. (See Figure 9-3.)

Step 3 Select a report category from the list: Service Level Verification (reports dealing with quality of service and problem areas in the network) or Capacity Planning (reports dealing with usage).

Step 4 Choose a report type. For details on Service Level Verification reports, see Table 9-2. For Capacity Planning reports, see Table 9-3.

Step 5 Choose Chart or Tabular format. (Service Level and ATM Quality of Service reports are available only in tabular format.)

Step 6 In the Maintenance Window pane, determine whether to exclude routine maintenance time from the report calculation. When you choose Exclude data in maintenance window, specify the time weekly network maintenance is performed.


Note The Maintenance Window pane is available only for the Port Availability, Service Level, and VC Availability reports.


Step 7 Choose the network for the report to analyze.

Step 8 Enter the time period to be reported on. (See the "Scheduling a Report Group" section.)

enter the number of days or months for the reporting period

choose either Month or Day and either Beginning or Ending

choose either a relative or absolute Month, Day, and Year. The time period for the service level verification reports is intended to be fairly long, such as one month.


Service Level Verification Reports

Table 9-2 lists the Executive reports in the Service Level Verification category alphabetically. These reports address quality of service and problem areas in the network.

Table 9-2 Executive Report Types: Service Level Verification 

Report Type
Description

ATM Quality of Service

Displays Circuit Designation, SCR (Cells per second), Availability (%), Cell Transfer Ratio (%), Cell Loss Ratio (%) for all ATM VCs in the network. Tabular format only.

Most Congested VCs— ATM

Shows the ATM VCs in your network that experienced the most congestion, based on congested seconds.

Most Congested VCs— Frame

Shows the Frame Relay VCs in your network that experienced the most congestion, based on Frame Relay explicit congestion notification seconds.

Port Availability

(Frame Relay only) Measures the availability of all WAN service provider's switch ports on the entire network. Calculations are based on LMI analysis. A port is considered available when the switch is responding to user polls, or when no user polls are present. A port is considered unavailable when the switch does not respond to three consecutive user polls. Calculations can exclude the time the WAN service provider has shut down the network for scheduled maintenance when the maintenance period is specified in the report definition.

Service Level Report

Measures the availability, FDR, and RTD for each VC in the network. VCs are grouped by line speed, and each group is presented in descending order by CIR (for Frame Relay) or SCR (for ATM). Average measurements for each speed are provided based on CIR or SCR. Calculations can exclude the time the WAN service provider has shut down the network for scheduled maintenance when the maintenance period is specified in the report definition. For ATM networks, this report is available only for AAL-5 circuits. Tabular format only.

Top Problem Physical Lines

Shows the access lines in your network that experienced the highest number of errored seconds per day. Includes all access line types, with either Frame Relay or ATM ASEs.

Top Problem Access Channels—ATM

Shows the access channels in your network that experienced the highest number of errors per day. The errors counted are:

out of cell delineation

AIS condition

RDI error

Top Problem Access Channels—Frame

Shows the access channels in your network that experienced the highest number of errors per day. The errors counted are short frames and FCS alignment errors.

VC Availability

Ranks VCs from least to most available based on unavailable seconds. Calculations can exclude the time the WAN service provider has shut down the network for scheduled maintenance when the maintenance period is specified in the report definition. For ATM networks, this report is available only for AAL-5 circuits.

VC Cell Loss Ratio

Ranks VCs from highest to lowest based on the ratio of cells received to the number of cells offered by the far end.

VC Cell Transfer Delay

Ranks VCs from highest to lowest in average cell transfer delay. (Cell transfer delay is a sample of the number of milliseconds of one-way delay on a circuit during a 15-minute collection period. When this value is -1, the measurement is not valid.)

VC Frame Delivery Ratio

Ranks VCs from lowest to highest FDR based on the ratio of frames received to the number of frames offered by the far end. For ATM networks, this report is available only for AAL-5 circuits.

VC Round Trip Delay (RTD)

Ranks VCs from highest to lowest average RTD. For ATM networks, this report is available only for AAL-5 circuits.


Capacity Planning Reports

Table 9-3 lists the Executive reports in the Capacity Planning category alphabetically. These reports address usage.

Table 9-3 Executive Report Types: Capacity Planning 

Report Type
Description

Most Active Access Channels

Shows the access channels that experienced the highest throughput both to and from the network during the reporting period.

Most Active IP Circuits

Shows the IP circuits that experienced the highest throughput (measured in bps) to the network during the reporting period.

Most Active VCs

Shows the VCs that experienced the highest throughput (measured in bps) to the network during the reporting period.

Most Overutilized Access Channels (Rx)

Most Overutilized Access Channels (Tx)

Shows the access channels that experienced high utilization levels for the longest period of time. Measures throughput burst in the indicated direction (Rx or Tx) using the following ratio, based on 1-second utilization:

burst duration over 90% capacity/burst duration over 10% capacity

Most Overutilized VCs

Shows the VCs that experienced high utilization levels for the longest period of time. Measures throughput to the network using the following ratio, based on 1-second utilization:

burst duration over 120% CIR or SCR/burst duration over 20% CIR or SCR

(CIR is for Frame Relay; SCR is for ATM.)

Most Underutilized Access Channels (Rx)

Most Underutilized Access Channels (Tx)

Shows the access channels that experienced low utilization levels for the longest period of time in the indicated direction (Rx or Tx). Measures duration of throughput burst as percentage of time less than 10 percent of access channel speed, based on 1-second utilization.

Most Underutilized VCs

Shows the VCs that experienced low utilization levels for the longest period of time to the network. Measures duration of throughput burst as percentage of time less than 20 percent of CIR (for Frame Relay) or SCR (for ATM), based on 1-second utilization.

Network Usage Profile

Shows the average network traffic levels on a typical day during the measurement period. Based on the average number of octets per hour transmitted over the network.


Selecting a Report Format

You can produce reports in tabular and graphical formats:

a tabular format presents all available report information in a table

a graphical format presents only one type of report information or statistic in one of three graphical forms: vertically stacked set, histogram (bar chart), or line graph. Quantity or percentage is displayed on the vertical axis and time on the horizontal axis.

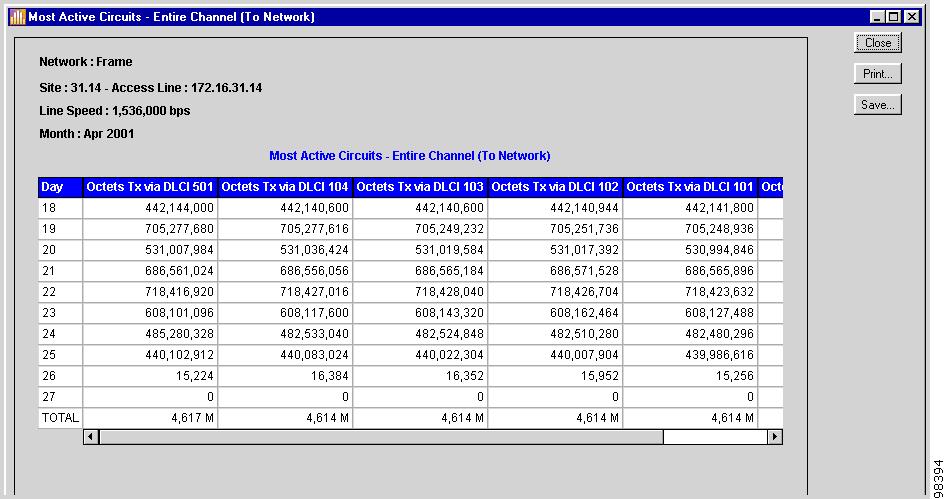
Choose the report format in the Report Format selection box in the New Standard Report window, or the Chart or Tabular radio buttons in the New Executive Report window. For Standard reports, the availability of report formats is determined by the type of report selected. Figure 9-4, Figure 9-5, Figure 9-6, and Figure 9-7 show examples of each standard report format.

Figure 9-4 Tabular Report

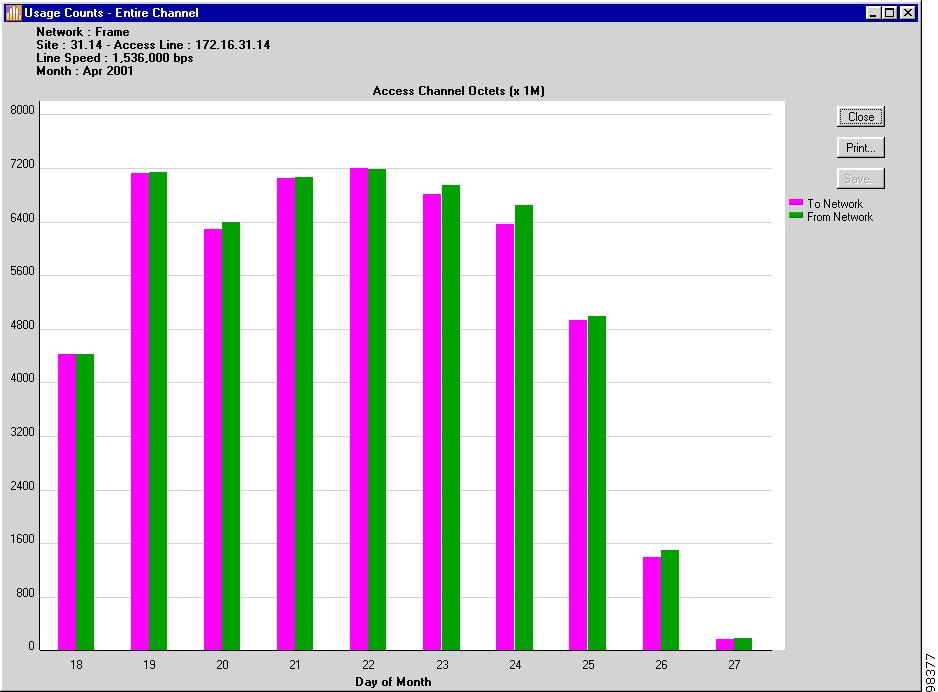
Figure 9-5 Stacked Standard Report (Chart for Executive Reports)

Figure 9-6 Histogram - 2-day Historical Standard Report

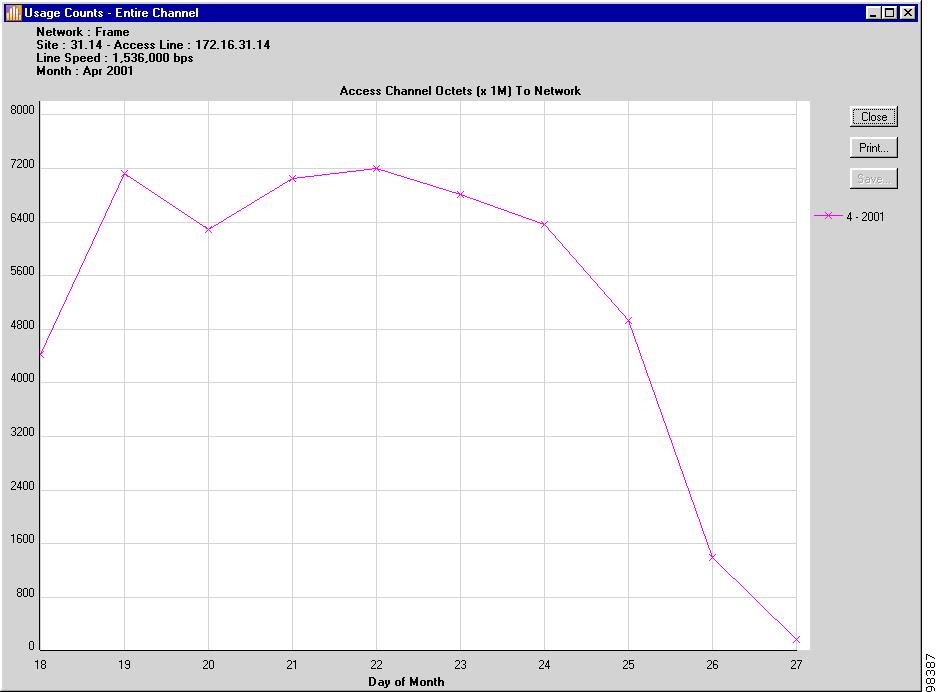
Figure 9-7 Line Graph: Multi-Month Standard Report

Creating a Report Definition

When you define a report, you are saving the report's settings for future use. You can then schedule the report to be auto-generated, or simply view the report on an ongoing basis without reconfiguring it.

As you define reports, keep in mind the business need for the information they provide. This affects the report data type you specify, since each predefined report type generates an analysis on different data collection parameters.

The business need of the defined report also affects how you schedule and save it. When you need the same type of information updated routinely, define a relative reporting period for the report. When you need the same exact information for historical purposes, define an absolute reporting period for the report. In either case, save the report under a meaningful name in the appropriate report group so you can retrieve it again easily. (See the "Scheduling a Report Group" section.)

When you expect to need the information only once, create a report and either view or print it immediately—you need not save it in a report group.


Caution When you close the New Standard Report or New Executive Report window without saving the report definition—even after viewing, printing, or saving the report itself—the report definition is lost.


Step 1 In the Planning and Reporting window, choose the report group to which you want the report to belong.

Step 2 Click New Standard Report or New Executive Report and specify the report's parameters. For more information, see the "Generating Standard Reports" section and the "Generating Executive Reports" section.

Step 3 To save the report definition in the current report group so you can repeatedly generate or view it, click Save or Save As.


Editing, Copying, or Deleting a Report

After generating and defining a report, you can modify its configuration.


Step 1 In the Planning and Reporting window, choose the report group that has the report you want to manage.

Step 2 Choose the report from the Reports list, and choose:

Edit—to change report definition parameters

Save As—to save a copy of the report under a new name

Delete—to remove the report definition from the current report group. When the actual report data had previously been saved to a file, the output file is not deleted.


Viewing, Printing, or Saving a Report

When you view a report, you can print it or save it to an output file.


Note You cannot save graphical reports on the PAC or any reports on Web Planning and Reporting. To save graphical reports, use the scheduling option (see the "Scheduling a Report Group" section).


Step 1 In the Planning and Reporting window, choose the group with the report you want to manage.

Step 2 Under Reports, choose the report. When it does not exist, click New Standard Report or New Executive Report to create it.

Step 3 Click View (from either the Planning and Reporting window or the current window).

When no data is available for the report, a notification window appears. When report data is available, the data is displayed in graphical or tabular form, depending on the report definition.

Step 4 (Optional) From the Report window, choose:

Print—to choose printing options for any printer configured to your local workstation.

Save—to save the report as either an HTML or CSV file. Save the report to HTML to view the data using a Web browser. Save to CSV to import the report data into a database table or spreadsheet.

View—to display the report on your monitor and view options for printing or save the report itself—not its definition—to a file.


Caution Saving a report that you view saves the actual report data only, not the report definition. You can only save a report definition from the Save or Save As options in New Standard or Executive report window.


Managing Report Groups

In Planning and Reporting, you can create report groups to generate predefined reports whenever needed—either on demand or as scheduled. Report groups help you organize saved reports according to recurring business requirements. For example, you may want to generate a set of reports every week and a different set every month. Or, you may want to generate a set of reports for each of several different access lines.

Use File menu options to create, copy, and delete report groups, and generate the reports they contain on demand.

You can also schedule reports. Report schedules determine the reporting period (when all reports in a group are routinely generated), the report output format (HTML or Comma Separated Variable—CSV), and output destination (the PAM directory or FTP destination and directory). For easy identification, an asterisk (*) appears after the name of scheduled report groups. At the top of the Planning and Reporting window, use the Schedule buttons to add, edit, or remove report schedules. See the "Scheduling a Report Group" section.


Note In Web Planning and Reporting, you can print reports in a group, however, you cannot generate them to output files on demand. You can however, schedule report groups to save to output files.


Creating a Report Group

A group can contain both Standard and Executive reports.


Step 1 Choose File > New Report Group. The New Report Group window appears.

Step 2 Name the group, then click OK. The new group becomes the current group in the Report Group list.

Step 3 Click New Standard Report or New Executive Report to define a report for the group.

Step 4 Define the report as described in the "Managing Individual Reports" section.

Step 5 Click Save to add the report to the report group. The new report's name appears in the Reports list in the Planning and Reporting window.


Caution When you do not save the report definition, it is not placed in a report group nor can it be retrieved later.

Step 6 Repeat Step 3 through Step 5 for each report you add to the group.


Copying a Report Group

When you need more than one group of similar reports, you can copy a report group by saving it as a new name. You then can edit individual reports within each copied report group and add and delete reports as needed.

You can rename the Default Report Group, thus saving reports under it to a more meaningful group name.


Step 1 Choose the group from the Report Group list.

Step 2 Choose File > Save As.

Step 3 Enter a new report group name, then click OK. All reports in the original group are copied into the new group.


Deleting a Report Group

The report group and its report definitions are deleted from the PAM when you delete a report group. Reports previously saved to output files are not deleted.


Step 1 Choose the group from the Report Group list.

Step 2 Choose File > Delete Report Group.

Step 3 Click Yes to confirm.


Generating a Report Group

Generating a report group produces reports on demand, independent of any predefined schedule. You can print the reports on a local printer or save them to output files in directories local to the PAC workstation. From the Web Client, you can print only.

When you generate a report group to an output file, you can save only report data initially presented in tabular form. You cannot save data initially presented in graphical reports to an output file. For more information on report formats, see the "Selecting a Report Format" section.

Printing or Generating Report Groups from the PAC


Step 1 Choose the group from the Report Group list.

Step 2 Choose File > Generate Reports.

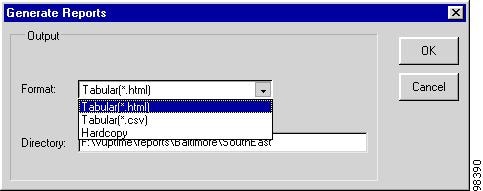
The Generate reports window, shown in Figure 9-8, appears.

Figure 9-8 Generate Reports Window

Step 3 In the Output Format field, choose:

Tabular (*.html)—to save the report as a file you can view from a Web browser

Tabular (*.csv)—to save the reports as ASCII text files you can import into tables and spreadsheets. Each table cell item is delimited by a comma; each table row is delimited by a carriage return.

Hardcopy—to print the reports directly, without saving them to files. Notice the Directory field is unavailable.

Step 4 When you are outputting to CSV or HTML, specify the directory where you want the files saved (this directory must be locally configured on your workstation), then click OK. The following files are created:

an index file for the report group, which contains a list of each report filename

a uniquely named file for each report in the group.

Step 5 When you are outputting to hardcopy, click OK. The Print window appears. Choose printing options for any printer configured to your workstation, then click OK.

For more information, see the "Report Output Filenames and Formats" section.


Printing a Report Group on Demand From the Web Client

In Web Planning and Reporting, generating reports on demand is limited to printing. However, you can generate reports as output files by scheduling the report group. See the "Scheduling a Report Group" section.


Step 1 Choose the group from the Report Group list.

Step 2 Choose File > Print Reports.

Step 3 In the Print window, specify any printer configured for your workstation, then click OK.


Scheduling a Report Group

When you schedule a report group, reports are produced routinely or once—but not immediately—according to that schedule. By scheduling reports, you can generate them when Cisco WAPMS is not being heavily used by PAC and Web Planning and Reporting users. With scheduling options, reports are saved to files in a directory you specify on the PAM or an FTP host.


Note A good time to schedule reports is after database maintenance: for example, at 4 a.m. daily, weekly, or monthly on the first day of the month.


Before a report group is scheduled, an Add Schedule button appears next to the report groups (see Figure 9-1). After you schedule a report group, an asterisk (*) appears after the group's name and the button changes to Edit Schedule. You can change the generation date and time, output format, and destination scheduling properties. The Remove Schedule button is available based on your selections.

When scheduling reports, you can define the reporting period of time as absolute or relative:

use absolute scheduling (Once On) to run a report for a single period only—such as for the month of January 2002. Absolute periods are well suited for immediate, one-time reports you do not want to save and for reports you want to save as a snapshot in time for historical purposes.

use relative period scheduling (Daily, Weekly On, Monthly On) for nonspecific periods—for example, last month. Relative periods are well suited for reports you want to save and schedule to regenerate periodically with updated information (for example, every month, on the last day of the month).

Data for reports accumulates in the PAM long-term database. Therefore, the PAM must be active and collecting data throughout the entire reporting period.

Scheduling a Report Group to Save to Files


Step 1 Choose the group from the Report Group list.

Step 2 Click Add Schedule.

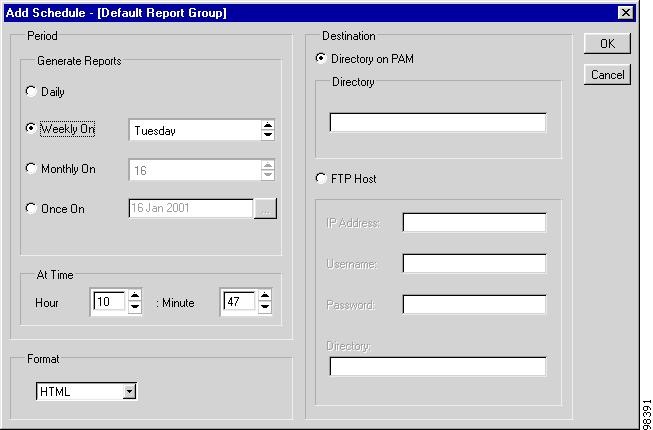
The Add Schedule - Default Report Group Window, shown in Figure 9-9, appears.

Figure 9-9 Add Schedule - Default Report Group Window

Step 3 In the Period pane, schedule the frequency of report generation by clicking:

Daily—to schedule a daily periodic report

Weekly On—to schedule a weekly periodic reports. Enter a day of the week

Monthly On—to schedule a monthly periodic report. Enter a calendar day

Once On—to schedule a report in advance for a one-time date and time. Enter a date or click the
"..." button to use the calendar.

Step 4 Specify a time in the At Time pane.

Step 5 Specify the output file format for all reports in the report group by clicking:

HTML—to save reports as files that can be viewed from a Web browser: HTML files for tabular reports; JPG files for graphical reports

CSV—to save reports as files that can be imported into tables and spreadsheets. The CSV format is available only for tabular reports. Any reports designed in non-tabular formats are dropped.

Step 6 In the Destination pane, specify where the files will be saved at the scheduled time by clicking:

Directory on PAM—to save files on the PAM. Specify a full path location on the PAM. All clients that have a network connection to the PAM can access the reports through their usual network file management application, such as Network Neighborhood in MS Windows.

FTP Host—to save files to an FTP site. Specify the IP address of the site, the Username and Password that have write access to the site, and the full path of the directory location on the site. Make sure you set all addresses. By using an FTP destination, you can direct the files to be created on any workstation that has FTP connectivity to the PAM.

You also can define a virtual directory, such as "reports," on the MS Internet Information Web Server (IIS) that maps to the real output directory, and then grant users read access and directory browsing access. These users can then view the reports by specifying the server name and the virtual directory name. Users can also hide the actual path and change it as needed without affecting other users.

Step 7 Click OK. The following files are created:

an index file for the report group, which contains a list of each report filename

a uniquely named file for each report in the group.

For more information, see the following section "Report Output Filenames and Formats".


Report Output Filenames and Formats

When you schedule report groups to save in CSV or HTML output format, an index file for the group is created using the following naming convention:

yyyymmdd_hhmmss_DomainName_ReportGroupName.HTML

or:

yyyymmdd_hhmmss_DomainName_ReportGroupName.CSV

The index file lists the files generated for each report. The report file naming convention is:

yyyymmdd_hhmmss_DomainName_ReportGroupName<index>.<ext>

where <index> is the place number of the report in the group (for example, the first report has an index of 1), and <ext> indicates the file type (CSV, HTML, or JPG).

For the HTML output, an HTML file is created that links to a report file that holds the data for each tabular report, and a JPG file is created for each nontabular, or graphical, report.

For example, when you save, in HTML format, a report group containing five reports (three tabular and two graphical), six files are created:

three HTML files

two JPEG files

an HTML index file with five HTML links to the five other files.

When you save the same group in CSV format, the following files are created:

three CSV files (one for each tabular report)

two JPEG files (one for each graphical report)

an HTML index file listing the names of the other five generated files.

When you generate Report Groups on demand using File > Generate Reports, the same naming conventions are applied, but only tabular reports are generated as files.


Note Do not use blank spaces in report group names. These may not be displayed by some Netscape browser versions (an "Object not found" error results.)