Downloads |
 Feedback Feedback
|
Table Of Contents
Starting the IPM Server on Windows
Starting the IPM Client on Windows
Starting the IPM Client in a Web Browser
Enabling the IPM Password on Solaris
Disabling the IPM Password on Solaris
Enabling the IPM Password on Windows
Disabling the IPM Password on Windows
Running Simultaneous IPM Sessions
Configuring the IPM Components
Viewing Network Performance Statistics
Viewing Network Performance Statistics in Real Time
Viewing Historical Network Performance Statistics
Getting Started with IPM
This chapter provides information about starting the IPM application and configuring a collector to gather latency data. It includes the following major sections:
•
Configuring the IPM Components
•
Starting IPM
Since the IPM application is comprised of a server component and a client component, you must start both components to run the application. If the IPM server and client are installed on the same system, you can start the IPM server and client using a single command, or you can start them separately.
The following sections provide details for starting the IPM server and client:
•
Starting IPM on Solaris
To start the IPM server and client on a Solaris system, enter:
# cd /opt/CSCOipm/bin# ./ipm
Note
To start only the IPM server on a Solaris system, enter:
# cd /opt/CSCOipm/bin# ./ipm start
Note
To start only the IPM client on a Solaris system, enter:
# cd /opt/CSCOipm/bin# ./ipm start clientIf you installed the IPM client and IPM server on different Solaris systems, you must enter the ipm start command from the /opt/CSCOipmClient/bin directory:
# cd /opt/CSCOipmClient/bin# ./ipm start clientTo start the IPM client and connect to an IPM server other than the default server, enter:
# cd /opt/CSCOipmClient/bin# ./ipm start client server_namewhere server_name is the Solaris or Windows NT system on which the IPM server is running.
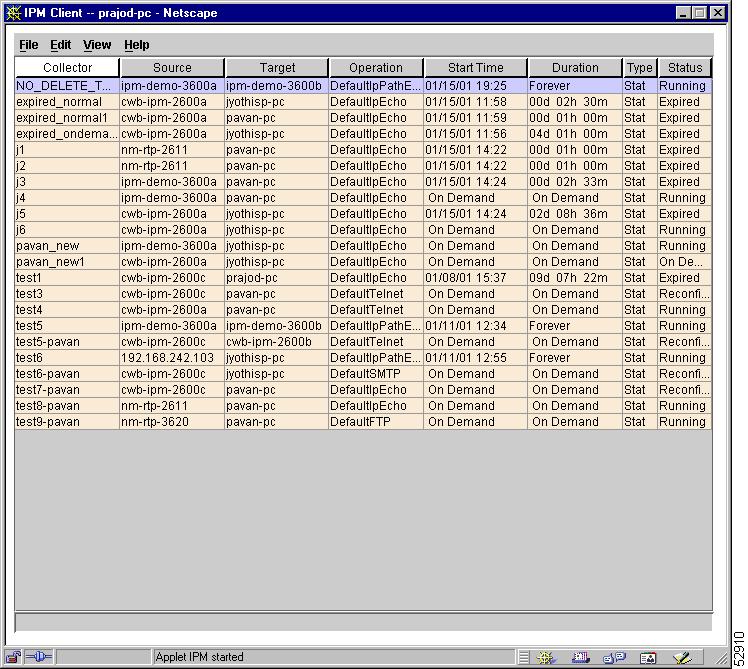
When the IPM client starts, it displays the IPM Main window (Figure 2-1). The name of the system on which the IPM server is running appears in the title bar of the IPM main window.
Figure 2-1 IPM Main Window
When you start IPM for the first time, the IPM Main window contains no collectors. As you configure collectors, they appear in the window. Each collector is a combination of a configured source, a target, and an operation. For each collector, you specify parameters for gathering statistics and scheduling.
Starting IPM on Windows
This section describes how to start the IPM server on Windows, and how to start the IPM client on Windows 98, Windows NT, Windows 2000 Professional or Windows 2000 Server. It includes the following sections:
•
•
•
Starting the IPM Server on Windows
To start the IPM server and client on a Windows system, enter:
cd c:\Program Files\Internetwork Performance Monitor\Server\binipm
Note
To start only the IPM server on a Windows system, enter:
cd c:\Program Files\Internetwork Performance Monitor\Server\binipm start
Note
To start only the IPM client on a Windows system, enter:
cd c:\Program Files\Internetwork Performance Monitor\Server\binipm start clientIf you installed the IPM client and IPM server on different Windows systems, you must enter the ipm start command from the c:\Program Files\Internetwork Performance Monitor\client\bin directory:
cd c:\Program Files\Internetwork Performance Monitor\client\binipm start clientTo start the IPM client and connect to an IPM server other than the default server, enter:
cd c:\Program Files\Internetwork Performance Monitor\client\binipm start client server_namewhere server_name is the Solaris or Windows system on which the IPM server is running.
When the IPM client starts, it displays the IPM Main window (Figure 2-1). The name of the system on which the IPM server is running appears in the title bar of the IPM main window.
When you start IPM for the first time, the IPM main window contains no collectors. As you configure collectors, they are displayed in the window. Each collector is a combination of a configured source, a target, and an operation. For each collector, you specify parameters for gathering statistics and scheduling.
Starting the IPM Client on Windows
When you install the IPM client on a Windows 98, Windows NT, Windows 2000 Server or Windows 2000 Professional system, the installation program adds two icons to your desktop: one icon for connecting to the IPM server you specified during installation, and one icon for connecting to any IPM server.
To start the IPM client on a Windows system and connect to the default IPM server:
Step 1
Step 2
To start the IPM client on a Windows system and connect to any IPM server:
Step 1
Step 2
Step 3
Starting the IPM Client in a Web Browser
You can run the IPM client as an applet from an Internet Explorer or Netscape Navigator Web browser if:
•
•
To start the IPM client as an applet in a Web browser:
Step 1
Step 2
Figure 2-2 IPM Server Home Page
Note
Step 3
Implementing Client Security
To help protect the integrity of your IPM database, IPM provides client security, which enables you to define an IPM password. Thereafter, the username and password are required to access secure Web client functions, including:
•
•
•
•
Note
The non-secure Web client allows you to view statistical graphs, but you cannot modify, start, or stop IPM resources.During a given Web browser session, IPM prompts you only once for the username and password. Thereafter, you can launch the Web client, download the client, view seed files from the Web, or use the ipm tshoot command without re-entering the username and password.
However, if you close and re-open the Web browser, you are prompted for the username and password the next time you launch the Web client, download the client, view seed files from the Web, or use the ipm tshoot command.
IPM on Solaris also provides a second password, independent of the first, which is required to start any IPM client from the command line on a Solaris system. If you enter the ipm start client command, IPM prompts you for the password before starting the client. (This password is not required when launching the secure Web client from the IPM Server Home Page.)
If at any time you change an IPM password, you must clear the Web browser's cache and start the Web browser again. It is the user's responsibility to control the IPM passwords.
The following sections provide details for setting up IPM client security:
•
•
•
•
Enabling the IPM Password on Solaris
To enable IPM passwords on Solaris:
Step 1
Step 2
# cd /opt/CSCOipm/bin# ./ipm password
Note
Step 3
Password protection on Secure Client and Seed Files is Disabled. Enable? [y]
Type y and press Enter.
Step 4
Step 5
IPM displays:
Password protection on Secure Client and Seed Files is Enabled.
Use username 'ipm' and the chosen password to access IPM Secure Client and Seed Files.
Clear Browser cache and restart browser after changing IPM password.
The username (ipm) and password for the secure client, seed files, and ipm tshoot command are enabled.
IPM then displays:
Password protection on Client Launching is Disabled. Enable? [y]
Type y and press Enter.
Step 6
Step 7
IPM displays:
Password protection on Client Launching is Enabled.
Enter the password when launching Solaris client.
The IPM password for starting IPM clients on the Solaris system is enabled.
Disabling the IPM Password on Solaris
To disable IPM passwords on Solaris:
Step 1
Step 2
# cd /opt/CSCOipm/bin# ./ipm password
Note
IPM displays:
Password protection on Secure Client and Seed Files is Enabled. Disable? [y]
Step 3
IPM then displays:
Password protection on Client Launching is Enabled. Disable? [y]
Step 4
Enabling the IPM Password on Windows
To enable an IPM password on Windows:
Step 1
Step 2
cd c:\Program Files\Internetwork Performance Monitor\Server\binipm password
Note
IPM displays:
Password protection on Secure Client, Trouble Shooting, and viewing Seed Files via Web is Disabled. Enable? [y]
Step 3
Step 4
Step 5
IPM displays:
Password protection on Secure Client, Trouble Shooting, and viewing Seed Files via Web is Enabled.
Use username `ipm' and chosen password to access IPM Secure Client, Trouble Shooting, and viewing Seed Files via Web.
Clear Browser cache and restart browser after changing IPM password.
The username (ipm) and password for the secure client, ipm tshoot command, and viewing seed files via the Web, are enabled.
Disabling the IPM Password on Windows
To disable the IPM password on Windows:
Step 1
Step 2
cd c:\Program Files\Internetwork Performance Monitor\Server\binipm password
Note
IPM displays:
Password protection on Secure Client, Trouble Shooting, and viewing Seed Files via Web is Enabled. Disable? [y]
Step 3
Running Simultaneous IPM Sessions
IPM uses a client/server architecture that allows you to run multiple sessions of the IPM client simultaneously. Central services and database functions are provided on an IPM server that communicates to multiple IPM clients. You can install the IPM client software on the same system as the IPM server, or on a different system on the same network as the IPM server.
Note
Configuring the IPM Components
To collect network performance metrics using IPM, you must define a collector in a source router. A collector is a definition of a source router, a target device, an operation, and a collector schedule.
To define a collector, complete the following tasks:
Defining a Source Router
IPM source routers are the routers from which packets are sent to measure and store statistical data, including network latency, jitter, availability, packet loss, and errors. Each source router must contain the Cisco IOS software SA Agent feature.
The types of operations you can use are determined by the version of the Cisco IOS software running on the source router. IPM automatically checks the Cisco IOS software version on the router and limits the creation of operations to those supported by the source router. For information about the recommended versions of Cisco IOS software to use with IPM, see the "Cisco IOS Software Requirements" section of the Cisco Internetwork Performance Monitor Installation Guide.
To define a new source router:
Step 1
Step 2
For information about configuring SNMP on the source router, see the "Configuring Your Routers to Send SA Agent-Related Traps" section in the "Preparing to Install" chapter of the Cisco Internetwork Performance Monitor Installation Guide.
Step 3
Figure 2-3 Configuration Window—Source Configuration
Step 4
Step 5
Step 6
Step 7
Step 8
Step 9
Note
Step 10
If you must add a large number of source routers to IPM, you can use the Source Configuration window to add them one-by-one, but it is more efficient to use a seed file. For information about using a seed file to add source routers to IPM, see the "Adding Components Using Seed Files" section. For information about viewing or deleting source routers, see the "Working with Source Routers" section.
Note
Those RTR configuration statements typically appear only in the running configuration; they are not saved to the nonvolatile RAM (NVRAM) configuration. They affect only RTR-based functions, and have no other effect on router configuration.
Defining a Target
IPM targets are destination devices for which you want to gather data. A target can be any IP-addressable device, an SA Agent Responder, or an SNA host.
To define a device as a target:
Step 1
Step 2
Figure 2-4 Target Configuration Window
Step 3
•
•
You must enable the SA Agent Responder at the router using the rtr responder configuration command.
•
NSPECHO must be installed on the VTAM mainframe to be used as the target. The NSPECHO application is provided on the IPM product CD. For information about installing NSPECHO, see the "Installing NSPECHO to Measure SNA Response Times" chapter in the Cisco Internetwork Performance Monitor Installation Guide.
Step 4
•
•
•
Step 5
Step 6
Step 7
Note
Step 8
If you must add a large number of targets to IPM, you can use the Target Configuration window to add them one-by-one, but it is more efficient to use a seed file. For information about using a seed file to add targets to IPM, see the "Adding Components Using Seed Files" section. For information about viewing or deleting targets, see the "Working with Target Devices" section.
Defining a Collector
Defining a collector involves selecting a source router, a target, an operation, and a collector schedule.
To define a new collector:
Step 1
Step 2
Figure 2-5 Collector Configuration Window
Step 3
Step 4
Step 5
•
•
Step 6
•
•
Figure 2-6 Set Date Range Window
Step 7
•
•
Note
Step 8
•
•
•
Step 9
Step 10
Step 11
Note
Step 12
When you install IPM, a group of predefined operations is provided. The predefined operations are described in Table 2-1.
Table 2-1 Predefined Operations
DefaultDHCP
Measures end-to-end latency for acquiring a new DHCP lease.
DefaultDLSw
Measures end-to-end latency in a network which uses DLSw to route SNA traffic over an IP network. Request size is set to 64 and Response Payload is set to 64.
DefaultDNS
Measures end-to-end latency for DNS lookups. DNS Name Server is set to the IP address of the DNS server configured on the system on which the IPM server is running. The DNS Lookup Name is set to the name of the host to look up for the DNS request.
DefaultFTP
Measures the time to perform a TCP connect operation directed at the selected target on the standard FTP port 21. Packet Priority is set to 0 (no priority) and Target Port is set to 21.
DefaultHTTPConn
(was called DefaultHTTP prior to IPM Release 2.2)Measures the time to perform a TCP connect operation directed at the selected target on the standard HTTP port 80. Packet Priority is set to 0 (no priority) and Target Port is set to 80.
Note that DefaultHTTPConn is not a true HTTP operation, it is a TCP Connect operation. IPM does not provide a true default HTTP operation; you must create your own. See the "Measuring Network Performance for HTTP" section for information about creating a new HTTP operation.
DefaultIpEcho
Measures end-to-end latency in an IP network. Protocol is set to IP, Packet Priority is set to 0 (no priority), and Request Payload is set to 64 bytes.
DefaultIpPathEcho
Measures hop-by-hop latency in an IP network. Packet Priority is set to 0 (no priority), Request Payload is set to 64 bytes, Maximum Paths is set to 5, Maximum Hops is set to 15, and sample interval is set to 180 seconds.
DefaultNNTP
Measures the time to perform a TCP connect operation directed at the selected target on the standard Network News Transport Protocol (NNTP) port 119. Packet Priority is set to 0 (no priority) and Target Port is set to 119.
DefaultPOP3
Measures the time to perform a TCP connect operation directed at the selected target on the standard Post Office Protocol v.3 (POP3) port 110. Packet Priority is set to 0 (no priority) and Target Port is set to 110.
DefaultSMTP
Measures the time to perform a TCP connect operation directed at the selected target on the standard Simple Mail Transfer Protocol (SMTP) port 25. Packet Priority is set to 0 (no priority) and Target Port is set to 25.
DefaultSnaLu0Echo
Measures end-to-end latency in an SNA network using LU0. Protocol is set to SNA LU0, Mode Name is set to INTERACT, and Response Payload is set to 64 bytes.
DefaultSnaLu2Echo
Measures end-to-end latency in an SNA network using LU2. Protocol is set to SNA LU2, Mode Name is set to D4A32782, and Response Payload is set to 64 bytes.
DefaultSnaSSCPEcho
Measures end-to-end latency in an SNA network using SSCP protocol. Protocol is set to SNA SSCP.
DefaultTelnet
Measures the time to perform a TCP connect operation directed at the selected target on the standard Telnet port 23. Packet Priority is set to 0 (no priority) and Target Port is set to 23.
DefaultUDPEcho
Measures end-to-end latency for a UDP datagram. Packet Priority is set to 0 (no priority), Request Payload is set to 64 bytes, and Target Port is set to 7.
DefaultVideo
Measures latency and jitter for Video traffic. Packet Priority is set to 0 (no priority), Request Payload is set to 1024 bytes, Packet Interval is set to 20 milliseconds, Number of Packets is set to 20, Jitter Threshold is set to 250, and Target Port is set to 50505.
DefaultVPN
Measures latency and jitter for VPN traffic. Packet Priority is set to 0 (no priority), Request Payload is set to 1024 bytes, Packet Interval is set to 20 milliseconds, Number of Packets is set to 20, Jitter Threshold is set to 250, and Target Port is set to 2000.
Default160ByteVoice
Measures latency and jitter for Voice over IP traffic. Packet Priority is set to 5, Request Payload is set to 160 bytes, Packet Interval is set to 20 milliseconds, Number of Packets is set to 10, Jitter Threshold is set to 250, and Target Port is set to 16400.
Default60ByteVoice
Measures latency and jitter for Voice over IP traffic. Packet Priority is set to 5, Request Payload is set to 60 bytes, Packet Interval is set to 20 milliseconds, Number of Packets is set to 10, Jitter Threshold is set to 250, and Target Port is set to 16400.
Note that you can define one or more new operations to fit your needs. For information about defining, modifying, or deleting operations, see the "Working with Operations" section.
Note
Note
Step 13
Step 14
Step 15
Figure 2-7 Extra DNS Settings Window
Step 16
If you must add a large number of collectors to IPM, you can use the Collector Configuration window to add them one-by-one, but it is more efficient to use a seed file. For information about using a seed file to add collectors to IPM, see the "Adding Components Using Seed Files" section. For information about viewing or deleting collectors, see the "Working with Collectors" section.
Viewing Network Performance Statistics
As your collectors begin to gather network performance statistics and store the information in the IPM database, you can view the resulting data.
IPM provides two methods for reviewing network performance statistics:
•
•
Viewing Network Performance Statistics in Real Time
The Real Time Statistics window allows you to view statistics for an active collector as the data is being collected. This data appears only in real time, it is not stored in the IPM database.
The Real Time Statistics window displays up to 1000 points of data; the most recent 1000 points are always displayed. That is, when a real time graph reaches 1000 points of data, as the most recent points are added to the right side of the graph the earliest points disappear from the left side. If you watch the last data point at the far right of the graph, you can see it change at the end of a sampling interval.
For example, if your sampling interval is once every 60 seconds, in less than a day the real time graph will have reached 1000 points of data. After that time, you can see the last data point on the right of the graph change every 60 seconds.
To view statistics in real time:
Step 1
Step 2
Figure 2-8 Real Time Statistics Window
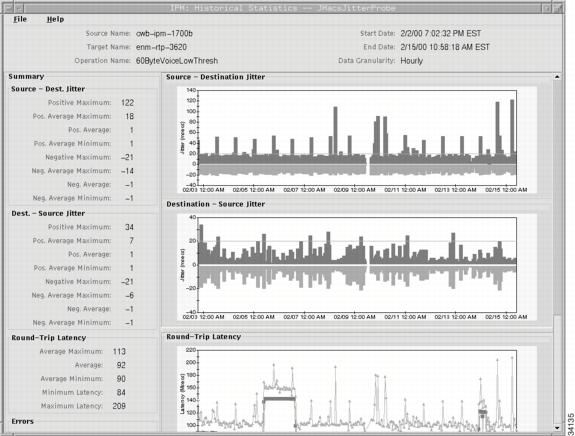
Figure 2-9 Jitter Real Time Statistics Window
Statistics appear as soon as the frequency interval elapses. Data points are added to the graph for each interval that the statistics are measured for the selected collector.
Table 2-2 describes the actions you can perform in the Real Time Statistics window.
Viewing Historical Network Performance Statistics
To view statistics gathered over an historical monitoring period:
Step 1
Step 2
Figure 2-10 Statistics Data Filter Window
In this window, specify the time period for which you want to view statistics. You can view statistics for all or part of the time that the data was collected. The window displays the currently defined start date and end date.
Step 3
For more information about changing the date range, see the "Defining a Collector" section.
Step 4
When you turn on popup labels for a graph, you can roll the cursor over a collection point on the graph and see a popup label containing key information for that point, such as the exact latency value.
To turn on popup labels for a graph, select the Show Popup Labels checkbox. To turn off popup labels, clear the checkbox.
Step 5
By default, IPM automatically selects the option that best matches the amount of data currently in the IPM database for the selected collector. For additional information about how IPM gathers and calculates hourly, daily, weekly, and monthly data, see the "Setting IPM Database Preferences" section.
Step 6
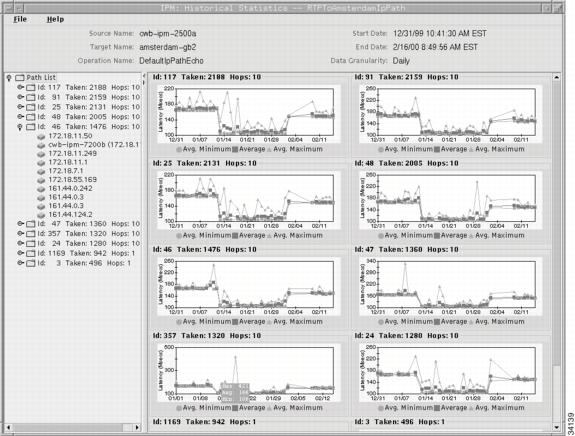
Figure 2-11 Historical Statistics Window—IP Echo Collector
Figure 2-12 Historical Statistics Window—IP Path Echo Collector
Figure 2-13 Historical Statistics Window—Enhanced UDP Collector
Note
Figure 2-14 Historical Statistics Window—Multi-Collector Graph
Table 2-3 describes the actions you can perform in the Historical Statistics window.
Table 2-3 Historical Statistics Window Options
Zoom in on a specific point on the graph.
Press Shift and click a point on the graph.
Zoom in on a specific area of the graph.
Press Shift and drag and click on an area of the graph. Release the mouse button and the graph zooms in on the area you selected.
Zoom out to the graph's original view.
Click anywhere on the graph.
Shift the x-axis or y-axis of the graph through the data.
Press Ctrl and click a point on the graph, then drag left or right to go backward or forward, or drag up or down to shift the x-axis of the graph.
Print or save the graph.
Select File > Print to print or save the graph.
For more information, see the "Printing IPM Statistics" section.
Request an immediate poll of statistics (single-collector graphs only).
Select View > Demand Poll. IPM typically polls a collector once per hour. If you are between polls and do not want to wait until the next polling period, you can use the Demand Poll function to request an immediate poll of the collector. The graphs are updated with the new statistics.
If for some reason the poll fails and new statistics are not collected, the following error message appears.
Demand Poll Failed, make sure router is
available.
Change settings in the Statistics Data Filter window.
Select View > Filter Data to change the time period and granularity of the graphs.
Display statistics for the next time period.
Select View > Next Range. The graphs are updated to reflect the new range.
For more information, see the "Understanding Next Range" section.
Display statistics for the previous time period.
Select View > Prev Range. The graphs are updated to reflect the new range.
For more information, see the "Understanding Previous Range" section.
Hide the legend bar at the bottom of each graph.
Select View > Hide Legend.
Show the legend bar at the bottom of each graph.
Select View > Show Legend.
Show combined statistics in one graph for all paths in the path list, or all hops in a selected path (Path Echo collectors only).
Select Path List, or select a specific path, then select View > Show Combined. A single graph is displayed showing combined statistics for all the paths in the path list (up to 128 paths), or all the hops in the hop list (up to 25 hops) for the selected path. The combined graph shows only average statistics.
If a path has no data available, IPM displays (No Data) for that path in the right side of the window.
If a path never reaches its target, it is an invalid path, and IPM displays (No Target) for that path in the right side of the window.
Show separate statistics in one or more graphs for all paths in the path list, or all hops in a selected path (Path Echo collectors only).
Select Path List, or select a specific path, then select View > Show Separate. Multiple graphs are displayed, one for each path in the path list, or hop in the hop list for the selected path. Each graph shows minimum, maximum, and average statistics.
If a path has no data available, IPM displays No Data Available for that path instead of a graph.
Understanding Next Range
Keep the following points in mind when you select View > Next Range:
•
For example, if the current start time is midnight April 11 and the current end time is midnight April 12, the duration is 24 hours. So the new start time is midnight April 12 and the new end time is midnight April 13.
•
•
•
Could not get operation stats from the server for the given time
range, chart will be empty.
This means there was no statistical data available for the next time period. The IPM server or source router might have been down during that time period, and no statistical data was collected. When you click OK, IPM displays blank graphs for the next time period.
•
No Path List could be found. Forcing a demand poll. Wait a few minutes
and try again.
This means there was no statistical data available for the next time period. The IPM server or source router might have been down during that time period, and no statistical data was collected. When you click OK, IPM still displays graphs for the current time period.
Understanding Previous Range
Keep the following points in mind when you select View > Prev Range:
•
For example, if the current start time is midnight April 11 and the current end time is midnight April 12, the duration is 24 hours. So the new start time is midnight April 10 and the new end time is midnight April 11.
•
•
Could not get operation stats from the server for the given time
range, chart will be empty.
This means there was no statistical data available for the previous time period. The IPM server or source router might have been down during that time period, and no statistical data was collected. When you click OK, IPM displays blank graphs for the previous time period.
Printing IPM Statistics
IPM provides the following printing options for the Real Time Statistics and Historical Statistics windows:
•
•
•
Note
To access the printing options:
Step 1
Step 2
Note
Figure 2-15 Print Dialog Window
Step 3
•
•
•
•
Step 4
Exiting the IPM Client
When you are finished monitoring network performance statistics, you can exit the IPM client by completing the following steps:
Step 1
If you are running IPM as an applet and you exit the Web browser or close the active window, IPM exits but the confirmation window does not appear.
Step 2
Collectors that were still running when you closed the IPM client will continue to run and gather statistics until they reach the end date specified in the collector configuration. Collectors defined to run forever, continue to run and gather statistics until you stop them.
To shut down the IPM servers completely, use the ipm stop command. To stop gathering statistics, stop the collectors before exiting the IPM client. When you stop a collector, the gathered data for that collector is still available for viewing.
Collectors remain in the IPM database until you do one of the following:
•
•