Downloads |
 Feedback Feedback
|
Table Of Contents
Troubleshooting Using the show interfaces serial Command
Serial Lines: show interfaces serial Status Line Conditions
Serial Lines: Increasing Output Drops on Serial Link
Serial Lines: Increasing Input Drops on Serial Link
Serial Lines: Increasing Input Errors in Excess of 1 Percent of Total Interface Traffic
Serial Lines: Troubleshooting Serial Line Input Errors
Serial Lines: Increasing Interface Resets on Serial Link
Serial Lines: Increasing Carrier Transitions Count on Serial Link
Using the show controllers Command
Troubleshooting Clocking Problems
Implementing Hold Queue Limits
Using Priority Queuing to Reduce Bottlenecks
CSU and DSU Local Loopback Tests for HDLC or PPP Links
CSU and DSU Remote Loopback Tests for HDLC or PPP Links
Detailed Information on the show interfaces serial Command
Troubleshooting Using the show controller t1 Command
Is the Controller Administratively Down?
If Receiver Has Loss of Signal
If the Line Is in Loopback Mode
If the Controller Displays Any Alarms
Receive (RX) Alarm Indication Signal (AIS) (Blue)
Receive (Rx) Remote Alarm Indication (Yellow)
Transmitter Sending Remote Alarm (Red)
Transmit (Tx) Remote Alarm Indication (Yellow)
Slip Secs Counter Is Increasing
Framing Loss Seconds Counter Is Increasing
Line Code Violations Are Increasing
Verify that isdn switchtype and pri-group Are Configured Correctly
Verifying the Signaling Channel
Troubleshooting Using the show isdn status Command
Performing Hardware Loopback Plug Test
Performing the Loopback Plug Test
Troubleshooting Using the show controller e1 Command
Troubleshooting E1 Error Events
Verifying That isdn switchtype and pri-group Are Configured Correctly
Verifying the Signaling Channel
Troubleshooting Using the show isdn status Command
Troubleshooting Serial Lines
This chapter presents general troubleshooting information and a discussion of tools and techniques for troubleshooting serial connections. The chapter consists of the following sections:
•
Troubleshooting Using the show interfaces serial Command
•
•
•
•
•
•
•
•
•
Troubleshooting Using the show interfaces serial Command
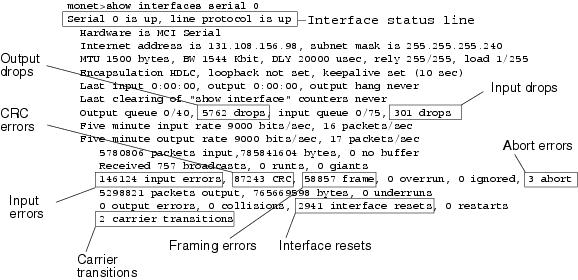
The output of the show interfaces serial exec command displays information specific to serial interfaces. Figure 15-1 shows the output of the show interfaces serial exec command for a High-Level Data Link Control (HDLC) serial interface.
This section describes how to use the show interfaces serial command to diagnose serial line connectivity problems in a wide-area network (WAN) environment. The following sections describe some of the important fields of the command output.
Other fields shown in the display are described in detail in the section "Detailed Information on the show interfaces serial Command," later in this chapter.
Serial Lines: show interfaces serial Status Line Conditions
You can identify five possible problem states in the interface status line of the show interfaces serial display (see Figure 15-1):
•
•
•
•
•
Figure 15-1 Output of the HDLC show interface serial Command
Table 15-1 shows the interface status conditions, possible problems associated with the conditions, and solutions to those problems.
Table 15-1 Serial Lines: show interfaces serial Status Line Conditions
ConditionSerial x is up, line protocol is up
—
This is the proper status line condition. No action is required.
Serial x is down, line protocol is down (DTE1 mode)
The router is not sensing a CD2 signal (that is, the CD is not active).
A telephone company problem has occurred—line is down or is not connected to CSU3 /DSU4 .
Cabling is faulty or incorrect.
Hardware failure has occurred (CSU/DSU).
1.
2.
3.
4.
5.
6.
Serial x is up, line protocol is down (DTE mode)
A local or remote router is misconfigured.
Keepalives are not being sent by the remote router.
A leased-line or other carrier service problem has occurred (noisy line or misconfigured or failed switch).
A timing problem has occurred on the cable (SCTE5 not set on CSU/DSU).
A local or remote CSU/DSU has failed.
Router hardware (local or remote) has failed.
1.
If the line protocol comes up, a telephone company problem or a failed remote router is the likely problem.
2.
3.
4.
Serial x is up, line protocol is down (DTE mode) (continued)
Caution: Because debugging output is assigned high priority in the CPU process, it can render the system unusable. For this reason, use debug commands only to troubleshoot specific problems or during troubleshooting sessions with Cisco technical support staff. Moreover, it is best to use debug commands during periods of lower network traffic and fewer users. Debugging during these periods decreases the likelihood that increased debug command processing overhead will affect system use.
5.
6.
7.
Serial x is up, line protocol is down (DCE6 mode)
The clockrate interface configuration command is missing.
The DTE device does not support or is not set up for SCTE mode (terminal timing).
The remote CSU or DSU has failed.
1.
Syntax:
clock rate bps
Syntax Description:
•
Serial x is up, line protocol is down (DCE mode) (continued)
The clockrate interface configuration command is missing.
The DTE device does not support or is not set up for SCTE mode (terminal timing).
The remote CSU or DSU has failed.
2.
3.
4.
5.
Serial x is up, line protocol is up (looped)
A loop exists in the circuit. The sequence number in the keepalive packet changes to a random number when a loop is initially detected. If the same random number is returned over the link, a loop exists.
1.
2.
3.
4.
5.
Serial x is up, line protocol is down (disabled)
A high error rate has occurred due to a telephone company service problem.
A CSU or DSU hardware problem has occurred.
Router hardware (interface) is bad.
1.
2.
3.
Serial x is administrat-ively down, line protocol is down
The router configuration includes the shutdown interface configuration command.
A duplicate IP address exists.
1.
2.
3.
4.
1 DTE = data terminal equipment
2 CD = carrier detect
3 CSU = channel service unit
4 DSU = digital service unit
5 SCTE = serial clock transmit external
6 DCE = data circuit-terminating equipment or data communications equipment
7 CTS = clear-to-send
8 DSR = data-set ready
Serial Lines: Increasing Output Drops on Serial Link
Output drops appear in the output of the show interfaces serial command (refer to Figure 15-1) when the system is attempting to hand off a packet to a transmit buffer but no buffers are available.
Symptom: Increasing output drops on serial link
Table 15-2 outlines the possible problem that might cause this symptom and describes solutions to that problem.
Table 15-2 Serial Lines: Increasing Output Drops on Serial Link
Input rate to serial interface exceeds bandwidth available on serial link
1.
Input rate to serial interface exceeds bandwidth available on serial link (continued)
2.
3.
4.
Note: Output drops are acceptable under certain conditions. For instance, if a link is known to be overused (with no way to remedy the situation), it is often considered preferable to drop packets than to hold them. This is true for protocols that support flow control and can retransmit data (such as TCP/IP and Novell IPX2 ). However, some protocols, such as DECnet and local-area transport, are sensitive to dropped packets and accommodate retransmission poorly, if at all.
1 SAP = Service Advertising Protocol
2 IPX = Internetwork Packet Exchange
Serial Lines: Increasing Input Drops on Serial Link
Input drops appear in the output of the show interfaces serial exec command (refer to Figure 15-1) when too many packets from that interface are still being processed in the system.
Symptom: Increasing number of input drops on serial link
Table 15-3 outlines the possible problem that might cause this symptom and describes solutions to that problem.
Table 15-3 Serial Lines: Increasing Input Drops on Serial Link
Input rate exceeds the capacity of the router, or input queues exceed the size of output queues
Note: Input drop problems are typically seen when traffic is being routed between faster interfaces (such as Ethernet, Token Ring, and FDDI1 ) and serial interfaces. When traffic is light, there is no problem. As traffic rates increase, backups start occurring. Routers drop packets during these congested periods.
Input rate exceeds the capacity of the router, or input queues exceed the size of output queues (continued)
1.
2.
1 FDDI = Fiber Distributed Data Interface
Serial Lines: Increasing Input Errors in Excess of 1 Percent of Total Interface Traffic
If input errors appear in the show interfaces serial output (refer to Figure 15-1), there are several possible sources of those errors. The most likely sources are summarized in Table 15-4.
Note
Symptom: Increasing number of input errors in excess of 1 percent of total interface traffic
Serial Lines: Troubleshooting Serial Line Input Errors
Table 15-5 describes the various types of input errors displayed by the show interfaces serial command (see Figure 15-1), possible problems that might be causing the errors, and solutions to those problems.
Table 15-5 Serial Lines: Troubleshooting Serial Line Input Errors
(Field Name)CRC errors (CRC)
CRC errors occur when the CRC calculation does not pass (indicating that data is corrupted) for one of the following reasons:
•
•
•
1.
2.
3.
4.
CRC errors (CRC) (continued)
•
•
5.
Framing errors (frame)
A framing error occurs when a packet does not end on an 8-bit byte boundary for one of the following reasons:
•
•
•
•
1.
2.
3.
4.
5.
Aborted transmission (abort)
Aborts indicate an illegal sequence of 1 bit (more than seven in a row)
The following are possible reasons for this to occur:
•
•
•
•
•
•
1.
2.
3.
4.
5.
6.
1 ESF = Extended Superframe Format
2 B8ZS = binary eight-zero substitution
Serial Lines: Increasing Interface Resets on Serial Link
Interface resets that appear in the output of the show interfaces serial exec command (see Figure 15-1) are the result of missed keepalive packets.
Symptom: Increasing interface resets on serial link
Table 15-6 outlines the possible problems that might cause this symptom and describes solutions to those problems.
Serial Lines: Increasing Carrier Transitions Count on Serial Link
Carrier transitions appear in the output of the show interfaces serial exec command whenever there is an interruption in the carrier signal (such as an interface reset at the remote end of a link).
Symptom: Increasing carrier transitions count on serial link
Table 15-7 outlines the possible problems that might cause this symptom and describes solutions to those problems.
Using the show controllers Command
The show controllers exec command is another important diagnostic tool when troubleshooting serial lines. The command syntax varies, depending on platform:
•
•
•
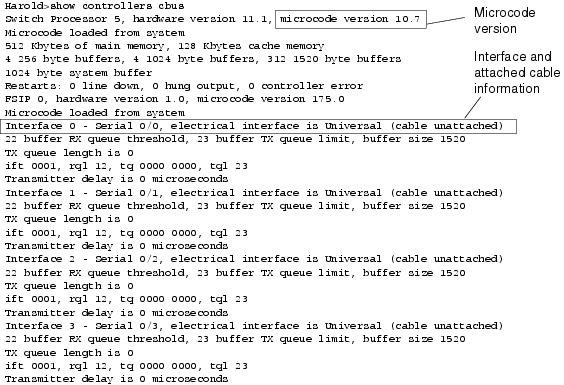
Figure 15-2 shows the output from the show controllers cbus exec command. This command is used on Cisco 7000 series routers with the Fast Serial Interface Processor (FSIP) card. Check the command output to make certain that the cable to the channel service unit/digital service unit (CSU/DSU) is attached to the proper interface. You can also check the microcode version to see whether it is current.
Figure 15-2 show controllers cbus Command Output
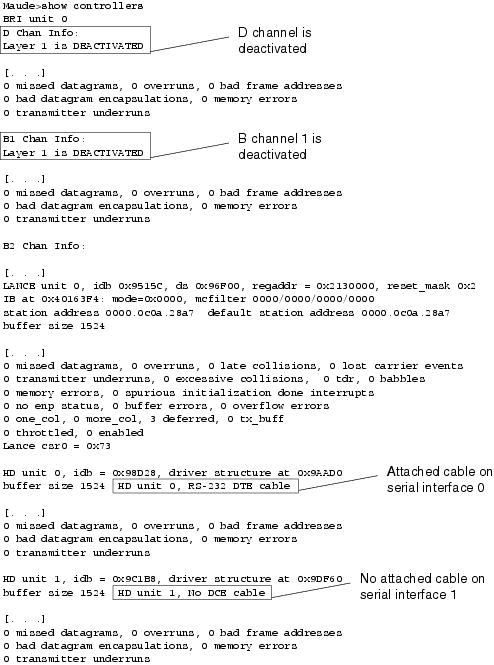
On access products such as the Cisco 2000, Cisco 2500, Cisco 3000, and Cisco 4000 series access servers and routers, use the show controllers exec command. Figure 15-3 shows the show controllers command output from the Basic Rate Interface (BRI) and serial interfaces on a Cisco 2503 access server. (Note that some output is not shown.)
The show controllers output indicates the state of the interface channels and whether a cable is attached to the interface. In Figure 15-3, serial interface 0 has an RS-232 DTE cable attached. Serial interface 1 has no cable attached.
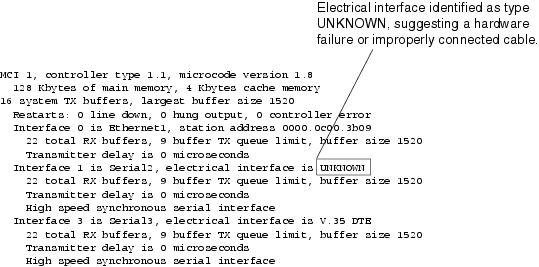
Figure 15-4 shows the output of the show controllers mci command. This command is used on AGS, CGS, and MGS routers only. If the electrical interface is displayed as UNKNOWN (instead of V.35, EIA/TIA-449, or some other electrical interface type), an improperly connected cable is the likely problem. A bad applique or a problem with the internal wiring of the card is also possible. If the electrical interface is unknown, the corresponding display for the show interfaces serial exec command will show that the interface and line protocol are down.
Figure 15-3 show controllers Command Output
Figure 15-4 show controllers mci Command Output
Using debug Commands
The output of the various debug privileged exec commands provides diagnostic information relating to protocol status and network activity for many internetworking events.
Caution
Following are some debug commands that are useful when troubleshooting serial and WAN problems. More information about the function and output of each of these commands is provided in the Debug Command Reference publication:
•
•
•
•
•
•
•
•
•
•
•
Using Extended ping Tests
The ping command is a useful test available on Cisco internetworking devices as well as on many host systems. In TCP/IP, this diagnostic tool is also known as an Internet Control Message Protocol (ICMP) echo request.
Note
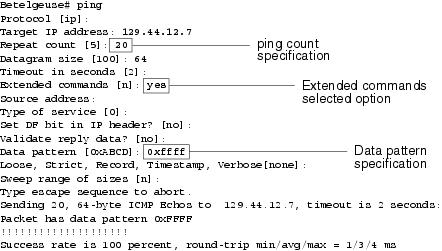
Cisco internetworking devices provide a mechanism to automate the sending of many ping packets in sequence. Figure 15-5 illustrates the menu used to specify extended ping options. This example specifies 20 successive pings. However, when testing the components on your serial line, you should specify a much larger number, such as 1000 pings. Also increase the datagram size to a larger number, such as 1500.
Figure 15-5 Extended ping Specification Menu
In general, perform serial line ping tests as follows:
Step 1
Step 2
Step 3
Assuming that this test sequence was prompted by the appearance of a large number of CRC and framing errors, a clocking problem is likely. Check the CSU or DSU for a timing problem. See the section "Troubleshooting Clocking Problems," next.
Step 4
Step 5
Step 6
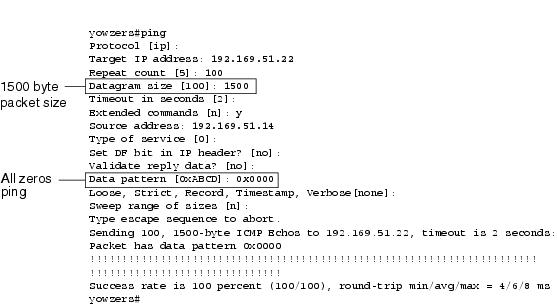
Figure 15-6 All-Zeros 1500-Byte ping Test
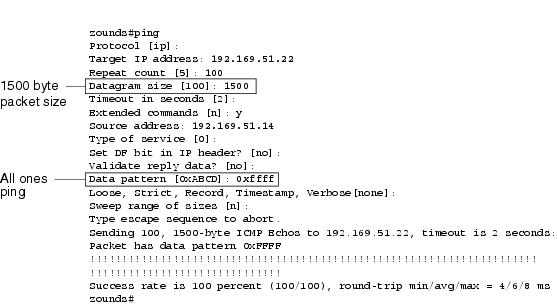
Figure 15-7 All-Ones 1500-Byte ping Test
Troubleshooting Clocking Problems
Clocking conflicts in serial connections can lead either to chronic loss of connection service or to degraded performance. This section discusses the important aspects of clocking problems: clocking problem causes, how to detect clocking problems, how to isolate clocking problems, and clocking problem solutions.
Clocking Overview
The CSU/DSU derives the data clock from the data that passes through it. To recover the clock, the CSU/DSU hardware must receive at least one 1-bit value for every 8 bits of data that pass through it; this is known as ones density. Maintaining ones density allows the hardware to recover the data clock reliably.
Newer T1 implementations commonly use Extended Superframe Format (ESF) framing with binary eight-zero substitution (B8ZS) coding. B8ZS provides a scheme by which a special code is substituted whenever eight consecutive zeros are sent through the serial link. This code is then interpreted at the remote end of the connection. This technique guarantees ones density independent of the data stream.
Older T1 implementations use D4 (also known as Superframe Format [SF]) framing and Alternate Mark Inversion (AMI) coding. AMI does not utilize a coding scheme like B8ZS. This restricts the type of data that can be transmitted because ones density is not maintained independent of the data stream.
Another important element in serial communications is serial clock transmit external (SCTE) terminal timing. SCTE is the clock echoed back from the data terminal equipment (DTE) device (for example, a router) to the data communications equipment (DCE) device (for example, the CSU/DSU).
When the DCE device uses SCTE instead of its internal clock to sample data from the DTE, it can better sample the data without error even if there is a phase shift in the cable between the CSU/DSU and the router. Using SCTE is highly recommended for serial transmissions faster than 64 kbps. If your CSU/DSU does not support SCTE, see the section "Inverting the Transmit Clock," later in this chapter.
Clocking Problem Causes
In general, clocking problems in serial WAN interconnections can be attributed to one of the following causes:
•
•
•
•
•
Detecting Clocking Problems
To detect clocking conflicts on a serial interface, look for input errors as follows:
Step 1
Step 2
Step 3
Step 4
Step 5
Isolating Clocking Problems
After you determine that clocking conflicts are the most likely cause of input errors, use the following procedure to isolate the source of those errors:
Step 1
Step 2
Step 3
If input errors are accumulating on both ends of the connection, clocking of the CSU is the most likely problem.
If only one end is experiencing input errors, there is probably a DSU clocking or cabling problem.
Aborts on one end suggest that the other end is sending bad information or that there is a line problem.
Note
Clocking Problem Solutions
Table 15-8 outlines suggested remedies for clocking problems, based on the source of the problem.
Table 15-8 Serial Lines: Clocking Problems and Solutions
Incorrect CSU configuration
1.
2.
3.
Incorrect DSU configuration
1.
2.
(For any interface that is connected to a line of 128 kbps or faster, SCTE must be enabled. If your DSU does not support SCTE, see the section "Inverting the Transmit Clock," later in this chapter.)
3.
Check with your leased-line provider for information on its framing and coding schemes.
4.
Cable to router out of specification
If the cable is longer than 50 feet (15.24 meters), use a shorter cable.
If the cable is unshielded, replace it with shielded cable.
1 LBO = line build out
Inverting the Transmit Clock
If you are attempting serial connections at speeds greater than 64 kbps with a CSU/DSU that does not support SCTE, you might have to invert the transmit clock on the router. Inverting the transmit clock compensates for phase shifts between the data and clock signals.
The specific command used to invert the transmit clock varies between platforms. On a Cisco 7000 series router, enter the invert-transmit-clock interface configuration command. For Cisco 4000 series routers, use the dte-invert-txc interface configuration command.
To ensure that you are using the correct command syntax for your router, refer to the user guide for your router or access server and to the Cisco IOS configuration guides and command references.
Note
Adjusting Buffers
Excessively high bandwidth utilization greater than 70 percent results in reduced overall performance and can cause intermittent failures. For example, DECnet file transmissions might be failing because of packets being dropped somewhere in the network.
If the situation is bad enough, you must increase the bandwidth of the link. However, increasing the bandwidth might not be necessary or immediately practical. One way to resolve marginal serial line overutilization problems is to control how the router uses data buffers.
Caution
Use one of the following three options to control how buffers are used:
•
•
•
The configuration commands associated with these options are described in the Cisco IOS configuration guides and command references.
The following section focuses on identifying situations in which these options are likely to apply and defining how you can use these options to help resolve connectivity and performance problems in serial/WAN interconnections.
Tuning System Buffers
There are two general buffer types on Cisco routers: hardware buffers and system buffers. Only the system buffers are directly configurable by system administrators. The hardware buffers are specifically used as the receive and transmit buffers associated with each interface and (in the absence of any special configuration) are dynamically managed by the system software itself.
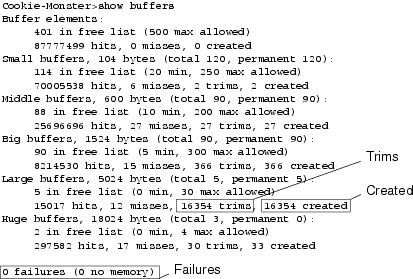
The system buffers are associated with the main system memory and are allocated to different-size memory blocks. A useful command for determining the status of your system buffers is the show buffers exec command. Figure 15-8 shows the output from the show buffers command.
Figure 15-8 show buffers Command Output
In the show buffers output, the following is true:
•
•
•
•
–
–
•
–
–
•
•
•
•
•
•
The show buffers command output in Figure 15-8 indicates high numbers in the Trims and Created fields for large buffers. If you are receiving high numbers in these fields, you can increase your serial link performance by increasing the max free value configured for your system buffers. trims identifies the number of buffers that the RP has trimmed from the pool when the number of buffers in free list exceeded the number of max allowed buffers.
Use the buffers max free number global configuration command to increase the number of free system buffers. The value that you configure should be approximately 150 percent of the figure indicated in the total field of the show buffers command output. Repeat this process until the show buffers output no longer indicates trims and created buffers.
If the show buffers command output shows a large number of failures in the (no memory) field (see the last line of output in Figure 15-8), you must reduce the usage of the system buffers or increase the amount of shared or main memory (physical RAM) on the router. Call your technical support representative for assistance.
Implementing Hold Queue Limits
Hold queues are buffers used by each router interface to store outgoing or incoming packets. Use the hold-queue interface configuration command to increase the number of data packets queued before the router will drop packets. Increase these queues by small increments (for instance, 25 percent) until you no longer see drops in the show interfaces output. The default output hold queue limit is 100 packets.
Note
Use the hold-queue command to prevent packets from being dropped and to improve serial link performance under the following conditions:
•
•
Note
Using Priority Queuing to Reduce Bottlenecks
Priority queuing is a list-based control mechanism that allows traffic to be prioritized on an interface-by-interface basis. Priority queuing involves two steps:
Step 1
Step 2
Both of these steps use versions of the priority-list global configuration command. In addition, further traffic control can be applied by referencing access-list global configuration commands from priority-list specifications. For examples of defining priority lists and for details about command syntax associated with priority queuing, refer to the Cisco IOS configuration guides and command references.
Note
Use priority queuing to prevent packets from being dropped and to improve serial link performance under the following conditions:
•
•
In general, start with the default number of queues when implementing priority queues. After enabling priority queuing, monitor output drops with the show interfaces serial exec command. If you notice that output drops are occurring in the traffic queue that you have specified to be high priority, increase the number of packets that can be queued (using the queue-limit keyword option of the priority-list global configuration command). The default queue-limit arguments are 20 packets for the high-priority queue, 40 for medium, 60 for normal, and 80 for low.
Note
Another tool to relieve congestion when bridging Digital LAT is LAT compression. You can implement LAT compression with the interface configuration command bridge-group group lat-compression.
Special Serial Line Tests
In addition to the basic diagnostic capabilities available on routers, a variety of supplemental tools and techniques can be used to determine the conditions of cables, switching equipment, modems, hosts, and remote internetworking hardware. For more information, consult the documentation for your CSU, DSU, serial analyzer, or other equipment.
CSU and DSU Loopback Tests
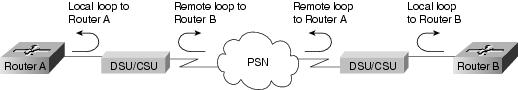
If the output of the show interfaces serial exec command indicates that the serial line is up but the line protocol is down, use the CSU/DSU loopback tests to determine the source of the problem. Perform the local loop test first, and then perform the remote test. Figure 15-9 illustrates the basic topology of the CSU/DSU local and remote loopback tests.
Figure 15-9 CSU/DSU Local and Remote Loopback Tests
Note
CSU and DSU Local Loopback Tests for HDLC or PPP Links
Following is a general procedure for performing loopback tests in conjunction with built-in system diagnostic capabilities:
Step 1
Step 2
Step 3
Step 4
Step 5
Step 6
If the keepalives do not increment, there may be a timing problem on the interface card or on the network. For information on correcting timing problems, refer to the section "Troubleshooting Clocking Problems," earlier in this chapter.
Step 7
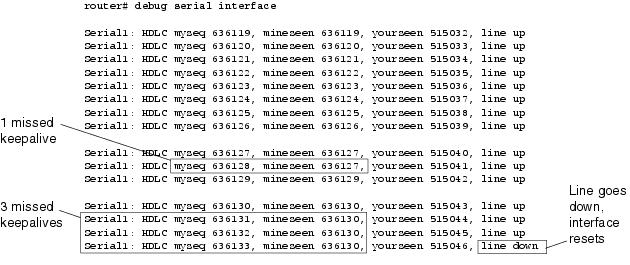
Figure 15-10 shows the output from the debug serial interface command for an HDLC serial connection, with missed keepalives causing the line to go down and the interface to reset.
Figure 15-10 debug serial interface Command Output
CSU and DSU Remote Loopback Tests for HDLC or PPP Links
If you determine that the local hardware is functioning properly, but you still encounter problems when attempting to establish connections over the serial link, try using the remote loopback test to isolate the problem's cause.
Note
The following are the steps required to perform loopback testing:
Step 1
Step 2
Step 3
Step 4
Step 5
Detailed Information on the show interfaces serial Command
This section covers the show interfaces serial command's parameters, syntax description, sample output display, and field descriptions.
show interfaces serial
To display information about a serial interface, use the show interfaces serial privileged exec command:
show interfaces serial [number] [accounting]
show interfaces serial [number [:channel-group] [accounting] (Cisco 4000 series)
show interfaces serial [slot | port [:channel-group]] [accounting] (Cisco 7500 series)
show interfaces serial [type slot | port-adapter | port] [serial] (ports on VIP cards in the Cisco 7500 series)
show interfaces serial [type slot | port-adapter | port] [:t1-channel] [accounting | crb] (CT3IP in Cisco 7500 series)
Syntax Description
•
•
•
•
•
•
•
T1 channels on the CT3IP are numbered 1 to 28 rather than the more traditional zero-based scheme (0 to 27) used with other Cisco products. This is to ensure consistency with telco numbering schemes for T1 channels within channelized T3 equipment.
•
Command Mode
Privileged exec
Usage Guidelines
This command first appeared in Cisco IOS Release 10.0 for the Cisco 4000 series. It first appeared in Cisco IOS Release 11.0 for the Cisco 7000 series, and it was modified in Cisco IOS Release 11.3 to include the CT3IP.
Sample Displays
The following is sample output from the show interfaces command for a synchronous serial interface:
Router# show interfaces serialSerial 0 is up, line protocol is upHardware is MCI SerialInternet address is 150.136.190.203, subnet mask is 255.255.255.0MTU 1500 bytes, BW 1544 Kbit, DLY 20000 usec, rely 255/255, load 1/255Encapsulation HDLC, loopback not set, keepalive set (10 sec)Last input 0:00:07, output 0:00:00, output hang neverOutput queue 0/40, 0 drops; input queue 0/75, 0 dropsFive minute input rate 0 bits/sec, 0 packets/secFive minute output rate 0 bits/sec, 0 packets/sec16263 packets input, 1347238 bytes, 0 no bufferReceived 13983 broadcasts, 0 runts, 0 giants2 input errors, 0 CRC, 0 frame, 0 overrun, 0 ignored, 2 abort1 carrier transitions22146 packets output, 2383680 bytes, 0 underruns0 output errors, 0 collisions, 2 interface resets, 0 restartsTable 15-9 describes significant fields shown in the output.
Troubleshooting T1 Problems
This section describes the techniques and procedures to troubleshoot T1 circuits for dial-in customers.
Troubleshooting Using the show controller t1 Command
The show controller t1 exec command provides information to logically troubleshoot physical layer and data link layer problems. This section describes how to logically troubleshoot using the show controller t1 command.
This command displays the controller status that is specific to the controller hardware. The information displayed is generally useful for diagnostic tasks performed by technical support personnel.
The NPM or MIP can query the port adapters to determine their current status. Issue a show controller t1 command to display statistics about the T1 link.
If you specify a slot and port number, statistics for each 15-minute period will be displayed.
Most T1 errors are caused by misconfigured lines. Ensure that linecoding, framing, and clock source are configured according to what the service provider recommends.
show controller t1 Conditions
The t1 controller can be in three states:
•
•
•
Is the Controller Administratively Down?
The controller is administratively down when it has been manually shut down. You should restart the controller to correct this error.
Step 1
maui-nas-03>enPassword:maui-nas-03#Step 2
maui-nas-03#configure terminalEnter configuration commands, one per line. End with CNTL/Z.maui-nas-03(config)#Step 3
maui-nas-03(config)#controller t1 0maui-nas-03(config-controlle)#Step 4
maui-nas-03(config-controlle)#shutdownmaui-nas-03(config-controlle)#no shutdownIs the Line Up?
If the T1 controller and line are not up, check to see if you are seeing one of the following messages in the show controller t1 exec output:
Receiver has loss of frame.
or
Receiver has loss of signal.
If Receiver Has Loss of Frame
Step 1
To change the framing format, use the framing {SF | ESF} command in the controller configuration mode, as shown here:
maui-nas-03#configure terminalEnter configuration commands, one per line. End with CNTL/Z.maui-nas-03(config)#controller t1 0maui-nas-03(config-controlle)#framing esfStep 2
Step 3
Line build out (LBO) compensates for the loss in decibels based on the distance from the device to the first repeater in the circuit. A longer distance from the device to the repeater requires that the signal strength on the circuit be boosted to compensate for loss over that distance.
To configure transmit and receive levels for a cable length (line build out) longer than 655 feet for a T1 trunk with a channel service unit (CSU) interface, use the cablelength long controller configuration command. To configure transmit attenuation for a cable length (line build out) of 655 feet or shorter for a T1 trunk with a DSX-1 interface, use the cablelength short controller configuration command.
Consult your service provider and the Cisco IOS command reference for details on buildout settings.
If this does not fix the problem, proceed to the next section.
If Receiver Has Loss of Signal
Step 1
Step 2
Step 3
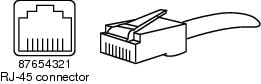
The pins on an RJ-48 jack are numbered from 1 through 8. Pin 1 is the leftmost pin when looking at the jack with the metal pins facing you. Refer to Figure 15-11.
Figure 15-11 RJ-45 Cable
Step 4
Run the show controller t1 exec command after each step to see whether the controller exhibits any errors.
If the Line Is in Loopback Mode
Check to see whether the line is in loopback mode from the show controller t1 output. A line should be in loopback mode only for testing purposes.
To turn off loopback, use the no loopback command in the controller configuration mode, as shown here:
maui-nas-03(config-controlle)#no loopback
If the Controller Displays Any Alarms
Check the show controller command output to see if there are alarms displayed by the controller.
We will now discuss various alarms and the procedure necessary to correct them.
Receive (RX) Alarm Indication Signal (AIS) (Blue)
A received alarm indication signal (AIS) means that an alarm is occurring on the line upstream of the equipment connected to the port. The AIS failure is declared when an AIS defect is detected at the input and still exists after the loss of frame failure is declared (caused by the unframed nature of the "all-ones" signal). The AIS failure is cleared when the loss of frame failure is cleared.
Step 1
Step 2
Receive (Rx) Remote Alarm Indication (Yellow)
A received remote alarm indication means that the far-end equipment has a problem with the signal that it is receiving from its upstream equipment.
For SF links, the far-end alarm failure is declared when bit 6 of all the channels has been zero for at least 335 ms. The failure is cleared when bit 6 of at least one channel is not zero for a period usually less than 1 second and always less than 5 seconds. The far-end alarm failure is not declared for SF links when a loss of signal is detected.
For ESF links, the far-end alarm failure is declared if the yellow alarm signal pattern occurs in at least seven out of ten contiguous 16-bit pattern intervals. The failure is cleared if the yellow alarm signal pattern does not occur in ten contiguous 16-bit signal pattern intervals.
Step 1
Step 2
•
•
•
Step 3
Step 4
Step 5
Step 6
•
•
If the problem persists, then do the following:
•
•
•
Transmitter Sending Remote Alarm (Red)
A red alarm is declared when the CSU cannot synchronize with the framing pattern on the T1 line.
Step 1
Step 2
Step 3
Transmit (Tx) Remote Alarm Indication (Yellow)
A transmitted remote alarm indication at the interface indicates that the interface has a problem with the signal it is receiving from the far-end equipment.
Step 1
Step 2
Troubleshoot that condition to resolve the Tx RAI.
Transmit (Tx) AIS (Blue)
Step 1
Step 2
Step 3
If the problem persists, then do the following:
•
•
•
Troubleshooting Error Events
The show controller t1 exec command provides error messages that can be used to troubleshoot problems. We will now discuss several error messages and how to correct the errors.
To see whether the error counters are increasing, execute the show controller t1 command repeatedly. Note the values of the counters for the current interval.
Consult your service provider for framing and linecoding settings. A good rule of thumb is to use B8ZS linecoding with ESF framing and AMI linecoding with SF framing.
Slip Secs Counter Is Increasing
The presence of slips on a T1 line indicates a clocking problem. The T1 provider (telco) will provide the clocking that the customer premises equipment (CPE) will need to synchronize to.
Step 1
Note: If there are multiple T1s into an access server, only one can be the primary, while the other T1s derive the clock from the primary. In that case, verify that the T1 line designated as the primary clock source is configured correctly.
Step 2
maui-nas-03(config-controlle)#clock source line primaryFraming Loss Seconds Counter Is Increasing
Step 1
Step 2
maui-nas-03(config-controlle)#framing esfStep 3
Consult your service provider and the Cisco IOS command reference for details on buildout settings.
Line Code Violations Are Increasing
Step 1
Step 2
maui-nas-03(config-controlle)#linecode b8zsStep 3
Consult your service provider and the Cisco IOS command reference for details on buildout settings.
Verify that isdn switchtype and pri-group Are Configured Correctly
Use the show running-config command to check if isdn switchtype and pri-group timeslots are configured correctly. Contact your service provider for correct values.
To change the isdn switchtype and pri-group, enter these lines:
maui-nas-03#configure terminal
maui-nas-03(config)#isdn switch-type primary-5ess
maui-nas-03(config)#controller t1 0
maui-nas-03(config-controlle)#pri-group timeslots 1-24
Verifying the Signaling Channel
If the error counters do not increase but the problem persists, verify that the signaling channel is up and configured correctly.
Step 1
Step 2
maui-nas-03#config terminalEnter configuration commands, one per line. End with CNTL/Z.maui-nas-03(config)#interface serial 0:23maui-nas-03(config-if)#no shutdownStep 3
maui-nas-03(config-if)#encapsulation pppStep 4
maui-nas-03(config-if)#no loopbackStep 5
Step 6
Troubleshooting a PRI
Whenever troubleshooting a PRI, you need to check whether the T1 is running cleanly on both ends. If Layer 1 problems have been resolved, as described previously, we must look to Layer 2 and 3 problems.
Troubleshooting Using the show isdn status Command
The show isdn status command is used to display a snapshot of all ISDN interfaces. It displays the status of Layers 1, 2, and 3.
Step 1
The Layer 1 status should always say ACTIVE unless the T1 is down.
If show isdn status indicates that Layer 1 is DEACTIVATED, then there is a problem with the physical connectivity on the T1 line. Refer to the previous section "Is the Controller Administratively Down?"
Also verify that the T1 is not administratively down. Use the no shutdown command to bring up the T1 controller.
Step 2
The desired Layer 2 State is MULTIPLE_FRAME_ESTABLISHED, which indicates that we are exchanging Layer 2 frames and have finished Layer 2 initialization.
If Layer 2 is not MULTIPLE_FRAME_ESTABLISHED, use the show controller t1 exec command to diagnose the problem. Refer to the section "Troubleshooting Using the show controller t1 Command."
Because show isdn status is a snapshot of the current status, it is possible that Layer 2 is bouncing up and down despite indicating MULTIPLE_FRAME_ESTABLISHED. Use debug isdn q921 to verify that Layer 2 is stable.
Using debug q921
The debug isdn q921 command displays data link layer (Layer 2) access procedures that are taking place at the router on the D-channel.
Ensure that you are configured to view debug messages by using the logging console or terminal monitor command as necessary.
Note
Note
Step 1
Mar 20 10:06:07.882: %ISDN-6-LAYER2DOWN: Layer 2 for Interface Se0:23, TEI 0 changed
to down
Mar 20 10:06:09.882: %LINK-3-UPDOWN: Interface Serial0:23, changed state to downMar 20 10:06:21.274: %DSX1-6-CLOCK_CHANGE: Controller 0 clock is now selected as clock sourceMar 20 10:06:21.702: %ISDN-6-LAYER2UP: Layer 2 for Interface Se0:23, TEI 0 changed to upMar 20 10:06:22.494: %CONTROLLER-5-UPDOWN: Controller T1 0, changed state to upMar 20 10:06:24.494: %LINK-3-UPDOWN: Interface Serial0:23, changed state to upIf Layer 2 does not appear to be stable, refer to the section "Troubleshooting Error Events."
Step 2
Mar 20 10:06:52.505: ISDN Se0:23: TX -> RRf sapi = 0 tei = 0 nr = 0Mar 20 10:06:52.505: ISDN Se0:23: RX <- RRf sapi = 0 tei = 0 nr = 0Mar 20 10:07:22.505: ISDN Se0:23: TX -> RRp sapi = 0 tei = 0 nr = 0Mar 20 10:07:22.509: ISDN Se0:23: RX <- RRp sapi = 0 tei = 0 nr = 0Mar 20 10:07:22.509: ISDN Se0:23: TX -> RRf sapi = 0 tei = 0 nr = 0Mar 20 10:07:22.509: ISDN Se0:23: RX <- RRf sapi = 0 tei = 0 nr = 0Step 3
Mar 20 10:06:21.702: ISDN Se0:23: RX <- SABMEp sapi = 0 tei = 0Mar 20 10:06:22.494: ISDN Se0:23: TX -> SABMEp sapi = 0 tei = 0If you are seeing SABME messages, do the following:
•
•
maui-nas-03#configure terminalmaui-nas-03(config)#isdn switch-type primary-5essmaui-nas-03(config)#controller t1 0maui-nas-03(config-controlle)#pri-group timeslots 1-24Step 4
If the D-channel is not up, then use no shutdown command to bring it up:
maui-nas-03(config)#interface serial 0:23maui-nas-03(config-if)#no shutdownStep 5
maui-nas-03(config-if)#encapsulation pppStep 6
maui-nas-03(config-if)#no loopbackStep 7
Step 8
Performing Hardware Loopback Plug Test
The hardware loopback plug test can be used to test whether the router has any faults. If a router passes a hardware loopback plug test, then the problem exists elsewhere on the line.
To create a loopback plug, follow these steps:
Step 1
Step 2
Step 3
Step 4
Leave the rest of the wires alone.
The pins on an RJ-45/48 jack are numbered from 1 through 8. Pin 1 is the left-most pin when looking at the jack with the metal pins facing you.
Performing the Loopback Plug Test
Step 1
Step 2
maui-nas-03#write memoryBuilding configuration...[OK]Step 3
maui-nas-03#config terminalEnter configuration commands, one per line. End with CNTL/Z.maui-nas-03(config)#interface serial 0maui-nas-03(config-if)#encmaui-nas-03(config-if)#encapsulation HDLCmaui-nas-03(config-if)#^ZStep 4
If the interface does not have an IP address, obtain a unique address and assign it to the interface with a subnet mask of 255.255.255.0
maui-nas-03(config)#ip address 172.22.53.1 255.255.255.0Step 5
maui-nas-03#clear countersClear "show interface" counters on all interfaces [confirm]maui-nas-03#Step 6
Troubleshooting E1 Problems
This section describes the techniques and procedures to troubleshoot E1 circuits for dial-in customers.
Troubleshooting Using the show controller e1 Command
The show e1 controller exec command provides information to logically troubleshoot physical layer and data link layer problems. This section describes how to logically troubleshoot using the show controller e1 command.
This command displays the controller status that is specific to the controller hardware. The information displayed is generally useful for diagnostic tasks performed by technical support personnel only.
The NPM or MIP can query the port adapters to determine their current status. Issue a show controller e1 command to display statistics about the E1 link.
If you specify a slot and port number, statistics for each 15-minute period will be displayed.
Most E1 errors are caused by misconfigured lines. Ensure that linecoding, framing, clock source, and line termination (balanced or unbalanced) are configured according to what the service provider recommended.
Show controller e1 Conditions
The E1 controller can be in three states:
•
•
•
Is the Controller Administratively Down?
The controller is administratively down when it has been manually shut down. You should restart the controller to correct this error.
Step 1
maui-nas-03>enPassword:maui-nas-03#Step 2
maui-nas-03#configure terminalEnter configuration commands, one per line. End with CNTL/Z.maui-nas-03(config)#Step 3
maui-nas-03(config)#controller e1 0maui-nas-03(config-controlle)#Step 4
maui-nas-03(config-controlle)#shutdownmaui-nas-03(config-controlle)#no shutdownIs the Line Up?
If the E1 line is not up, check to see that the line configuration is correct and matches the settings of the remote end.
Check the framing of the line and the remote end. For E1 lines, the framing is either CRC4 or noCRC4.
Check the linecoding of the line and the remote end. The linecoding is either AMI or HDB3.
Check whether the line termination is set for balanced or unbalanced (75 ohm or 120 ohm).
Consult your service provider for more information regarding the correct settings. Make any changes as necessary to both local or remote end devices.
If the E1 controller and line are not up, check to see whether you are seeing one of the following messages in the show controller e1 exec output:
Receiver has loss of frame.
or
Receiver has loss of signal.
If Receiver Has Loss of Frame
Step 1
To change the framing format, use the framing {CRC4 | no CRC4} command in the controller configuration mode, as shown here:
maui-nas-03#configure terminalEnter configuration commands, one per line. End with CNTL/Z.maui-nas-03(config)#controller E1 0maui-nas-03(config-controlle)#framing CRC4Step 2
If this does not fix the problem, proceed to the receiver has loss of signal section below.
Step 3
Step 4
If Receiver Has Loss of Signal
Step 1
Step 2
Step 3
The pins on a RJ-48 jack are numbered from 1 through 8. Pin 1 is the leftmost pin when looking at the jack with the metal pins facing you. Refer to Figure 15-12 for more information.
Figure 15-12 RJ-45 Cable
Step 4
Step 5
Run the show controller e1 exec command after each step to check whether the controller exhibits any errors.
If the Line Is in Loopback Mode
Check to see whether the line is in loopback mode from the show controller e1 output. A line should be in loopback mode only for testing purposes.
To turn off loopback, use the no loopback command in the controller configuration mode, as shown here:
maui-nas-03(config-controlle)#no loopback
If the Controller Displays Any Alarms
Check the show controller command output to see whether any alarms are displayed by the controller.
We will now discuss various alarms and the procedure necessary to correct them.
Receiver (Rx) Has Remote Alarm
A received remote alarm means that an alarm is occurring on the line upstream of the equipment connected to the port.
Step 1
Step 2
Step 3
Step 4
•
•
•
Step 5
Step 6
Step 7
Step 8
•
•
If the problem persists, then do the following:
•
•
•
Transmitter Sending Remote Alarm (Red)
A red alarm is declared when the CSU cannot synchronize with the framing pattern on the E1 line.
Step 1
Step 2
Step 3
Step 4
•
•
Step 5
•
•
If the problem persists, then do the following:
•
•
•
•
Troubleshooting E1 Error Events
The show controller e1 exec command provides error messages that can be used to troubleshoot problems. We will now discuss several error messages and how to correct the errors.
To see whether the error counters are increasing, execute the show controller e1 command repeatedly. Note the values of the counters for the current interval.
Consult your service provider for framing and linecoding settings.
Slip Secs Counter Is Increasing
The presence of slips on E1 lines indicates a clocking problem. The E1 provider (telco) will provide the clocking that the customer premises equipment (CPE) will need to synchronize to.
Step 1
Note
Step 2
maui-nas-03(config-controlle)#clock source line primary
Framing Loss Seconds Counter Is Increasing
Step 1
Step 2
maui-nas-03(config-controlle)#framing crc4
Line Code Violations Are Increasing
Step 1
Step 2
maui-nas-03(config-controlle)#linecode amiVerifying That isdn switchtype and pri-group Are Configured Correctly
Use the show running-config command to check whether isdn switchtype and pri-group timeslots are configured correctly. Contact your service provider for correct values.
To change the isdn switchtype and pri-group, use these lines:
maui-nas-03#configure terminal
maui-nas-03(config)#isdn switch-type primary-net5
maui-nas-03(config)#controller e1 0
maui-nas-03(config-controlle)#pri-group timeslots 1-31
Verifying the Signaling Channel
If the error counters do not increase but the problem persists, verify that the signaling channel is up and configured correctly.
Step 1
Step 2
maui-nas-03#config terminalEnter configuration commands, one per line. End with CNTL/Z.maui-nas-03(config)#interface serial 0:15maui-nas-03(config-if)#no shutdownStep 3
maui-nas-03(config-if)#encapsulation pppStep 4
maui-nas-03(config-if)#no loopbackStep 5
Step 6
Troubleshooting a PRI
Whenever troubleshooting a PRI, you need to check whether the E1 is running cleanly on both ends. If Layer 1 problems have been resolved, as described previously, we must look to Layer 2 and 3 problems.
Troubleshooting Using the show isdn status Command
The show isdn status command is used to display a snapshot of all ISDN interfaces. It displays the status of Layers 1, 2, and 3.
Step 1
The Layer 1 status should always say ACTIVE unless the E1 is down.
If show isdn status indicates that Layer 1 is DEACTIVATED, then there is a problem with the physical connectivity on the E1 line. Refer to the section "Is the Controller Administratively Down?"
Also verify that the E1 is not administratively down. Use the no shutdown command to bring up the E1 controller.
Step 2
The desired Layer 2 state is MULTIPLE_FRAME_ESTABLISHED, which indicates that the startup protocol between ISDN switch and end device has been established and that we are exchanging Layer 2 frames.
If Layer 2 is not MULTIPLE_FRAME_ESTABLISHED, use the show controller E1 exec command to diagnose the problem. Refer to the previous section "Troubleshooting Using the show controller e1 Command," and the upcoming section "Troubleshooting E1 Error Events."
Because show isdn status is a snapshot of the current status, it is possible that Layer 2 is bouncing up and down despite indicating Mulitple_Frame_Established. Use debug isdn q921 to verify that Layer 2 is stable.
Using debug q921
The debug isdn q921 command displays data link layer (Layer 2) access procedures that are taking place at the router on the D-channel.
Ensure that you are configured to view debug messages by using the logging console or terminal monitor commands, as necessary.
Note
Note
Step 1
Mar 20 10:06:07.882: %ISDN-6-LAYER2DOWN: Layer 2 for Interface Se0:15, TEI 0 changed
to down
Mar 20 10:06:09.882: %LINK-3-UPDOWN: Interface Serial0:15, changed state to downMar 20 10:06:21.274: %DSX1-6-CLOCK_CHANGE: Controller 0 clock is now selected as clock sourceMar 20 10:06:21.702: %ISDN-6-LAYER2UP: Layer 2 for Interface Se0:15, TEI 0 changed to upMar 20 10:06:22.494: %CONTROLLER-5-UPDOWN: Controller E1 0, changed state to upMar 20 10:06:24.494: %LINK-3-UPDOWN: Interface Serial0:15, changed state to upIf Layer 2 does not appear to be stable refer to the "Troubleshooting Error Events" section, earlier in this chapter.
Step 2
Mar 20 10:06:52.505: ISDN Se0:15: TX -> RRf sapi = 0 tei = 0 nr = 0Mar 20 10:06:52.505: ISDN Se0:15: RX <- RRf sapi = 0 tei = 0 nr = 0Mar 20 10:07:22.505: ISDN Se0:15: TX -> RRp sapi = 0 tei = 0 nr = 0Mar 20 10:07:22.509: ISDN Se0:15: RX <- RRp sapi = 0 tei = 0 nr = 0Mar 20 10:07:22.509: ISDN Se0:15: TX -> RRf sapi = 0 tei = 0 nr = 0Mar 20 10:07:22.509: ISDN Se0:15: RX <- RRf sapi = 0 tei = 0 nr = 0Step 3
Mar 20 10:06:21.702: ISDN Se0:15: RX <- SABMEp sapi = 0 tei = 0Mar 20 10:06:22.494: ISDN Se0:15: TX -> SABMEp sapi = 0 tei = 0If you are seeing SABME messages, do the following:
•
•
maui-nas-03#configure terminalmaui-nas-03(config)#isdn switch-type primary-net5maui-nas-03(config)#controller e1 0maui-nas-03(config-controlle)#pri-group timeslots 1-31Step 4
If the D-channel is not up, then use no shutdown command to bring it up:
maui-nas-03(config)#interface serial 0:15maui-nas-03(config-if)#no shutdownStep 5
maui-nas-03(config-if)#encapsulation pppStep 6
maui-nas-03(config-if)#no loopbackStep 7
Step 8