Cisco CMX Analytics Configuration Guide, Release 8.0
Bias-Free Language
The documentation set for this product strives to use bias-free language. For the purposes of this documentation set, bias-free is defined as language that does not imply discrimination based on age, disability, gender, racial identity, ethnic identity, sexual orientation, socioeconomic status, and intersectionality. Exceptions may be present in the documentation due to language that is hardcoded in the user interfaces of the product software, language used based on RFP documentation, or language that is used by a referenced third-party product. Learn more about how Cisco is using Inclusive Language.
- Updated:
- August 18, 2014
Chapter: Chapter 7, Reports
Reports
The CMX analytics provides different reports to understand and monitor the behavior patterns of devices within a particular venue.
The analytics reporting facility provides a more regular and manager-oriented set of information through the provision of parameterized templates to measure various common trends and patterns that occur over a period of time in a particular zone.
The time window for reports is typically longer for Analytics. Reports operates off an aggregated databased which is considerably smaller than the full analytics database, which is restricted by default to 8 million points. For this reason you may likely to see less history available for Analytics than for Reporting.

Note![]() The data in the dashboard tab is filtered to include devices that were seen for more than 5 minutes and less than 10 hours. To change these dwell time parameters, goto Settings > Presence Analytics > Threshold settings menu.
The data in the dashboard tab is filtered to include devices that were seen for more than 5 minutes and less than 10 hours. To change these dwell time parameters, goto Settings > Presence Analytics > Threshold settings menu.
Note![]() The available parameters for the reports are self-configurable. Hence while choosing a data or time, the other options may be restricted. This is to ensure that around 30-40 data points are displayed along the X-axis and ensuring clarity.
The available parameters for the reports are self-configurable. Hence while choosing a data or time, the other options may be restricted. This is to ensure that around 30-40 data points are displayed along the X-axis and ensuring clarity.
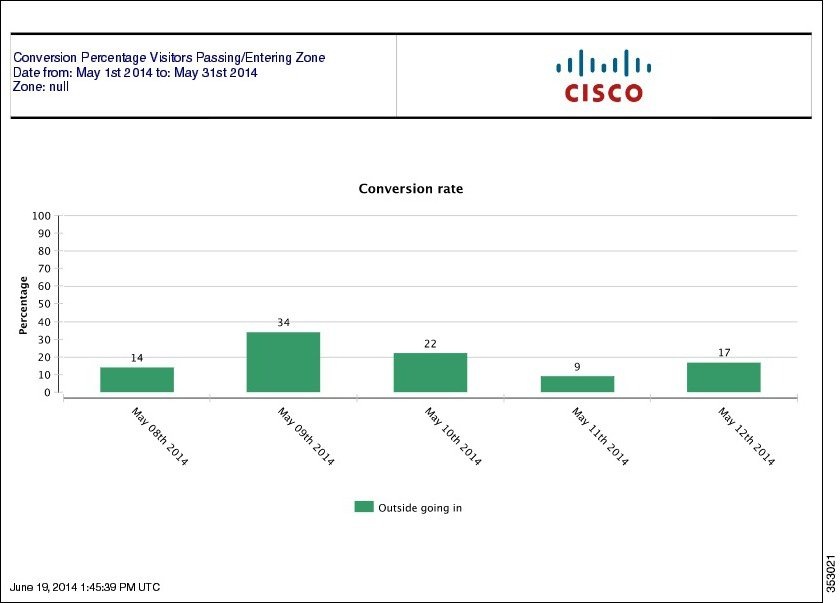
Conversion Percentage
This report shows the percentage of people who visited a target zone/site that were also seen in the surrounding zone. This indicates how many people who were in the vicinity actually entered the target zone/site.
For example, in case of a shop, the report shows percentage of people seen outside the shop before entering the shop.
See the Configuring Conversion Percentage for more information.
Configuring Conversion Percentage
Note![]() You can run this report for location and presence enabled site.
You can run this report for location and presence enabled site.
To run the conversion percentage report, follow these steps:
Step 1![]() On the CMX Analytics main page, click Reports.
On the CMX Analytics main page, click Reports.
Step 2![]() From the Report Type drop-down list, choose Conversion Percentage.
From the Report Type drop-down list, choose Conversion Percentage.
Step 3![]() Choose either zone or site from What percentage visited drop-down list:
Choose either zone or site from What percentage visited drop-down list:
- To run this report on location zones, you must set up two zones. The first is the focus zone where people enter and the second is the catchment zone, that contain potential visitors.
- To run this report on presence sites, you need to select only one presence site.
- Configure the following in the Date/Time Selection group box:
–![]() Click the calendar icon to choose the start date and end date or choose a preset value from the Select from a Preset drop-down list. The presets available are Yesterday, Last Week, and
Click the calendar icon to choose the start date and end date or choose a preset value from the Select from a Preset drop-down list. The presets available are Yesterday, Last Week, and
Last Month.
–![]() Click the time icon to choose the time, hour, and minute or choose a preset value from the Select from a Preset drop-down list. The presets available are All day, Business hours, Morning, Lunch Time, Afternoon, and Evening.
Click the time icon to choose the time, hour, and minute or choose a preset value from the Select from a Preset drop-down list. The presets available are All day, Business hours, Morning, Lunch Time, Afternoon, and Evening.
The PDF of the report shows the percentage of visitors passing or entering the focus zone/site over a number of days in the right pane.
Note![]() Use the zoom controls at the top of the report to enlarge, or decrease the size of the report view. Click Download icon at the right corner to save the report.
Use the zoom controls at the top of the report to enlarge, or decrease the size of the report view. Click Download icon at the right corner to save the report.
Figure 7-1 Conversion Percentage Report
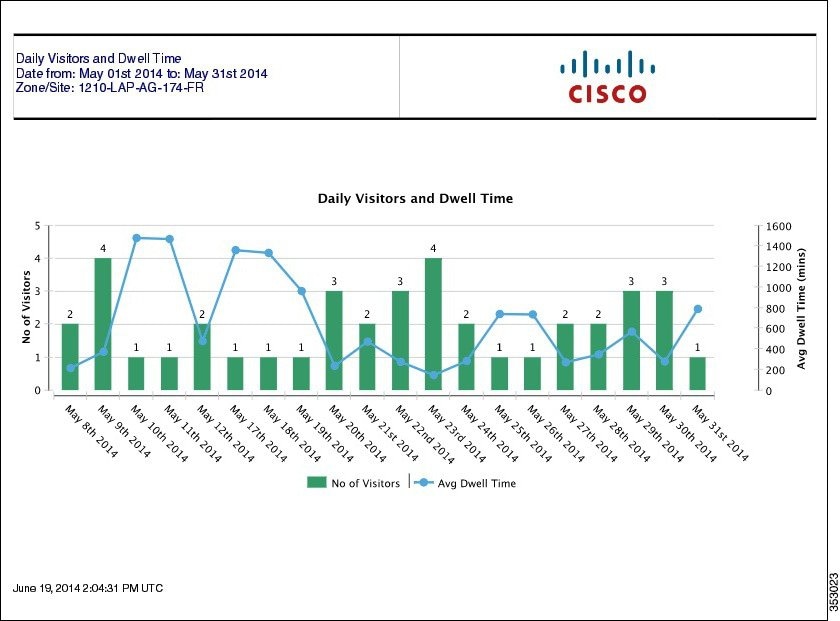
Daily Visitors and Dwell Time
This report compares the number of devices in several dwell time categories for the same time window over a number of days in the target zone/site. See the Configuring Daily Visitors and Dwell Times for more information.
Configuring Daily Visitors and Dwell Times
Note![]() You can run this report for location enabled zones and presence enabled site.
You can run this report for location enabled zones and presence enabled site.
To run the daily visitors and dwell time report, follow these steps:
Step 1![]() On the CMX Analytics home page, click Reports.
On the CMX Analytics home page, click Reports.
Step 2![]() From the Report Type drop-down list, choose Daily Visitors and Dwell Time.
From the Report Type drop-down list, choose Daily Visitors and Dwell Time.
Step 3![]() To run this report on location zones, choose the zone that you want to reference as a zone of interest.
To run this report on location zones, choose the zone that you want to reference as a zone of interest.
Step 4![]() To run this report on presence sites, choose a presence site.
To run this report on presence sites, choose a presence site.
Step 5![]() Configure the following in the Date/Time Selection group box:
Configure the following in the Date/Time Selection group box:
- Click the calendar icon to choose the start date and end date or choose a preset value from the Select from a Preset drop-down list. The presets available are Yesterday, Last Week, and
Last Month.
The report shows both the number of devices and the average time spent in a zone/site across several days.
Figure 7-2 Daily Visitors and Dwell Times Report
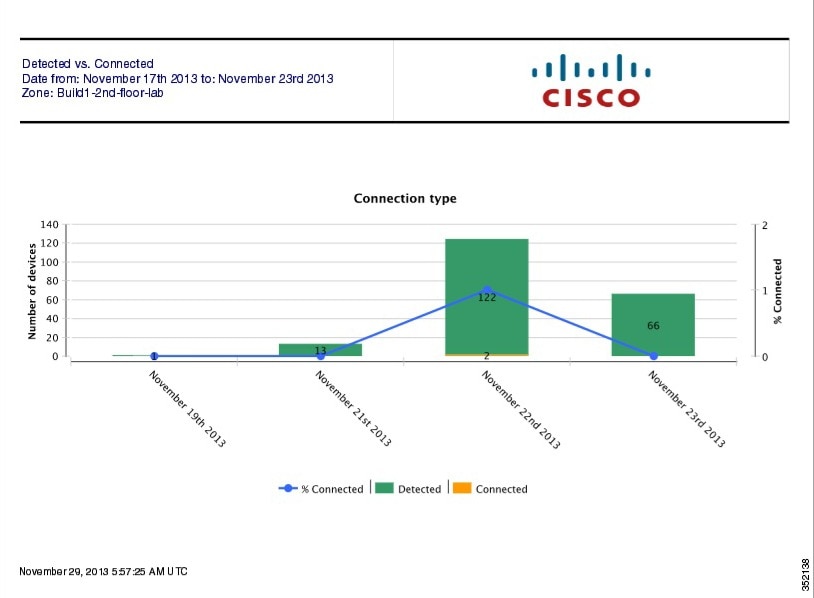
Detected vs. Connected Devices
This report shows an overview of the number of devices that were connected to the network and the devices that were merely probing during a given time period for a particular zone.
See the Configuring Detected vs. Connected Devices on the Selected Zone for more information.
Configuring Detected vs. Connected Devices on the Selected Zone
Note![]() You cannot run this report for presence enabled site.
You cannot run this report for presence enabled site.
To run the detected vs. connected devices report on the selected zone, follow these steps:
Step 1![]() On the CMX Analytics home page, click Reports.
On the CMX Analytics home page, click Reports.
Step 2![]() From the Report Type drop-down list, choose Detected vs. Connected Devices.
From the Report Type drop-down list, choose Detected vs. Connected Devices.
–![]() Click the calendar icon to choose the start date and end date or choose a preset value from the Select from a Preset drop-down list. The presets available are Yesterday, Last Week, and
Click the calendar icon to choose the start date and end date or choose a preset value from the Select from a Preset drop-down list. The presets available are Yesterday, Last Week, and
Last Month.
–![]() Click the time icon to choose the time, hour, and minute or choose a preset value from the Select from a Preset drop-down list. The presets available are All day, Business hours, Morning, Lunch Time, Afternoon, and Evening.
Click the time icon to choose the time, hour, and minute or choose a preset value from the Select from a Preset drop-down list. The presets available are All day, Business hours, Morning, Lunch Time, Afternoon, and Evening.
The report shows the associated versus probing devices for a selected zone.
The result of this report contains the following:
- A chart displaying the associated, detected, and connected devices in the selected area over a time period.
- An image showing the distribution of devices on the floor.
Figure 7-3 Detected Vs. Connected Devices Report
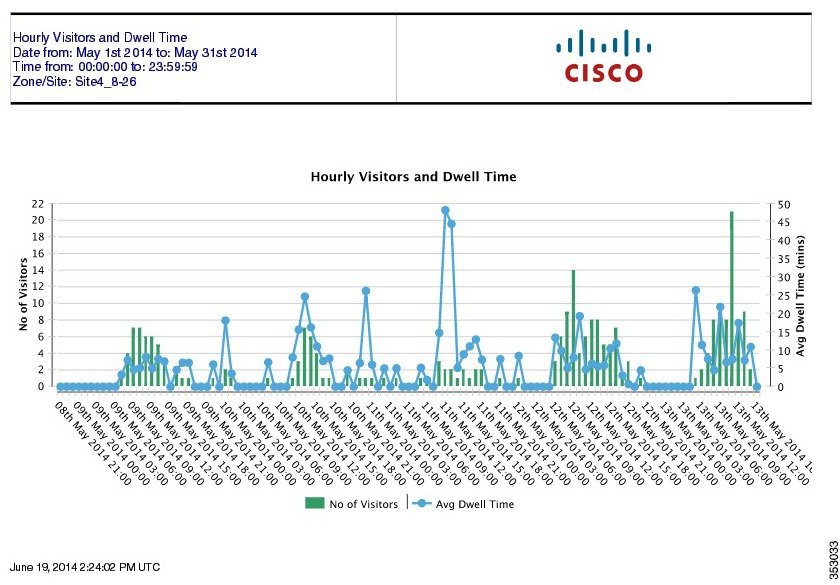
Hourly Visitors and Dwell Time
This report compares the number of devices in several dwell time categories for the same time window over a number of days in the target zone/site. In order to limit the clutter of results, time windows are only selectable for single days. The exception is Daily Visitors and Dwell time.
See the Configuring Hourly Visitors and Dwell Time for more information.
Configuring Hourly Visitors and Dwell Time
Note![]() You can run this report for location enabled zones and presence enabled site.
You can run this report for location enabled zones and presence enabled site.
To run the hourly visitors and dwell time report, follow these steps:
Step 1![]() On the CMX Analytics home page, click Reports.
On the CMX Analytics home page, click Reports.
Step 2![]() From the Report Type drop-down list, choose Hourly Visitors and Dwell Time.
From the Report Type drop-down list, choose Hourly Visitors and Dwell Time.
Step 3![]() To run this report on location enabled zones, choose the zone that you want to reference as a zone of interest from the Zone drop-down list.
To run this report on location enabled zones, choose the zone that you want to reference as a zone of interest from the Zone drop-down list.
Step 4![]() To run this report on presence enabled sites, choose a presence site from the Zone drop-down list.
To run this report on presence enabled sites, choose a presence site from the Zone drop-down list.
Step 5![]() Configure the following in the Date/Time Selection group box:
Configure the following in the Date/Time Selection group box:
–![]() Click the calendar icon to choose the start date and end date or choose a preset value from the Select from a Preset drop-down list. The presets available are Yesterday, Last Week, and
Click the calendar icon to choose the start date and end date or choose a preset value from the Select from a Preset drop-down list. The presets available are Yesterday, Last Week, and
Last Month.
–![]() Click the time icon to choose the time, hour, and minute or choose a preset value from the Select from a Preset drop-down list. The presets available are All day, Business hours, Morning, Lunch Time, Afternoon, and Evening.
Click the time icon to choose the time, hour, and minute or choose a preset value from the Select from a Preset drop-down list. The presets available are All day, Business hours, Morning, Lunch Time, Afternoon, and Evening.
The hourly visitors and dwell time report is displayed in the right pane.
Figure 7-4 Hourly Visitors and Dwell Time
Movement Between Zones
The movement between zones report provides a breakdown of all zones at specific points as devices pass to and from the focus zone. This report gives the following information:
- The zone where the device was first detected.
- The immediate zone before and after where the device was last detected.
Configuring Movement Between Zones
Note![]() You cannot run this report for presence enabled site.
You cannot run this report for presence enabled site.
To run the movement between zones, follow these steps:
Step 1![]() On the CMX Analytics home page, click Reports.
On the CMX Analytics home page, click Reports.
Step 2![]() From the Report Type drop-down list, choose Movement between Zones.
From the Report Type drop-down list, choose Movement between Zones.
–![]() Click the calendar icon to choose the start date and end date or choose a preset value from the Select from a Preset drop-down list. The presets available are Yesterday and Last Week.
Click the calendar icon to choose the start date and end date or choose a preset value from the Select from a Preset drop-down list. The presets available are Yesterday and Last Week.
–![]() Click the time icon to choose the time, hour, and minute or choose a preset value from the Select from a Preset drop-down list. The presets available are All day, Business hours, Morning, Lunch Time, Afternoon, and Evening.
Click the time icon to choose the time, hour, and minute or choose a preset value from the Select from a Preset drop-down list. The presets available are All day, Business hours, Morning, Lunch Time, Afternoon, and Evening.
The movement between zones report is displayed in the right pane.
Figure 7-5 Devices At the Entrance Zone
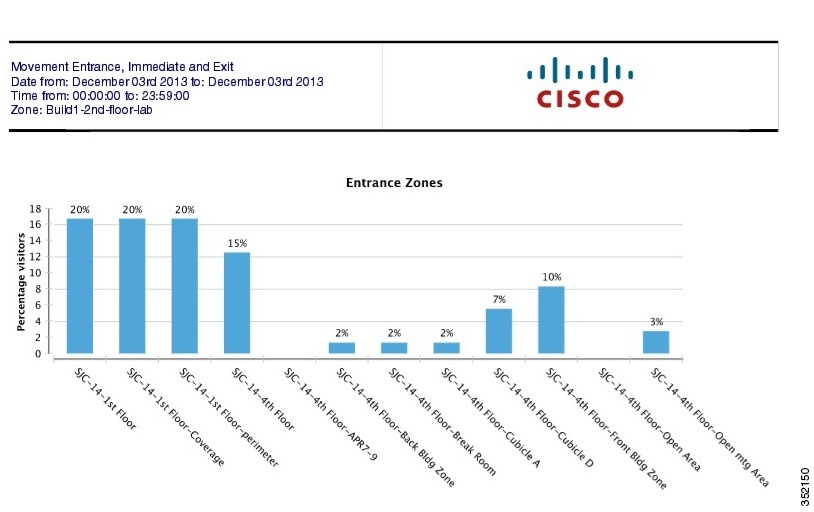
Figure 7-6 Devices At the Exit Zones
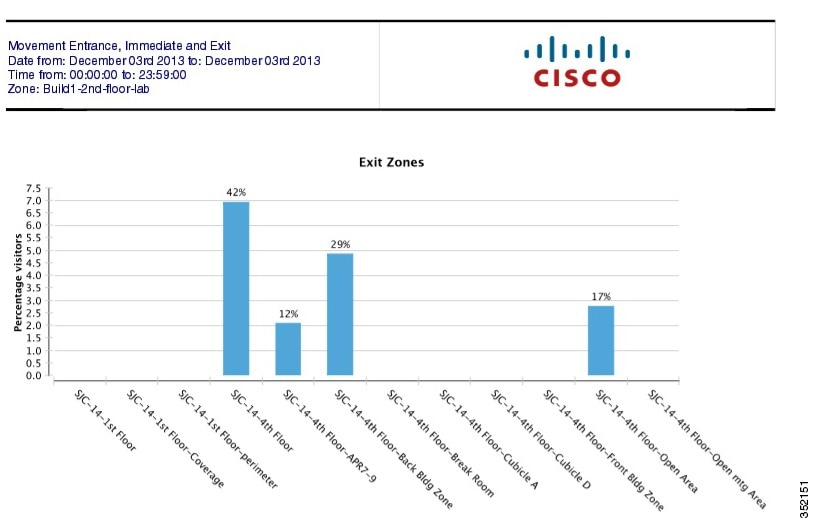
Figure 7-7 Devices Seen Before Visiting the Target Zone
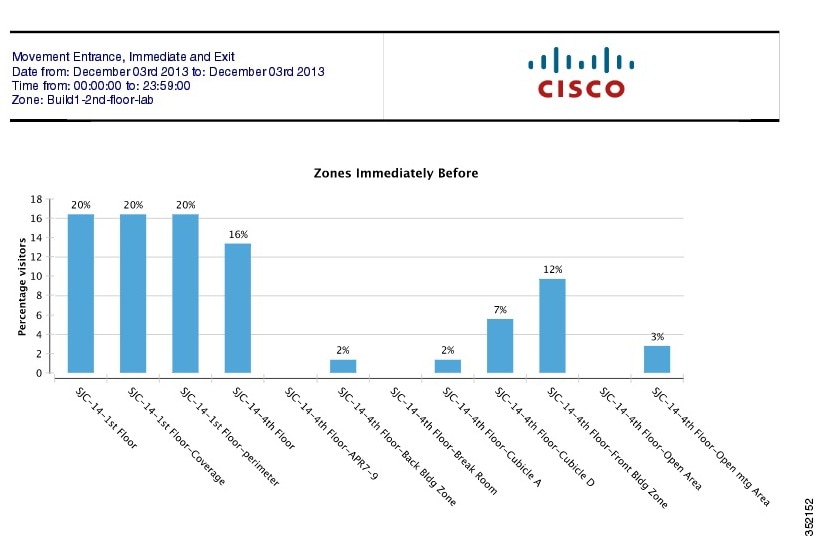
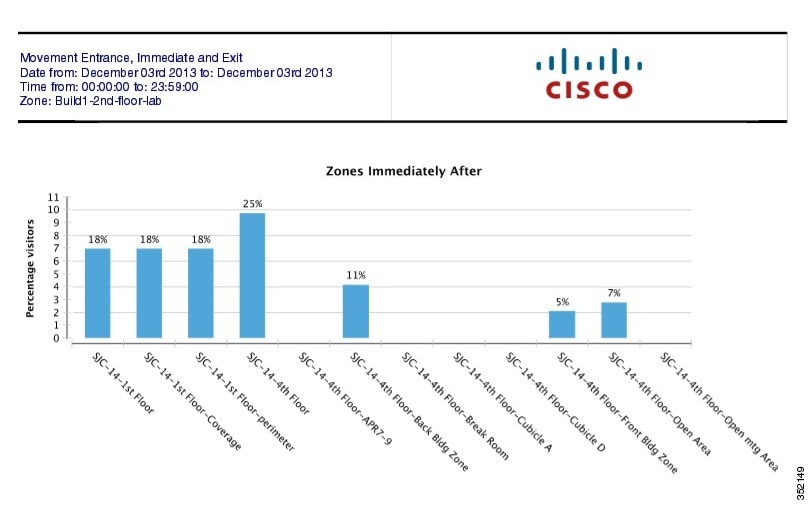
Figure 7-8 Devices Seen After Visiting the Target Zone
Repeat Visitors
This report shows a breakdown of what percentage of devices visited the selected building/site a certain number of times. The Date/Time selection identifies a window of time which gives a reference set of dates. “Counting visits since” gets how often these chosen devices have appeared from that date up to the Date/Time selection. For example, of the devices that came into the venue this week, how frequently did they visit over the last month.
See Configuring the Repeat Visitors for more information.
Configuring the Repeat Visitors
To run the frequency of visits, follow these steps:
Step 1![]() On the CMX Analytics, click Reports.
On the CMX Analytics, click Reports.
Step 2![]() From the Report Type drop-down list, choose Repeat Visitors.
From the Report Type drop-down list, choose Repeat Visitors.
The following parameters are displayed:
- From Counting visits since drop-down list, choose a particular start date.
- From the Building drop-down list, choose the building.
- Click the calendar icon to choose the start date and end date or choose a preset value from the Select from a Preset drop-down list. The presets available are Yesterday and Last Week.
- Click the time icon to choose the time, hour, and minute or choose a preset value from the Select from a Preset drop-down list. The presets available are All day, Business hours, Morning, Lunch Time, Afternoon, and Evening.
Step 3![]() Click Run Report. The report is displayed in the right pane.
Click Run Report. The report is displayed in the right pane.
 Feedback