Cisco Adaptive Wireless Intrusion Prevention System, Release 6.0
Bias-Free Language
The documentation set for this product strives to use bias-free language. For the purposes of this documentation set, bias-free is defined as language that does not imply discrimination based on age, disability, gender, racial identity, ethnic identity, sexual orientation, socioeconomic status, and intersectionality. Exceptions may be present in the documentation due to language that is hardcoded in the user interfaces of the product software, language used based on RFP documentation, or language that is used by a referenced third-party product. Learn more about how Cisco is using Inclusive Language.
- Updated:
- March 17, 2015
Chapter: Monitoring the System and Services
Monitoring the System and Services
This chapter describes how to monitor the mobility services engine by configuring and viewing alarms, events, and logs as well as how to generate reports on system use and element counts (tags, clients, rogue clients, and access points).
It also describes how to use Cisco WCS to monitor clients (wired and wireless), tags, chokepoints, and Wi-Fi TDOA receivers.
This chapter contains the following sections:
•![]() Security Reports and Alarms for wIPS
Security Reports and Alarms for wIPS
Working with Alarms
This section describes how to view, assign, and clear alarms and events on a mobility services engine using Cisco WCS. Details on how to have email notifications for alarms sent to you is described as well as how to define those types (all, critical, major, minor, warning) of alarm notifications that are sent to you.
Viewing Alarms
To view mobility services engine alarms, follow these steps:
Step 1 ![]() In Cisco WCS, choose Monitor > Alarms.
In Cisco WCS, choose Monitor > Alarms.
Step 2 ![]() Click the Advanced Search link in the navigation bar (top-right). A configurable search panel for alarms appears (see Figure 7-1).
Click the Advanced Search link in the navigation bar (top-right). A configurable search panel for alarms appears (see Figure 7-1).
Figure 7-1 Advanced Search Alarm Panel
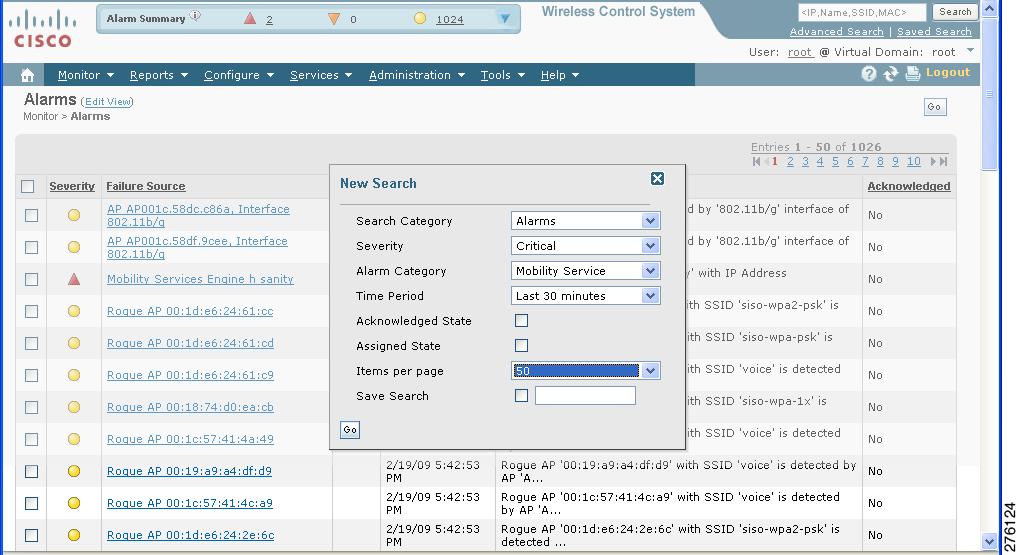
Step 3 ![]() Select Alarms as the Search Category.
Select Alarms as the Search Category.
Step 4 ![]() Select the Severity of Alarms to display. Options are All Severities, Critical, Major, Minor, or Warning.
Select the Severity of Alarms to display. Options are All Severities, Critical, Major, Minor, or Warning.
Step 5 ![]() Select Mobility Service from the Alarm Category.
Select Mobility Service from the Alarm Category.
Options are: All Types, Access Points, Controller, Coverage Hole, Config Audit, Mobility Service Location Notifications, Interference, Mesh Links, Rogue AP, Rogue Adhoc, Security and WCS.
Step 6 ![]() Select the time frame for which you want to review alarms from the Time Period drop-down menu.
Select the time frame for which you want to review alarms from the Time Period drop-down menu.
Options range from minutes (5, 15 and 30) to hours (1 and 8) to days (1 and 7). To display all, select Any time.
Step 7 ![]() Check the Acknowledged State check box to exclude the acknowledged alarms and their count from the Alarm Summary window.
Check the Acknowledged State check box to exclude the acknowledged alarms and their count from the Alarm Summary window.
Step 8 ![]() Check the Assigned State check box to exclude the assigned alarms and their count from the Alarm Summary window.
Check the Assigned State check box to exclude the assigned alarms and their count from the Alarm Summary window.
Step 9 ![]() Select the number of alarms to display on each window from the Items per page drop-down menu.
Select the number of alarms to display on each window from the Items per page drop-down menu.
Step 10 ![]() To save the search criteria for later use, check the Save Search box and enter a name for the search.
To save the search criteria for later use, check the Save Search box and enter a name for the search.

Note ![]() You can initiate the search thereafter, by clicking the Saved Searches link at the top-right of the navigation bar.
You can initiate the search thereafter, by clicking the Saved Searches link at the top-right of the navigation bar.
Step 11 ![]() Click Go. Alarms summary panel appears with search results.
Click Go. Alarms summary panel appears with search results.
Note ![]() Click the column headings (Severity, Failure Object, Owner, Date/Time, and Message) to sort alarms.
Click the column headings (Severity, Failure Object, Owner, Date/Time, and Message) to sort alarms.
Step 12 ![]() Repeat Step 2 to Step 11 to see notifications for access points by entering Access Points as the alarm category in Step 5.
Repeat Step 2 to Step 11 to see notifications for access points by entering Access Points as the alarm category in Step 5.
Assigning and Unassigning Alarms
To assign and unassign an alarm to yourself, follow these steps:
Step 1 ![]() Display the Alarms window as described in the "Viewing Alarms" section.
Display the Alarms window as described in the "Viewing Alarms" section.
Step 2 ![]() Select the alarms that you want to assign to yourself by checking their corresponding check boxes.
Select the alarms that you want to assign to yourself by checking their corresponding check boxes.
Note ![]() To unassign an alarm assigned to you, uncheck the box next to the appropriate alarm. You cannot unassign alarms assigned to others.
To unassign an alarm assigned to you, uncheck the box next to the appropriate alarm. You cannot unassign alarms assigned to others.
Step 3 ![]() From the Select a command drop-down menu, choose Assign to Me (or Unassign) and click Go.
From the Select a command drop-down menu, choose Assign to Me (or Unassign) and click Go.
If you choose Assign to Me, your username appears in the Owner column. If you choose Unassign, the username column becomes empty.
Deleting and Clearing Alarms
If you delete an alarm, Cisco WCS removes it from its database. If you clear an alarm, it remains in the Cisco WCS database, but in the Clear state. You should clear an alarm when the condition that caused it no longer exists.
To delete or clear an alarm from a mobility services engine, follow these steps:
Step 1 ![]() Display the Alarms window as described in the "Viewing Alarms" section.
Display the Alarms window as described in the "Viewing Alarms" section.
Step 2 ![]() Select the alarms that you want to delete or clear by checking their corresponding check boxes.
Select the alarms that you want to delete or clear by checking their corresponding check boxes.
Step 3 ![]() From the Select a command drop-down menu, choose Delete or Clear. Click Go.
From the Select a command drop-down menu, choose Delete or Clear. Click Go.
Emailing Alarm Notifications
Cisco WCS lets you send alarm notifications to a specific email address. Sending notifications through email enables you to take prompt action when needed.
You can select the alarm severity types (critical, major, minor, and warning) you have emailed to you.
To send alarm notifications, follow these steps:
Step 1 ![]() Choose Monitor > Alarms.
Choose Monitor > Alarms.
Step 2 ![]() From the Select a commands drop-down menu, choose Email Notification. Click Go. The Email Notification window appears (see Figure 7-2).
From the Select a commands drop-down menu, choose Email Notification. Click Go. The Email Notification window appears (see Figure 7-2).
Figure 7-2 All Alarms > Email Notification Window
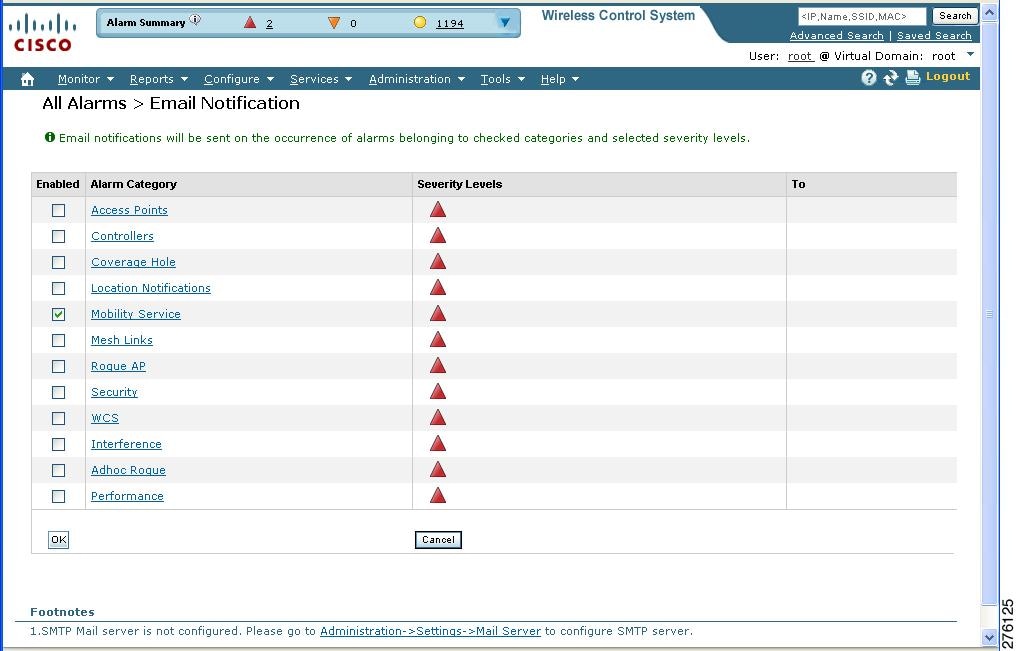
Note ![]() A SMTP Mail Server must be defined prior to entry of target email addresses for email notification. Choose Administration > Settings > Mail Server Configuration to enter the appropriate information. You can also select the Administration > Settings > Mail Server link, if displayed, on the Email Notification window noted above.
A SMTP Mail Server must be defined prior to entry of target email addresses for email notification. Choose Administration > Settings > Mail Server Configuration to enter the appropriate information. You can also select the Administration > Settings > Mail Server link, if displayed, on the Email Notification window noted above.
Step 3 ![]() Click the Enabled box next to the Mobility Service.
Click the Enabled box next to the Mobility Service.
Note ![]() Enabling the Mobility Service alarm category sends all alarms related to the mobility services engine and the location appliance to the defined email address.
Enabling the Mobility Service alarm category sends all alarms related to the mobility services engine and the location appliance to the defined email address.
Step 4 ![]() Click the Mobility Service link. The window for configuring the alarm severity types that are reported for the mobility services engine appears.
Click the Mobility Service link. The window for configuring the alarm severity types that are reported for the mobility services engine appears.
Step 5 ![]() Check the check box next to all the alarm severity types for which you want email notifications sent.
Check the check box next to all the alarm severity types for which you want email notifications sent.
Step 6 ![]() In the To field, enter the email address or addresses to which you want the email notifications sent. Separate email addresses by commas.
In the To field, enter the email address or addresses to which you want the email notifications sent. Separate email addresses by commas.
Step 7 ![]() Click OK.
Click OK.
The Alarms > Notification window appears. The changes to the reported alarm severity levels and the recipient email address for email notifications are displayed.
Working with Events
You can use Cisco WCS to view mobility services engine and location notification events. You can search and display events based on their severity (critical, major, minor, warning, clear, info) and event category.
You can search by the following event categories:
•![]() By network coverage: coverage holes and interference
By network coverage: coverage holes and interference
•![]() By link: mesh links
By link: mesh links
•![]() By notifications: location notifications
By notifications: location notifications
•![]() By product type: access points (rogue and non-rogue), clients, controllers, and mobility service
By product type: access points (rogue and non-rogue), clients, controllers, and mobility service
Note ![]() The product type: mobility service reports events for mobility services engines.
The product type: mobility service reports events for mobility services engines.
•![]() By security
By security
Additionally, you can search for an element's events by its IP address, MAC address or name.
A successful event search displays the event severity, failure object, date and time of the event, and any messages for each event.
To display events, follow these steps:
Step 1 ![]() In Cisco WCS, choose Monitor > Events.
In Cisco WCS, choose Monitor > Events.
Step 2 ![]() In the Events window:
In the Events window:
•![]() If you want to display the events for a specific element, and you know its IP address, name, WLAN SSID, or MAC address, enter that value in the Search field of the navigation bar (top-right). Click Search.
If you want to display the events for a specific element, and you know its IP address, name, WLAN SSID, or MAC address, enter that value in the Search field of the navigation bar (top-right). Click Search.
•![]() To display events by severity and category, click Advanced Search in the navigation bar and select the appropriate options from the Severity and Event Category drop-down menus. Click Go.
To display events by severity and category, click Advanced Search in the navigation bar and select the appropriate options from the Severity and Event Category drop-down menus. Click Go.
Step 3 ![]() If Cisco WCS finds events that match the search criteria, it displays a list of these events.
If Cisco WCS finds events that match the search criteria, it displays a list of these events.
Note ![]() For more information about an event, click the failure object associated with the event. Additionally, you can sort the events summary by each of the column headings.
For more information about an event, click the failure object associated with the event. Additionally, you can sort the events summary by each of the column headings.
Working with Logs
This section describes how to configure logging options and how to download log files.
Configuring Logging Options
You can use Cisco WCS to specify the logging level and types of messages to log.
To configure logging options, follow these steps:
Step 1 ![]() In Cisco WCS, choose Services > Mobility Services.
In Cisco WCS, choose Services > Mobility Services.
Step 2 ![]() Click the name of the mobility services engine that you want to configure.
Click the name of the mobility services engine that you want to configure.
Step 3 ![]() Choose System > Advanced Parameters. The advanced parameters for the selected mobility services engine appears.
Choose System > Advanced Parameters. The advanced parameters for the selected mobility services engine appears.
Step 4 ![]() Scroll down to the Logging Options section and choose the appropriate option from the Logging Level drop-down menu.
Scroll down to the Logging Options section and choose the appropriate option from the Logging Level drop-down menu.
There are four logging options: Off, Error, Information, and Trace.

Step 5 ![]() Check the Enabled check box next to each element listed in that section to begin logging of its events.
Check the Enabled check box next to each element listed in that section to begin logging of its events.
Step 6 ![]() Click Save.
Click Save.
Downloading Log Files
If you need to analyze mobility services engine log files, you can use Cisco WCS to download them to your system. Cisco WCS downloads a zip file containing the log files.
To download a zip file containing the log files, follow these steps:
Step 1 ![]() In Cisco WCS, choose Services > Mobility Services.
In Cisco WCS, choose Services > Mobility Services.
Step 2 ![]() Click the name of the mobility services engine to view its status.
Click the name of the mobility services engine to view its status.
Step 3 ![]() Choose System > Logs (left panel).
Choose System > Logs (left panel).
Step 4 ![]() Click Download Logs.
Click Download Logs.
Step 5 ![]() Follow the instructions in the File Download dialog box to open the file or save the zip file to your system.
Follow the instructions in the File Download dialog box to open the file or save the zip file to your system.
Generating Reports
In Cisco WCS, you can generate a device utilization and location utilization report for a mobility services engine. By default, reports are stored on the Cisco WCS server.
Once you define the report criteria, you can save the device and location utilization reports for future diagnostic use and run them on either an ad hoc or scheduled basis.
You can define the following criteria for a device utilization report:
•![]() Which mobility services engine or engines to monitor
Which mobility services engine or engines to monitor
•![]() How often the report is generated
How often the report is generated
•![]() How the data is graphed on the charts
How the data is graphed on the charts
•![]() Whether the report is emailed or exported to a file
Whether the report is emailed or exported to a file
You can view the following in a location utilization report:
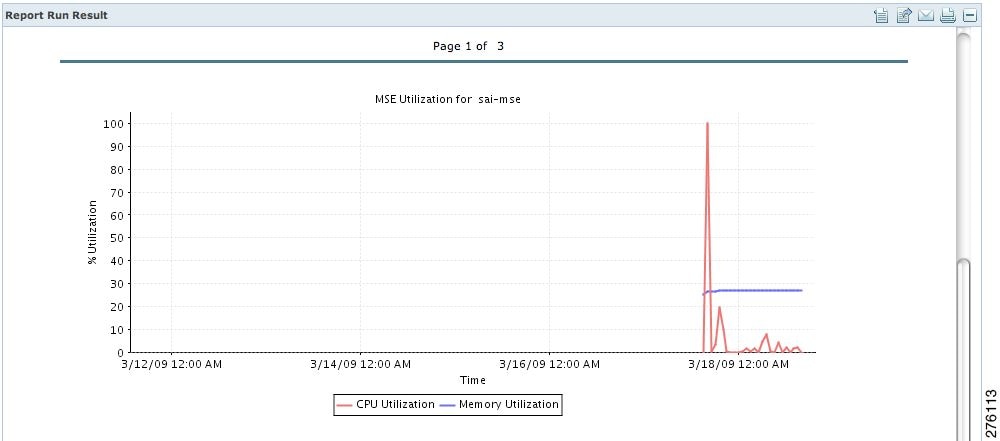
•![]() Chart 1 summarizes and graphs CPU and memory utilization
Chart 1 summarizes and graphs CPU and memory utilization
•![]() Chart 2 summarizes and graphs client count, tag count, rogue client count, rogue access point count, and ad hoc rogue count
Chart 2 summarizes and graphs client count, tag count, rogue client count, rogue access point count, and ad hoc rogue count
Creating a Device Utilization Report
To create a utilization report for the mobility services engine, follow these steps:
Step 1 ![]() In Cisco WCS, choose Reports > Report Launch Pad.
In Cisco WCS, choose Reports > Report Launch Pad.
Step 2 ![]() Choose Device > Utilization.
Choose Device > Utilization.
Step 3 ![]() Click New. The Utilization: New window appears (see Figure 7-3).
Click New. The Utilization: New window appears (see Figure 7-3).
Figure 7-3 Device > Utilization New Window
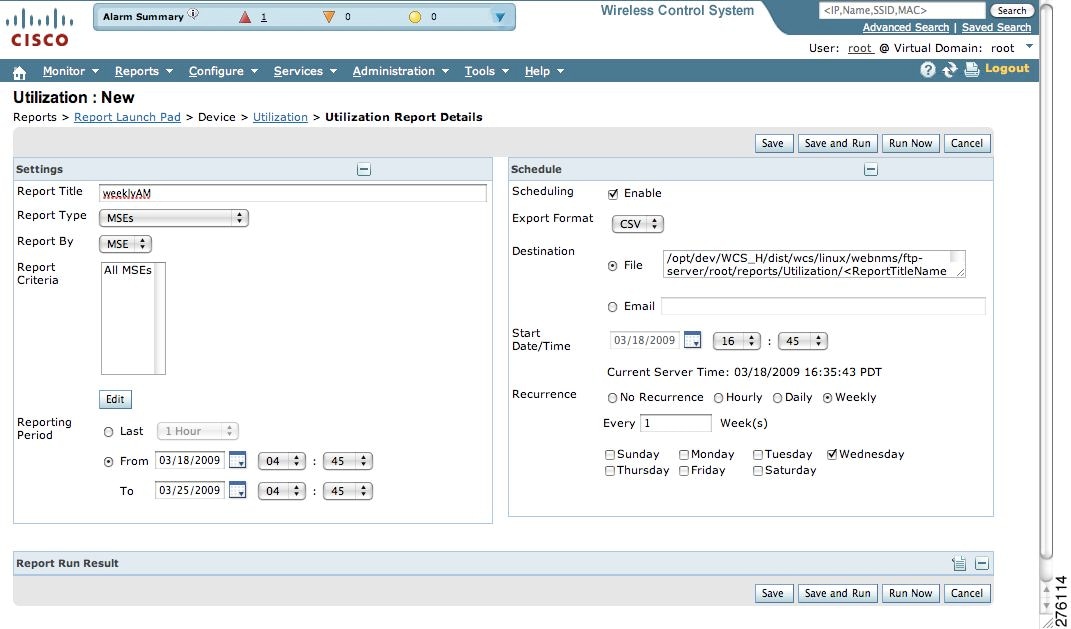
Step 4 ![]() In the settings panel, enter a report title.
In the settings panel, enter a report title.
Step 5 ![]() The Report Type and Report By selections are always MSE.
The Report Type and Report By selections are always MSE.
Step 6 ![]() Click Edit to select either a specific mobility services engine or All MSEs from the pop-up panel that appears.
Click Edit to select either a specific mobility services engine or All MSEs from the pop-up panel that appears.
Step 7 ![]() Enter the reporting period. You can define the report to collect data hourly, weekly, or at a specific date and time. The selected reporting period type will display on the x-axis.
Enter the reporting period. You can define the report to collect data hourly, weekly, or at a specific date and time. The selected reporting period type will display on the x-axis.
Note ![]() The reporting period uses a 24-hour rather than a 12-hour clock. For example, select hour 13 for 1:00 p.m.
The reporting period uses a 24-hour rather than a 12-hour clock. For example, select hour 13 for 1:00 p.m.
Step 8 ![]() In the Schedule panel (right), check the Enable Schedule check box.
In the Schedule panel (right), check the Enable Schedule check box.
Step 9 ![]() Select the report format (CSV or PDF) from the Export Report drop-down menu.
Select the report format (CSV or PDF) from the Export Report drop-down menu.
Step 10 ![]() Select either File or Email as the destination of the report.
Select either File or Email as the destination of the report.
–![]() If you select the File option, a destination path must first be defined at the Administration > Settings > Report window. Enter the destination path for the files in the Repository Path field.
If you select the File option, a destination path must first be defined at the Administration > Settings > Report window. Enter the destination path for the files in the Repository Path field.
–![]() If you select the Email option, an SMTP Mail Server must be defined prior to entry of target email address. Choose Administrator > Settings > Mail Server Configuration to enter the appropriate information.
If you select the Email option, an SMTP Mail Server must be defined prior to entry of target email address. Choose Administrator > Settings > Mail Server Configuration to enter the appropriate information.
Step 11 ![]() Enter a start date (MM:DD:YYYY) or click the calendar icon to select a date.
Enter a start date (MM:DD:YYYY) or click the calendar icon to select a date.
Step 12 ![]() Specify a start time using the hour and minute drop-down menus.
Specify a start time using the hour and minute drop-down menus.
Step 13 ![]() Click one of the Recurrence buttons to select how often the report is run.
Click one of the Recurrence buttons to select how often the report is run.
Note ![]() The days of the week appear on the screen only when the weekly option is chosen.
The days of the week appear on the screen only when the weekly option is chosen.
Step 14 ![]() When finished with all of the above steps, do one of the following:
When finished with all of the above steps, do one of the following:
•![]() Click Save to save edits. The report is run at the designated time and the results are either emailed or saved to a designated file as defined in the Schedule panel.
Click Save to save edits. The report is run at the designated time and the results are either emailed or saved to a designated file as defined in the Schedule panel.
•![]() Click Save and Run to save the changes and run the report now. The report runs regardless of any pending, scheduled run of that report. Results appear the bottom of the window. The report also runs at the designated time and the results are either emailed or saved to a designated file as defined in the Schedule panel.
Click Save and Run to save the changes and run the report now. The report runs regardless of any pending, scheduled run of that report. Results appear the bottom of the window. The report also runs at the designated time and the results are either emailed or saved to a designated file as defined in the Schedule panel.
–![]() At the results window, click Cancel to cancel the defined report.
At the results window, click Cancel to cancel the defined report.
•![]() Click Run Now if you want to run the report immediately and review the results in the WCS window. The report runs regardless of any pending, scheduled run of that report. Results appear at the bottom of the window. Click Save if you want to save the report criteria you entered.
Click Run Now if you want to run the report immediately and review the results in the WCS window. The report runs regardless of any pending, scheduled run of that report. Results appear at the bottom of the window. Click Save if you want to save the report criteria you entered.
Note ![]() You can also use the Run Now command to check the defined report criteria before saving it or to run reports as necessary.
You can also use the Run Now command to check the defined report criteria before saving it or to run reports as necessary.
The results appear at the bottom of the window (see Figure 7-3).
Note ![]() Only the CPU and memory utilization reports as shown in the example below (see Figure 7-4).
Only the CPU and memory utilization reports as shown in the example below (see Figure 7-4).
Figure 7-4 Device > MSE Utilization > Results
Step 15 ![]() If you selected the Save or Save and Run option, click either Reports > Saved Reports (or Reports > Scheduled Runs if it has not yet run and is scheduled to run). The Utilization Reports summary window appears (see Figure 7-5).
If you selected the Save or Save and Run option, click either Reports > Saved Reports (or Reports > Scheduled Runs if it has not yet run and is scheduled to run). The Utilization Reports summary window appears (see Figure 7-5).
Figure 7-5 Utilization Reports Summary Window
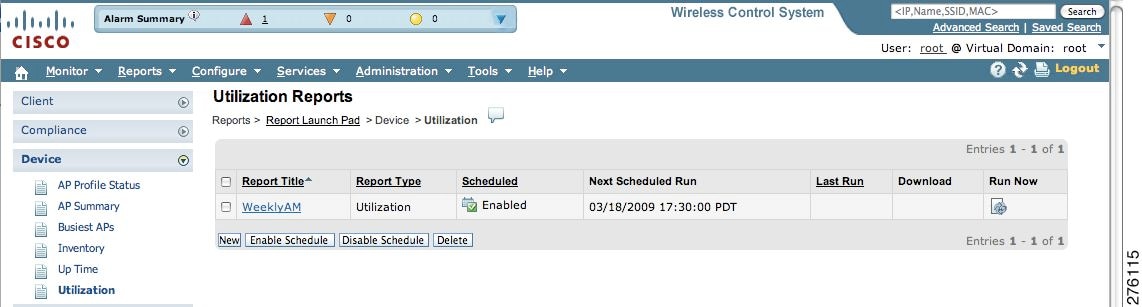
If the report is scheduled, it is shown as enabled and the next scheduled run date is noted.
If the report has run and is not scheduled to run again, it is shown as expired.
If the report has run and is scheduled to run again, it is shown as disabled.
Step 16 ![]() To enable, disable, or delete a report, check the check box next to the report title and click the appropriate button.
To enable, disable, or delete a report, check the check box next to the report title and click the appropriate button.
Viewing Saved Utilization Report
To download a saved report, follow these steps:
Step 1 ![]() In Cisco WCS, choose Reports > Saved Reports.
In Cisco WCS, choose Reports > Saved Reports.
Step 2 ![]() Click the Download icon for your request. It is downloaded and saved in the defined directory or emailed.
Click the Download icon for your request. It is downloaded and saved in the defined directory or emailed.
Viewing Scheduled Utilization Runs
To review status for a scheduled report, follow these steps:
Step 1 ![]() In Cisco WCS, choose Reports > Scheduled Runs.
In Cisco WCS, choose Reports > Scheduled Runs.
Step 2 ![]() Click the History icon to see the date of the last report run.
Click the History icon to see the date of the last report run.
Step 3 ![]() Click the Download icon for your report. It is downloaded and saved in the defined directory or emailed.
Click the Download icon for your report. It is downloaded and saved in the defined directory or emailed.
Security Reports and Alarms for wIPS
You can view, modify, or create a security report or alarm for wIPS.
Note ![]() Security reports do not show the status of autonomous access points.
Security reports do not show the status of autonomous access points.
The choices are as follows:
•![]() Adaptive wIPS Alarms—Alarms reported for wIPS on monitor mode access points.
Adaptive wIPS Alarms—Alarms reported for wIPS on monitor mode access points.
•![]() Adaptive wIPS Top 10 AP—Lists the last 10 events reported for monitor access points.
Adaptive wIPS Top 10 AP—Lists the last 10 events reported for monitor access points.
•![]() Adhoc Rogue Event—Displays all adhoc events that WCS has received in the selected timeframe.
Adhoc Rogue Event—Displays all adhoc events that WCS has received in the selected timeframe.
•![]() Adhoc Rogues—Displays all adhocs that have been updated in the selected timeframe.
Adhoc Rogues—Displays all adhocs that have been updated in the selected timeframe.
•![]() New Rogue APs—Displays, in tabular form, all rogues detected in a selected timeframe. It provides which new rogues were detected within a selected time. The created time indicates the time at which the rogue was first detected.
New Rogue APs—Displays, in tabular form, all rogues detected in a selected timeframe. It provides which new rogues were detected within a selected time. The created time indicates the time at which the rogue was first detected.
•![]() New Rogue AP Count—Displays, in graphical form, all rogues detected in a selected timeframe.
New Rogue AP Count—Displays, in graphical form, all rogues detected in a selected timeframe.
•![]() Rogue APs—Displays all rogues that are active in your network and have been updated in the selected timeframe. WCS receives updated events for rogues that are detected
Rogue APs—Displays all rogues that are active in your network and have been updated in the selected timeframe. WCS receives updated events for rogues that are detected
•![]() Rogue APs Event—Displays all the events received by WCS. The controller sends updates of detected rogues if any of the attributes change or new rogues are detected.
Rogue APs Event—Displays all the events received by WCS. The controller sends updates of detected rogues if any of the attributes change or new rogues are detected.
Note ![]() This report was formally called the Rogue Detected by AP.
This report was formally called the Rogue Detected by AP.
•![]() Security Summary—Shows the number of association failures, rogues access points, ad hocs, and access point connections or disconnections over one month.
Security Summary—Shows the number of association failures, rogues access points, ad hocs, and access point connections or disconnections over one month.
•![]() Click Save and Run to save the changes and run the report now. The report runs regardless of any scheduled time associated with the report and is viewable in the Results tab. Additionally, the report is run at the designated time and the results are either emailed or saved to a designated file as defined in the Schedule tab.
Click Save and Run to save the changes and run the report now. The report runs regardless of any scheduled time associated with the report and is viewable in the Results tab. Additionally, the report is run at the designated time and the results are either emailed or saved to a designated file as defined in the Schedule tab.
–![]() At the results window, you can cancel or delete the report.
At the results window, you can cancel or delete the report.
Creating a New wIPS Security or Alarms Report
Security reports provide a number of details on access points and rogue access points for wIPS.
To create a new security report, follow these steps:
Note ![]() Some of these steps or options are not required for every report.
Some of these steps or options are not required for every report.
Step 1 ![]() Choose Reports > Report Launch Pad. The Report Launch Pad window appears.
Choose Reports > Report Launch Pad. The Report Launch Pad window appears.
Step 2 ![]() Choose Security (left panel) and click on one of the report types in the left panel (such as Adaptive wIPS Top 10 Report Details).
Choose Security (left panel) and click on one of the report types in the left panel (such as Adaptive wIPS Top 10 Report Details).
Step 3 ![]() Click New. The new report window appears (see Figure 7-6)
Click New. The new report window appears (see Figure 7-6)
Figure 7-6 New Report Window

Step 4 ![]() In the settings panel, enter a report title.
In the settings panel, enter a report title.
Step 5 ![]() The Report By selections is always MSE with Adaptive wIPS Service.
The Report By selections is always MSE with Adaptive wIPS Service.
Step 6 ![]() The Report Criteria is always either a specific mobility services engine or All MSEs with Adaptive wIPS Service
The Report Criteria is always either a specific mobility services engine or All MSEs with Adaptive wIPS Service
Step 7 ![]() Click Edit to add or modify the Report Crieteria. A pop-up panel appears.
Click Edit to add or modify the Report Crieteria. A pop-up panel appears.
Step 8 ![]() Enter the reporting period. You can define the report to collect data hourly, weekly, or at a specific date and time. The selected reporting period type will display on the x-axis.
Enter the reporting period. You can define the report to collect data hourly, weekly, or at a specific date and time. The selected reporting period type will display on the x-axis.
Note ![]() The reporting period uses a 24-hour rather than a 12-hour clock. For example, select hour 13 for 1:00 p.m.
The reporting period uses a 24-hour rather than a 12-hour clock. For example, select hour 13 for 1:00 p.m.
Step 9 ![]() In the Schedule panel (right), check the Enable Schedule check box.
In the Schedule panel (right), check the Enable Schedule check box.
Step 10 ![]() Select the report format (CSV or PDF) from the Export Report drop-down menu.
Select the report format (CSV or PDF) from the Export Report drop-down menu.
Step 11 ![]() Select either File or Email as the destination of the report.
Select either File or Email as the destination of the report.
–![]() If you select the File option, a destination path must first be defined at the Administration > Settings > Report window. Enter the destination path for the files in the Repository Path field.
If you select the File option, a destination path must first be defined at the Administration > Settings > Report window. Enter the destination path for the files in the Repository Path field.
–![]() If you select the Email option, an SMTP Mail Server must be defined prior to entry of target email address. Choose Administrator > Settings > Mail Server Configuration to enter the appropriate information.
If you select the Email option, an SMTP Mail Server must be defined prior to entry of target email address. Choose Administrator > Settings > Mail Server Configuration to enter the appropriate information.
Step 12 ![]() Enter a start date (MM:DD:YYYY) or click the calendar icon to select a date.
Enter a start date (MM:DD:YYYY) or click the calendar icon to select a date.
Step 13 ![]() Specify a start time using the hour and minute drop-down menus.
Specify a start time using the hour and minute drop-down menus.
Step 14 ![]() Click one of the Recurrence buttons to select how often the report is run.
Click one of the Recurrence buttons to select how often the report is run.
Note ![]() The days of the week only appear on the when the weekly option is chosen.
The days of the week only appear on the when the weekly option is chosen.
Step 15 ![]() When finished with all of the above steps, do one of the following:
When finished with all of the above steps, do one of the following:
•![]() Click Save to save edits. The report is run at the designated time and the results are either emailed or saved to a designated file as defined in the Schedule panel.
Click Save to save edits. The report is run at the designated time and the results are either emailed or saved to a designated file as defined in the Schedule panel.
•![]() Click Save and Run to save the changes and run the report now. The report runs regardless of any pending, scheduled run of that report. Results appear the bottom of the window. The report also runs at the designated time and the results are either emailed or saved to a designated file as defined in the Schedule panel.
Click Save and Run to save the changes and run the report now. The report runs regardless of any pending, scheduled run of that report. Results appear the bottom of the window. The report also runs at the designated time and the results are either emailed or saved to a designated file as defined in the Schedule panel.
–![]() At the results window, click Cancel to cancel the defined report.
At the results window, click Cancel to cancel the defined report.
•![]() Click Run Now if you want to run the report immediately and review the results in the WCS window. The report runs regardless of any pending, scheduled run of that report. Results appear at the bottom of the window. Click Save if you want to save the report criteria you entered.
Click Run Now if you want to run the report immediately and review the results in the WCS window. The report runs regardless of any pending, scheduled run of that report. Results appear at the bottom of the window. Click Save if you want to save the report criteria you entered.
Note ![]() You can also use the Run Now command to check the defined report criteria before saving it or to run reports as necessary.
You can also use the Run Now command to check the defined report criteria before saving it or to run reports as necessary.
The results appear at the bottom of the window.
Step 16 ![]() Repeat Step 2 to Step 15 for each wIPS report you want to create.
Repeat Step 2 to Step 15 for each wIPS report you want to create.
Viewing Saved wIPS Report
To download a saved report, follow these steps:
Step 1 ![]() In Cisco WCS, choose Reports > Saved Reports.
In Cisco WCS, choose Reports > Saved Reports.
Step 2 ![]() Click the Download icon for your request. It is downloaded and saved in the defined directory or emailed.
Click the Download icon for your request. It is downloaded and saved in the defined directory or emailed.
Viewing Scheduled wIPS Report Runs
To review status for a scheduled report, follow these steps:
Step 1 ![]() In Cisco WCS, choose Reports > Scheduled Runs.
In Cisco WCS, choose Reports > Scheduled Runs.
Step 2 ![]() Click the History icon to see the date of the last report run.
Click the History icon to see the date of the last report run.
Step 3 ![]() Click the Download icon for your report. It is downloaded and saved in the defined directory or emailed.
Click the Download icon for your report. It is downloaded and saved in the defined directory or emailed.
 Feedback