Cisco UCS Director End User Portal Guide, Release 6.5
Bias-Free Language
The documentation set for this product strives to use bias-free language. For the purposes of this documentation set, bias-free is defined as language that does not imply discrimination based on age, disability, gender, racial identity, ethnic identity, sexual orientation, socioeconomic status, and intersectionality. Exceptions may be present in the documentation due to language that is hardcoded in the user interfaces of the product software, language used based on RFP documentation, or language that is used by a referenced third-party product. Learn more about how Cisco is using Inclusive Language.
- Updated:
- July 11, 2017
Chapter: Overview
Overview
- End User Portal
- Landing Page
- Header
- Menu
- Summary Dashlets
- Dashboard
- Common Icons
- Diagnostic Resource Notifications
End User Portal
The End User Portal is a self-service portal that includes a catalog of services provided by your administrator. After you request one of the services available to you, the End User Portal completes the service request workflow configured by your administrator. This workflow may include approval of your self-service provisioning request, assignment of the necessary compute, storage and network resources, and configuration of security and performance settings. After your service is provisioned, you can track the status of your services through the summary dashlets and summary reports on your landing page, and through the service request report available within the End User Portal.
As an end user, based on your administration setup, you can perform one or more of the following operations:
-
Provision virtual machines (VMs), application specific infrastructure, and bare metal servers
-
Review and manage your service requests
-
Upload and deploy OVFs and other images
-
Monitor and create reports for your provisioned virtual and physical resources
-
Approve service requests to provision infrastructure
Additional functionality may be available to you if your administrator provides you with the necessary permissions.
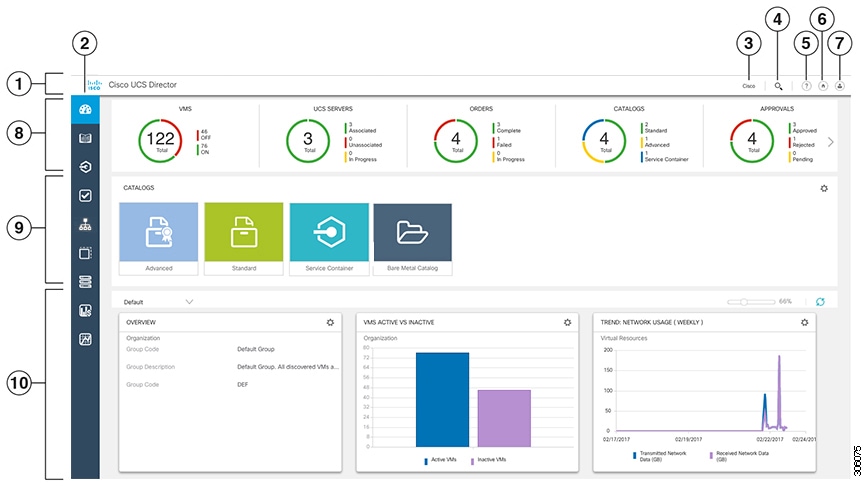
Landing Page
The landing page opens when you log in to the End User Portal. The elements that you see on the landing page depend upon how you and your administrator have configured the display.
The following are the available elements for your landing page:
-
Header—Displays across the top of the page.
-
Menu—Displays frequently accessed elements of the End User Portal.
-
Summary Dashlets—Optional. Display a visual summary of the current status of your services and resources. The summary dashlets are available only if your administrator configures them and if your dashboard is enabled.
-
Catalog—Optional. Displays the catalog folders of VMs, service containers, and other services that are available for you to review and request.
-
Dashboard—Optional. Displays the summary reports that you choose to add to your landing page. The summary reports are available if your dashboard is enabled.
 Note | If your administrator has not configured the dashlets or published any catalogs, the No Dashlet Configured or No Catalogs Published message appears. |
|
Number |
Name |
Description |
|---|---|---|
|
1 |
Header |
Contains frequently accessed elements, including the menu. The header is always visible. |
|
2 |
Menu |
Expands when you hover over to provide access to further functionality. If you click an option in the menu, the menu collapses. |
|
3 |
Link |
Provides a link to a webpage that is configured by your administrator. This link is optional and may not be implemented by your administrator. |
|
4 |
Search icon |
Allows you to search for and navigate directly to a specific report in the End User Portal. |
|
5 |
Help icon |
Links to the online help system for the End User Portal. |
|
6 |
Home icon |
Returns you to the landing page from any location in the End User Portal. |
|
7 |
User icon |
Allows you to edit your profile, enable or disable the dashboard, access the classic view of the End User Portal, and log out. |
|
8 |
Summary Dashlet area |
Provides a high-level overview of the current status of your items. This area may contain up to five dashlets. These dashlets are visible only if your administrator configures them and if your dashboard is enabled. |
|
9 |
Catalog area |
Provides high-level access to the catalogs available for you to review and request. The catalog folders are only available if configured by your administrator. The option to hide the catalog area is available by clicking the settings icon. |
|
10 |
Dashboard area |
Displays the summary reports that you choose to add to your landing page. By default the dashboard is enabled. A scroll bar displays on the right side of the landing page if the summary reports extend beyond the viewable page length. |
Header
The header is located at the top of the End User Portal. The header is always visible, no matter what page you are on in the application.
The header will always include the following elements:
-
Diagnostic resource notification icon, if you have any resource notifications
-
Search icon to search for reports
-
Help icon to access the online help
-
Home icon to return to the landing page
-
User icon to access the classic view of the End User Portal, to edit your profile, and to log out
Your administrator can also add a link to a website that is relevant to your work or your company.
Menu
The menu is located on the left side of the landing page. This menu is always available, no matter which landing page you use. When you hover over the menu, the menu expands. If you click an option in the menu, the menu collapses.
Note | The menu does not have a scroll bar. The menu only displays the number of options that fit in the space available. Some options may not appear if you minimize your screen or zoom in. |
You can use the menu to access the functionality of the End User Portal, including the following:
Summary Dashlets
The summary dashlets provide a high-level overview of the current status of your resources. The available dashlets include:
Note | These dashlets are visible only if your administrator configures them and if your dashboard is enabled. Your administrator may choose to configure some or all of the available dashlets. |
Each dashlet shows the number of resources, a visual indication of the status of those resources, and a legend with the number of resources in each status.
If you click on a legend in the dashlet, you will be redirected to a filtered view of the report. You will also see the filter conditions that were used to create the filtered view of the report.
Dashboard
The dashboard is an optional configuration of the landing page. This configuration is not universal. By default, the dashboard is enabled, but you can choose to not enable the dashboard in the user settings.
The dashboard adds one or more summary reports to your landing page. These summary reports provide information about your system, such as your deployed VMs, network usage, CPU usage, and trend reports on consolidated usage.
Common Icons
The following table provides information about the common icons used in the End User Portal. You can see the name of an icon when you hover over it with your mouse. Some icons may have a different name, depending upon the context in which they're used. For example, the Delete icon may be named Delete Report or Delete Snapshot.
|
Icon |
Name |
Description |
|---|---|---|
|
|
Search |
Search is available on the header and on individual screens. Click Search on the header to find a report in the End User Portal. Click Search on an individual screen to find one or more items in the report. |
|
|
Alert |
Alert is available on the header. Click Alert to view your diagnostic system messages. |
|
|
User |
User is available on the header. Click User to access your profile, log out, or access the classic view of the End User Portal. |
|
|
Export |
Export is available on individual screens. Click Export to export the content of the report that is visible on the screen. |
|
|
Refresh |
Refresh is available on individual screens. Click Refresh to refresh the data that is visible on the screen. |
|
|
View Details |
View Details is available on individual screens. Click View Details to see details about the selected row in the table. |
|
|
Table View |
Table view is available for your catalogs and application containers. Click Table View to view your catalogs and application containers in a hierarchical table with details about each catalog item and application container. With this view, you must click on the catalog item type folder to view the available catalog items or application container. |
|
|
Tile View |
Tile view is available for your catalogs and application containers. Click Tile View to view your catalogs and application containers in a tiled view of icons. With this view, you must click on an icon to see details about that catalog item or application container. |
|
|
Create |
Create is available on individual screens. Click Create to create a new object, such as a VM disk. This icon is only visible if your administrator has given you permission by enabling the appropriate End User Self-Service option in your group's VDC. |
|
|
Add |
Add is available on individual screens. Click Add to add an item to an existing object, such as adding a catalog item to an existing catalog folder. The name of this icon may also include the item that you want to add, such as Add Catalog. This icon is only visible if your administrator has given you permission by enabling the appropriate End User Self-Service option in your group's VDC. |
|
|
Edit |
Edit is available on individual screens. Click Edit to modify an existing object, such as a catalog item or a VM disk. This icon is only visible if your administrator has given you permission by enabling the appropriate End User Self-Service option in your group's VDC. |
|
|
Delete |
Delete is available on individual screens. Click Delete to delete an object, such as a catalog item or a VM disk. This icon is only visible if your administrator has given you permission by enabling the appropriate End User Self-Service option in your group's VDC. |
|
|
Custom Actions |
This icon represents additional tasks that do not have an associated icon. |
Diagnostic Resource Notifications
The diagnostic resource notification icon is located on the header. The icon is only visible if you have resource notifications. When you click the icon, you can view all diagnostic resource notifications that are relevant to your actions and permissions in the End User Portal.
The most recent resource notifications display at the top of the list. You cannot delete notifications from this list.
Format of Diagnostic Resource Notifications
The following table describes the format that is used for all diagnostic resource notifications.
|
Name |
Description |
|---|---|
|
Severity |
An icon that represents the severity of the diagnostic resource notification. For more information about the severities, see Severities of Diagnostic Resource Notifications. |
|
Category |
The category of the item or managed object that has caused the resource notification. For example, this could be one of the following: |
|
Item |
The specific item or managed object that has caused the resource notification. Additional information about a specific account may be included in the item name. |
|
Description |
A description of the problem that has caused the resource notification. For example, this could describe an issue with a user account, with a cloud account, with a VM or a server. |
|
Recommendation |
A recommendation for how to resolve the problem that caused the resource notification. |
|
Audit Time |
The date and time when the resource notification was created. |
Severities of Diagnostic Resource Notifications
The following table describes the severities of diagnostic resource notifications that you may encounter.
|
Icon |
Severity |
Description |
|---|---|---|
|
|
Critical |
Service-affecting condition that requires immediate corrective action. For example, this severity could indicate that either a VM or a server is down and needs to be restarted. |
|
|
Major |
Service-affecting condition that requires corrective action as soon as possible. For example, this severity could indicate a severe degradation in the capability of a VM or a server and that you need to restore its full capability. |
|
|
Minor |
Non-service-affecting condition that requires corrective action to prevent a more serious issue. For example, this severity could indicate that the detected condition is not degrading the capacity of the managed object. |
|
|
Warning |
Potential or impending service-affecting condition that is not currently causing significant effects in the system. You should take action to further diagnose, if necessary, and correct the problem to prevent it from becoming a more serious service-affecting issue. |
|
|
Normal |
Notification or informational message. Does not indicate a condition or issue with the system. |
 Feedback