NetFlow Lite Configuration Guide, Cisco IOS Release 15.2(2)E (Catalyst 2960-XR Switch)
Bias-Free Language
The documentation set for this product strives to use bias-free language. For the purposes of this documentation set, bias-free is defined as language that does not imply discrimination based on age, disability, gender, racial identity, ethnic identity, sexual orientation, socioeconomic status, and intersectionality. Exceptions may be present in the documentation due to language that is hardcoded in the user interfaces of the product software, language used based on RFP documentation, or language that is used by a referenced third-party product. Learn more about how Cisco is using Inclusive Language.
- Updated:
- June 30, 2014
Chapter: Configuring NetFlow Lite
- Finding Feature Information
- Prerequisites for NetFlow Lite
- Restrictions for NetFlow Lite
- Information about Flexible NetFlow
- How to Configure NetFlow Lite
- Monitoring NetFlow Lite
- Configuration Examples for NetFlow Lite
- Additional References
- Feature Information for Flexible NetFlow
Configuring NetFlow Lite
- Finding Feature Information
- Prerequisites for NetFlow Lite
- Restrictions for NetFlow Lite
- Information about Flexible NetFlow
- How to Configure NetFlow Lite
- Monitoring NetFlow Lite
- Configuration Examples for NetFlow Lite
- Additional References
- Feature Information for Flexible NetFlow
Finding Feature Information
Your software release may not support all the features documented in this module. For the latest caveats and feature information, see Bug Search Tool and the release notes for your platform and software release. To find information about the features documented in this module, and to see a list of the releases in which each feature is supported, see the feature information table at the end of this module.
Use Cisco Feature Navigator to find information about platform support and Cisco software image support. To access Cisco Feature Navigator, go to http://www.cisco.com/go/cfn. An account on Cisco.com is not required.
Prerequisites for NetFlow Lite
NetFlow Lite is only supported on a Catalyst 2960-X Switch with a LAN Base license and on a Catalyst 2960-XR Switch with an IP Lite license. Catalyst 2960-XR is not stackable with the Catalyst 2960-X platform.
The following two targets for attaching a NetFlow Lite monitor are supported:
Restrictions for NetFlow Lite
The following are restrictions for NetFlow Lite:
-
Monitor
restrictions:
- Monitor attachment is only supported in the ingress direction.
- One monitor per interface is supported, although multiple exporters per interface are supported.
- Only permanent and normal cache is supported for the monitor; immediate cache is not supported.
- Changing any monitor parameter will not be supported when it is applied on any of the interfaces or VLANs.
- When both the port and VLANs have monitors attached, then VLAN monitor will overwrite the port monitor for traffic coming on the port.
- Flow monitor type and traffic type (type means IPv4, IPv6, and data link) should be same for the flows to be created.
- You cannot attach an IP and port-based monitor to an interface at the same time on the switch. A 48-port switch supports a maximum of 48 monitors (IP or port-based) and for 256 SVIs, you can configure up to 256 monitors (IP or port-based).
- When running the show flow monitor flow_name cache command, the switch displays cache information from an earlier switch software version (Catalyst 2960-S) with all fields entered as zero. Ignore these fields, as they are inapplicable to the switch.
-
Sampler
restrictions:
- Only sampled NetFlow is supported.
- For both port and VLANS, a total of only 4 samplers (random or deterministic) are supported on the switch.
- The sampling minimum rate for both modes is 1 out of 32 flows, and the sampling maximum rate for both modes is 1 out of 1022 flows.
- You must associate a sampler with a monitor while attaching it to an interface. Otherwise, the command will be rejected. Use the ip flow monitor monitor_name sampler sampler_name input interface configuration command to perform this task.
- When you attach a monitor using a deterministic sampler, every attachment with the same sampler uses one new free sampler from the switch (hardware) out of 4 available samplers. You are not allowed to attach a monitor with any sampler, beyond 4 attachments. When you attach a monitor using a random sampler, only the first attachment uses a new sampler from the switch (hardware). The remainder of all of the attachments using the same sampler, share the same sampler. Because of this behavior, when using a deterministic sampler, you can always make sure that the correct number of flows are sampled by comparing the sampling rate and what the switch sends. If the same random sampler is used with multiple interfaces, flows from any interface can always be sampled, and flows from other interfaces can always be skipped.
- Network flows and statistics are collected at the line rate.
- ACL-based NetFlow is not supported.
- Only NetFlow Version 9 is supported for Flexible NetFlow exporter using the export-protocol command option. If you configure NetFlow Version 5, this version will be accepted, but the NetFlow Version 5 export functionality is neither currently available nor supported.
- Each switch in a stack (hardware) can support the creation of a maximum of 16,000 flows at any time. But as the flows are periodically pushed to the software cache, the software cache can hold a much larger amount of flows (1048 Kb flows). From the hardware flow cache, every 20 seconds (termed as poll timer), 200 flows (termed as poll entries) are pushed to software.
- The switch supports homogeneous stacking, but does not support mixed stacking.
Information about Flexible NetFlow
NetFlow Lite Overview
With NetFlow Lite, traffic is processed and packets are classified into flows. New flows are inserted in the NetFlow table, and statistics are automatically updated. You must configure both ingress and egress NetFlow monitoring. The network services module supports one monitor per interface per direction.
NetFlow Lite has these components:
- Records are combinations of key and nonkey fields assigned to monitor NetFlow Lite monitors to define the cache used to store data.
- Flow monitors are applied to interfaces to perform network traffic monitoring. A flow monitor includes a user-defined record, an optional flow exporter, and a cache that is automatically created when the monitor is applied to the first interface. The switch supports normal caches that age out according to settings.
- Flow exporters export the data in the flow monitor cache to a remote system, such as a server running NetFlow collector.
- Flow samplers reduce the load that NetFlow Lite puts on the networking device to monitor traffic by limiting the number of packets that are analyzed.
You can configure unidirectional flow (destination or source-address based flows), and you can also configure flow aging. These features are supported on the network services module:
- You can configure collection statistics for Layer 2-switched (nonrouting) traffic, Layer 3 IPv4 and IPv6 traffic, and Layer 4 TCP, IGMP, and ICMP traffic.
- NetFlow counting, maintenance, troubleshooting (debugging commands).
- NetFlow analysis is performed on traffic crossing the physical interfaces on the network services module. The switch processes egress (outbound) traffic after forwarding decisions are performed. You can force locally switched or routed traffic through service module ports by configuring private VLANs or protected ports.
Flow Records
A flow record defines the keys that NetFlow Lite uses to identify packets in the flow, as well as other fields of interest that NetFlow Lite gathers for the flow. You can define a flow record with any combination of keys and fields of interest.
A flow record also defines the types of counters gathered per flow. You can configure 64-bit packet or byte counters.
- NetFlow Predefined Records
- User-Defined Records
- NetFlow Lite Match Parameters
- NetFlow Lite Collect Parameters
NetFlow Predefined Records
Flexible NetFlow includes several predefined records that you can use to start monitoring traffic in your network. The predefined records are available to help you quickly deploy Flexible NetFlow and are easier to use than user-defined flow records. You can choose from a list of already defined records that may meet the needs for network monitoring. As Flexible NetFlow evolves, popular user-defined flow records will be made available as predefined records to make them easier to implement.
The predefined records ensure backward compatibility with your existing NetFlow collector configurations for the data that is exported. Each of the predefined records has a unique combination of key and nonkey fields that offer you the built-in ability to monitor various types of traffic in your network without customizing Flexible NetFlow on your router.
Two of the predefined records (NetFlow original and NetFlow IPv4/IPv6 original output), which are functionally equivalent, emulate original (ingress) NetFlow and the Egress NetFlow Accounting feature in original NetFlow, respectively. Some of the other Flexible NetFlow predefined records are based on the aggregation cache schemes available in original NetFlow. The Flexible NetFlow predefined records that are based on the aggregation cache schemes available in original NetFlow do not perform aggregation. Instead each flow is tracked separately by the predefined records.
User-Defined Records
Flexible NetFlow enables you to define your own records for a Flexible NetFlow flow monitor cache by specifying the key and nonkey fields to customize the data collection to your specific requirements. When you define your own records for a Flexible NetFlow flow monitor cache, they are referred to as user-defined records. The values in nonkey fields are added to flows to provide additional information about the traffic in the flows. A change in the value of a nonkey field does not create a new flow. In most cases the values for nonkey fields are taken from only the first packet in the flow. Flexible NetFlow enables you to capture counter values such as the number of bytes and packets in a flow as nonkey fields.
Flexible NetFlow adds a new Version 9 export format field type for the header and packet section types. Flexible NetFlow will communicate to the NetFlow collector the configured section sizes in the corresponding Version 9 export template fields. The payload sections will have a corresponding length field that can be used to collect the actual size of the collected section.
NetFlow Lite Match Parameters
You can match these key fields for the flow record:
- IPv4 or IPv6 destination address
- Datalink fields (source and destination MAC address, and MAC ethertype (type of networking protocol)).
- Transport field source and destination ports to identify the type of application: ICMP, IGMP, or TCP traffic.
The following table describes NetFlow Lite match parameters. You must configure at least one of the following match parameters for the flow records.
NetFlow Lite Collect Parameters
You can collect these key fields in the flow record:
- The total number of bytes, flows or packets sent by the exporter (exporter) or the number of bytes or packets in a 64-bit counter (long).
- The timestamp based on system uptime from the time the first packet was sent or from the time the most recent (last) packet was seen.
- The SNMP index of the input interface. The interface for traffic entering the service module is based on the switch forwarding cache. This field is typically used in conjunction with datalink, IPv4, and IPv6 addresses, and provides the actual first-hop interface for directly connected hosts.
The following table describes NetFlow Lite collect parameters.
Command |
Purpose |
|---|---|
collect counter {bytes {long | permanent } | packets { long | permanent}} |
Collects the counter fields total bytes and total packets. |
collect flow {sampler} |
Collects the flow sampler identifier (ID). |
collect interface {input} |
Collects the fields from the input interface. |
collect timestamp sys-uptime {first | last} |
Collects the fields for the time the first packet was seen or the time the most recent packet was last seen (in milliseconds). |
collect transport tcp flags |
Flow Exporters
Flow exporters export the data in the flow monitor cache to a remote system, such as a server running NetFlow collector, for analysis and storage. Flow exporters are created as separate entities in the configuration. Flow exporters are assigned to flow monitors to provide data export capability for the flow monitors. You can create several flow exporters and assign them to one or more flow monitors to provide several export destinations. You can create one flow exporter and apply it to several flow monitors.
NetFlow Data Export Format Version 9
The basic output of NetFlow is a flow record. Several different formats for flow records have evolved as NetFlow has matured. The most recent evolution of the NetFlow export format is known as Version 9. The distinguishing feature of the NetFlow Version 9 export format is that it is template-based. Templates provide an extensible design to the record format, a feature that should allow future enhancements to NetFlow services without requiring concurrent changes to the basic flow-record format. Using templates provides several key benefits:
- Third-party business partners who produce applications that provide collector or display services for NetFlow do not have to recompile their applications each time a new NetFlow feature is added. Instead, they should be able to use an external data file that documents the known template formats.
- New features can be added to NetFlow quickly without breaking current implementations.
- NetFlow is “future-proofed” against new or developing protocols because the Version 9 format can be adapted to provide support for them.
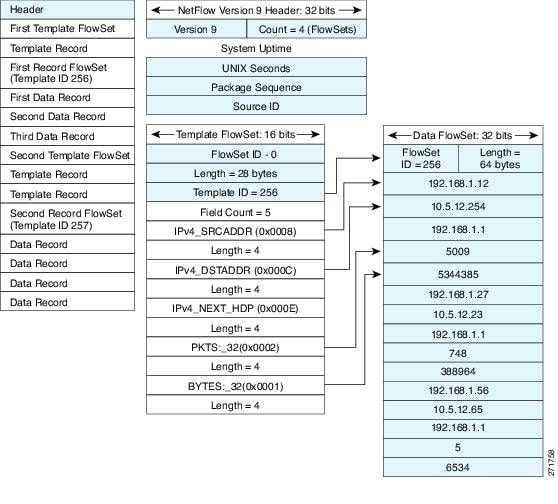
The Version 9 export format consists of a packet header followed by one or more template flow or data flow sets. A template flow set provides a description of the fields that will be present in future data flow sets. These data flow sets may occur later within the same export packet or in subsequent export packets. Template flow and data flow sets can be intermingled within a single export packet, as illustrated in the figure below.
NetFlow Version 9 will periodically export the template data so the NetFlow collector will understand what data is to be sent and also export the data flow set for the template. The key advantage to Flexible NetFlow is that the user configures a flow record, which is effectively converted to a Version 9 template and then forwarded to the collector. The figure below is a detailed example of the NetFlow Version 9 export format, including the header, template flow, and data flow sets.
For more information on the Version 9 export format, refer to the white paper titled Cisco IOS NetFlow Version 9 Flow-Record Format, available at this URL: http://www.cisco.com/en/US/tech/tk648/tk362/technologies_white_paper09186a00800a3db9.shtml.
Flow Monitors
Flow monitors are the Flexible NetFlow component that is applied to interfaces to perform network traffic monitoring.
Flow data is collected from the network traffic and added to the flow monitor cache during the monitoring process based on the key and nonkey fields in the flow record.
Flexible NetFlow can be used to perform different types of analysis on the same traffic. In the figure below, packet 1 is analyzed using a record designed for standard traffic analysis on the input interface and a record designed for security analysis on the output interface.
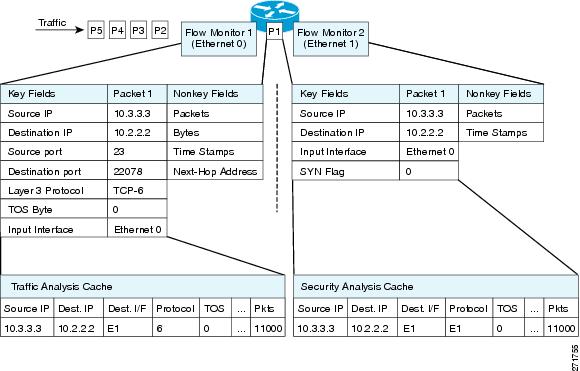
The figure below shows a more complex example of how you can apply different types of flow monitors with custom records.
There are three types of flow monitor caches. You change the type of cache used by the flow monitor after you create the flow monitor. The three types of flow monitor caches are described in the following sections:
Normal
The default cache type is “normal”. In this mode, the entries in the cache are aged out according to the timeout active and timeout inactive settings. When a cache entry is aged out, it is removed from the cache and exported via any exporters configured.
Permanent
A cache of type "permanent" never ages out any flows. A permanent cache is useful when the number of flows you expect to see is low and there is a need to keep long-term statistics on the router. For example, if the only key field in the flow record is the 8-bit IP ToS field, only 256 flows can be monitored. To monitor the long-term usage of the IP ToS field in the network traffic, you can use a permanent cache. Permanent caches are useful for billing applications and for an edge-to-edge traffic matrix for a fixed set of flows that are being tracked. Update messages will be sent periodically to any flow exporters configured according to the "timeout update" setting.
 Note | When a cache becomes full in permanent mode, new flows will not be monitored. If this occurs, a "Flows not added" message will appear in the cache statistics. |
Note | A permanent cache uses update counters rather than delta counters. This means that when a flow is exported, the counters represent the totals seen for the full lifetime of the flow and not the additional packets and bytes seen since the last export was sent. |
Flow Samplers
Flow samplers are created as separate components in a router’s configuration. Flow samplers are used to reduce the load on the device that is running NetFlow Lite by limiting the number of packets that are selected for analysis.
Samplers use random sampling techniques (modes); that is, a randomly selected sampling position is used each time a sample is taken.
Samplers use either random or deterministic sampling techniques (modes):
- Deterministic--The same sampling position is used each time a sample is taken.
- Random--A randomly selected sampling position is used each time a sample is taken.
Flow sampling exchanges monitoring accuracy for router performance. When you apply a sampler to a flow monitor, the overhead load on the router of running the flow monitor is reduced because the number of packets that the flow monitor must analyze is reduced. The reduction in the number of packets that are analyzed by the flow monitor causes a corresponding reduction in the accuracy of the information stored in the flow monitor’s cache.
Samplers are combined with flow monitors when they are applied to an interface with the ip flow monitor command.
Stacking
The switch supports homogeneous stacking, but does not support mixed stacking.
Each stack member has NetFlow information that operates as if they are a standalone switch. After entering a show CLI EXEC command, the master switch queries stack members to obtain their information. During an export, the member switches send the flow packets to the master switch, since member switches cannot route packets. Therefore, export always occurs from the master switch.
During a switchover, previous monitor configurations are not applied, and the new master switch synchronizes the configuration to all stack members. Member switches reapply the configuration on the respective stack members.
Default Settings
The following table lists the NetFlow Lite default settings for the switch.
Setting |
Default |
||
|---|---|---|---|
Flow active timeout |
1800 seconds
|
||
Flow timeout inactive |
Enabled, 30 seconds |
||
Flow update timeout |
1800 seconds |
||
Default cache size |
16640 bits |
How to Configure NetFlow Lite
To configure NetFlow Lite, follow these general steps:
- Create a flow record by specifying keys and non-key fields to the flow.
- Create an optional flow exporter by specifying the protocol and transport destination port, destination, and other parameters.
- Create a flow monitor based on the flow record and flow exporter.
- Create an optional sampler.
- Apply the flow monitor to a Layer 2 port, Layer 3 port, or VLAN.
- Configuring a Flow Record
- Creating a Flow Exporter
- Creating a Flow Monitor
- Applying a Flow to an Interface
- Creating a Flow Sampler
Configuring a Flow Record
Perform this task to configure a customized flow record.
Customized flow records are used to analyze traffic data for a specific purpose. A customized flow record must have at least one match criterion for use as the key field and typically has at least one collect criterion for use as a nonkey field.
There are hundreds of possible permutations of customized flow records. This task shows the steps that are used to create one of the possible permutations. Modify the steps in this task as appropriate to create a customized flow record for your requirements.
1.
enable
2.
configure
terminal
3.
flow
record
record-name
4.
description
description
5.
match
{ipv4 |
ipv6} {destination |
source}
address
6. Repeat Step 5 as required to configure additional key fields for the record.
7.
collect
interface
{input |
output}
8. Repeat Step 7 as required to configure additional nonkey fields for the record.
9.
end
10.
show
flow
record
record-name
11.
show
running-config
flow
record
record-name
DETAILED STEPS
| Command or Action | Purpose | |||
|---|---|---|---|---|
| Step 1 |
enable
Example: Device> enable |
Enables privileged EXEC mode. | ||
| Step 2 |
configure
terminal
Example: Device# configure terminal |
Enters global configuration mode. | ||
| Step 3 |
flow
record
record-name
Example: Device(config)# flow record FLOW-RECORD-1 |
Creates a flow record and enters Flexible NetFlow flow record configuration mode. | ||
| Step 4 |
description
description
Example: Device(config-flow-record)# description Used for basic traffic analysis |
(Optional) Creates a description for the flow record. | ||
| Step 5 |
match
{ipv4 |
ipv6} {destination |
source}
address
Example: Device(config-flow-record)# match ipv4 destination address |
| ||
| Step 6 | Repeat Step 5 as required to configure additional key fields for the record. |
— | ||
| Step 7 |
collect
interface
{input |
output}
Example: Device(config-flow-record)# collect interface input |
Configures the input interface as a nonkey field for the record.
| ||
| Step 8 | Repeat Step 7 as required to configure additional nonkey fields for the record. |
— | ||
| Step 9 |
end
Example: Device(config-flow-record)# end |
Exits Flexible NetFlow flow record configuration mode and returns to privileged EXEC mode. | ||
| Step 10 |
show
flow
record
record-name
Example: Device# show flow record FLOW_RECORD-1 |
(Optional) Displays the current status of the specified flow record. | ||
| Step 11 |
show
running-config
flow
record
record-name
Example: Device# show running-config flow record FLOW_RECORD-1 |
(Optional) Displays the configuration of the specified flow record. |
Creating a Flow Exporter
You can create a flow export to define the export parameters for a flow.
Note | Each flow exporter supports only one destination. If you want to export the data to multiple destinations, you must configure multiple flow exporters and assign them to the flow monitor. You can export to a destination using IPv4 address. |
2.
flow exporter
name
3.
description
string
4.
destination {ipv4-address}
[
vrf
vrf-name]
5.
dscp
value
6.
source { source type }
7.
transport
udp
number
8.
ttl
seconds
9.
export-protocol
{netflow-v9}
11.
show flow exporter
[name
record-name]
DETAILED STEPS
| Command or Action | Purpose | |
|---|---|---|
| Step 1 | configure
terminal
Example: Switch# configure terminal | |
| Step 2 | flow exporter
name
Example:
Switch(config)# flow exporter ExportTest
|
Creates a flow exporter and enters flow exporter configuration mode. |
| Step 3 | description
string
Example:
Switch(config-flow-exporter)# description ExportV9
|
(Optional) Describes this flow record as a maximum 63-character string. |
| Step 4 | destination {ipv4-address}
[
vrf
vrf-name]
Example:
Switch(config-flow-exporter)# destination 192.0.2.1 (IPv4 destination)
|
Sets the IPv4 destination address or hostname for this exporter. |
| Step 5 |
dscp
value
Example:
Switch(config-flow-exporter)# dscp 0
|
(Optional) Specifies the differentiated services codepoint value. The range is from 0 to 63. The default is 0. |
| Step 6 | source { source type }
Example:
Switch(config-flow-exporter)# source gigabitEthernet1/0/1
|
(Optional) Specifies the interface to use to reach the NetFlow collector at the configured destination. The following interfaces can be configured as source: |
| Step 7 | transport
udp
number
Example:
Switch(config-flow-exporter)# transport udp 200
|
(Optional) Specifies the UDP port to use to reach the NetFlow collector. The range is from 1 to 65536 |
| Step 8 | ttl
seconds
Example: Switch(config-flow-exporter)# ttl 210
|
(Optional) Configures the time-to-live (TTL) value for datagrams sent by the exporter. The range is from 1 to 255 seconds. The default is 255. |
| Step 9 |
export-protocol
{netflow-v9}
Example: Device(config-flow-exporter)# export-protocol netflow-v9 |
Specifies the version of the NetFlow export protocol used by the exporter. |
| Step 10 | end
Example: Switch(config-flow-record)# end | |
| Step 11 | show flow exporter
[name
record-name]
Example:
Switch show flow exporter ExportTest
|
(Optional) Displays information about NetFlow flow exporters. |
| Step 12 | copy
running-config startup-config
Example: Switch# copy running-config startup-config |
Define a flow monitor based on the flow record and flow exporter.
Creating a Flow Monitor
Perform this required task to create a customized flow monitor.
Each flow monitor has a separate cache assigned to it. Each flow monitor requires a record to define the contents and layout of its cache entries. These record formats can be a user-defined format. An advanced user can create a customized format using the flow record command.
If you want to use a customized record, you must create the customized record before you can perform this task. If you want to add a flow exporter to the flow monitor for data export, you must create the exporter before you can complete this task.
Note | You must use the no ip flow monitor command to remove a flow monitor from all of the interfaces to which you have applied it before you can modify the parameters for the record command on the flow monitor. For information about the ip flow monitor command, refer to the Cisco IOS Flexible NetFlow Command Reference. |
1.
enable
2.
configure
terminal
3.
flow
monitor
monitor-name
4.
description
description
5.
record
{record-name}
6.
cache
{entries
number |
timeout
{active |
inactive |
update}
seconds |
type {
normal
}
7. Repeat Step 6 as required to finish modifying the cache parameters for this flow monitor.
8.
exporter
exporter-name
9.
end
10.
show
flow
monitor
[[name]
monitor-name
[cache [format {csv |
record |
table}]]
]
11.
show
running-config
flow
monitor
monitor-name
DETAILED STEPS
| Command or Action | Purpose | |||
|---|---|---|---|---|
| Step 1 |
enable
Example:
Switch> enable
|
Enables privileged EXEC mode. | ||
| Step 2 |
configure
terminal
Example:
Switch# configure terminal
|
Enters global configuration mode. | ||
| Step 3 |
flow
monitor
monitor-name
Example:
Switch(config)# flow monitor FLOW-MONITOR-1
|
Creates a flow monitor and enters Flexible NetFlow flow monitor configuration mode. | ||
| Step 4 |
description
description
Example:
Switch(config-flow-monitor)# description Used for basic ipv4 traffic analysis
|
(Optional) Creates a description for the flow monitor. | ||
| Step 5 |
record
{record-name}
Example:
Switch(config-flow-monitor)# record FLOW-RECORD-1
|
Specifies the record for the flow monitor. | ||
| Step 6 |
cache
{entries
number |
timeout
{active |
inactive |
update}
seconds |
type {
normal
}
Example: Device(config-flow-monitor)# cache type normal |
(Optional) Modifies the flow monitor cache parameters such as timeout values, number of cache entries, and the cache type.
| ||
| Step 7 | Repeat Step 6 as required to finish modifying the cache parameters for this flow monitor. |
— | ||
| Step 8 |
exporter
exporter-name
Example:
Switch(config-flow-monitor)# exporter EXPORTER-1
|
(Optional) Specifies the name of an exporter that was created previously. | ||
| Step 9 |
end
Example:
Switch(config-flow-monitor)# end
|
Exits Flexible NetFlow flow monitor configuration mode and returns to privileged EXEC mode. | ||
| Step 10 |
show
flow
monitor
[[name]
monitor-name
[cache [format {csv |
record |
table}]]
]
Example:
Switch# show flow monitor FLOW-MONITOR-2 cache
|
(Optional) Displays the status for a Flexible NetFlow flow monitor. | ||
| Step 11 |
show
running-config
flow
monitor
monitor-name
Example:
Switch# show running-config flow monitor FLOW_MONITOR-1
|
(Optional) Displays the configuration of the specified flow monitor. | ||
| Step 12 | copy running-config startup-config
Example: Switch# copy running-config startup-config |
Applying a Flow to an Interface
You can apply a flow monitor and an optional sampler to an interface.
2.
interface
type
3.
{ip flow monitor |
ipv6 flow
monitor}name
[|sampler
name] { input |output
}
5.
show flow interface
[interface-type
number]
DETAILED STEPS
| Command or Action | Purpose | |
|---|---|---|
| Step 1 | configure
terminal
Example: Switch# configure terminal | |
| Step 2 | interface
type
Example:
Switch(config)# interface GigabitEthernet1/0/1
|
Enters interface configuration mode and configures an interface. Command parameters for the interface configuration include: Flexible Net Flow is supported only on the service module 1-Gigabit or 10-Gigabit Ethernet interfaces. You cannot attach a NetFlow monitor to a port channel interface. If both service module interfaces are part of an EtherChannel, you should attach the monitor to both physical interfaces. |
| Step 3 | {ip flow monitor |
ipv6 flow
monitor}name
[|sampler
name] { input |output
}
Example:
Switch(config-if)# ip flow monitor MonitorTest input
|
Associate an IPv4 or an IPv6 flow monitor, and an optional sampler to the interface for input or output packets. To monitor datalink L2 traffic flows, you would use datalink flow monitor name sampler sampler-name {input} interface command. This specific command associates a datalink L2 flow monitor and required sampler to the interface for input packets. When a datalink flow monitor is assigned to an interface or VLAN record, it only creates flows for non-IPv6 or non-IPv4 traffic. |
| Step 4 | end
Example: Switch(config-flow-monitor)# end | |
| Step 5 | show flow interface
[interface-type
number]
Example:
Switch# show flow interface
|
(Optional) Displays information about NetFlow on an interface. |
| Step 6 | copy
running-config startup-config
Example: Switch# copy running-config startup-config |
Creating a Flow Sampler
Perform this required task to configure and enable a flow sampler.
1.
enable
2.
configure
terminal
3.
sampler
sampler-name
4.
description
description
5.
mode
{random}
1
out-of
window-size
6.
exit
7.
interface
type
number
8. {ip | ipv6} flow monitor monitor-name [[sampler] sampler-name] {input | output}
9.
end
10.
show
sampler
sampler-name
DETAILED STEPS
| Command or Action | Purpose | |
|---|---|---|
| Step 1 |
enable
Example: Device> enable |
Enables privileged EXEC mode. |
| Step 2 |
configure
terminal
Example: Device# configure terminal |
Enters global configuration mode. |
| Step 3 |
sampler
sampler-name
Example: Device(config)# sampler SAMPLER-1 |
Creates a sampler and enters sampler configuration mode. |
| Step 4 |
description
description
Example: Device(config-sampler)# description Sample at 50% |
(Optional) Creates a description for the flow sampler. |
| Step 5 |
mode
{random}
1
out-of
window-size
Example: Device(config-sampler)# mode random 1 out-of 2 |
Specifies the sampler mode and the flow sampler window size. |
| Step 6 |
exit
Example: Device(config-sampler)# exit |
Exits sampler configuration mode and returns to global configuration mode. |
| Step 7 |
interface
type
number
Example: Device(config)# interface GigabitEthernet 0/0/0 |
Specifies an interface and enters interface configuration mode. |
| Step 8 | {ip |
ipv6}
flow
monitor
monitor-name
[[sampler]
sampler-name]
{input |
output}
Example: Device(config-if)# ip flow monitor FLOW-MONITOR-1 sampler SAMPLER-1 input |
Assigns the flow monitor and the flow sampler that you created to the interface to enable sampling. |
| Step 9 |
end
Example: Device(config-if)# end |
Exits interface configuration mode and returns to privileged EXEC mode. |
| Step 10 |
show
sampler
sampler-name
Example: Device# show sampler SAMPLER-1 |
Displays the status and statistics of the flow sampler that you configured and enabled. |
Monitoring NetFlow Lite
Command |
Purpose |
|---|---|
show flow record |
Displays the status of the flow records. |
show flow exporter exporter-name |
Displays the status of a flow exporter. |
show flow monitor monitor -name |
Displays the current status of a flow monitor. |
show flow interface interface-id |
Verifies that the NetFlow Lite is configured on the interface. |
show flow monitor name monitor -name cache |
Displays data in the flow monitor cache. |
show sampler sampler -name |
Displays the current status of a flow sampler. |
Configuration Examples for NetFlow Lite
- Example: Configuring a Flow
- Example: Configuring a Flow Exporter
- Example: Applying a Flow Monitor to an Interface
- Example: Adding a Sampler to a Flow Monitor When a Flow Monitor Is Already Enabled
- Example: Configuring and Enabling a Flow Sampler
Example: Configuring a Flow
This example shows how to create a flow and apply it to an interface:
Switch# configure terminal
Enter configuration commands, one per line. End with CNTL/Z.

Switch(config)# flow export export1
Switch(config-flow-exporter)# destination 10.0.101.254
Switch(config-flow-exporter)# transport udp 2055
Switch(config-flow-exporter)# exit
Switch(config)# flow record record1
Switch(config-flow-record)# match ipv4 source address
Switch(config-flow-record)# match ipv4 destination address
Switch(config-flow-record)# match ipv4 protocol
Switch(config-flow-record)# match transport source-port
Switch(config-flow-record)# match transport destination-port
Switch(config-flow-record)# collect counter byte long
Switch(config-flow-record)# collect counter packet long
Switch(config-flow-record)# collect timestamp absolute first
Switch(config-flow-record)# collect timestamp absolute last
Switch(config-flow-record)# exit
Switch(config)# flow monitor monitor1
Switch(config-flow-monitor)# record record1
Switch(config-flow-monitor)# exporter export1
Switch(config-flow-monitor)# exit
Switch(config)# interface tenGigabitEthernet 1/0/1
Switch(config-if)# ip flow monitor monitor1 input
Switch(config-if)# end
Example: Configuring a Flow Exporter
This example shows how to configure the flow exporter:
Switch(config)# flow exporter QoS-Collector
Switch(config-flow-exporter)# description QoS Collector Bldg 19
Switch(config-flow-exporter)# destination 172.20.244.28
Switch(config-flow-exporter)# source vlan 1
Switch(config-flow-exporter)# dscp 3
Switch(config-flow-exporter)# transport udp 2055
Switch(config-flow-exporter)# end
Example: Applying a Flow Monitor to an Interface
This example shows how to apply a flow monitor to an interface:
Switch(config)# interface gigabitethernet 1/1/2
Switch(config-if)# ip flow monitor FLOW-MONITOR-1 input
Switch(config-if)# end
Example: Adding a Sampler to a Flow Monitor When a Flow Monitor Is Already Enabled
The following example shows what happens when you try to add a sampler to a flow monitor that has already been enabled on an interface without a sampler:
Device(config)# interface GigabitEthernet 0/0/0
Device(config-if)# ip flow monitor FLOW-MONITOR-1 sampler SAMPLER-2 input
% Flow Monitor: Flow Monitor 'FLOW-MONITOR-1' is already on in full mode and cannot be enabled with a sampler.
The following example shows how to remove the flow monitor from the interface so that it can be enabled with the sampler:
Device(config)# interface GigabitEthernet 0/0/0
Device(config-if)# no ip flow monitor FLOW-MONITOR-1 input
Device(config-if)# ip flow monitor FLOW-MONITOR-1 sampler SAMPLER-2 input
Example: Configuring and Enabling a Flow Sampler
This example shows how to configure and enable a flow sampler:
Switch(config)# sampler SAMPLER-1
Switch(config-sampler)# description Sample at 50
Switch(config-sampler)# mode random 1 out-of 50
Switch(config-sampler)# exit
Switch(config)# interface gigabitethernet 1/1/2
Switch(config-if)# ip flow monitor FLOW-MONITOR-1 sampler SAMPLE-1 input
Additional References
Related Documents
| Related Topic | Document Title |
|---|---|
|
Flexible NetFlow CLI Commands |
Flexible NetFlow Command Reference, Cisco IOS XE Release 3SE (Cisco WLC 5700 Series) |
Error Message Decoder
| Description | Link |
|---|---|
|
To help you research and resolve system error messages in this release, use the Error Message Decoder tool. |
https://www.cisco.com/cgi-bin/Support/Errordecoder/index.cgi |
Standards and RFCs
| Standard/RFC | Title |
|---|---|
|
RFC 3954 |
Cisco Systems NetFlow Services Export Version 9 |
MIBs
| MIB | MIBs Link |
|---|---|
|
All supported MIBs for this release. |
To locate and download MIBs for selected platforms, Cisco IOS releases, and feature sets, use Cisco MIB Locator found at the following URL: |
Technical Assistance
| Description | Link |
|---|---|
|
The Cisco Support website provides extensive online resources, including documentation and tools for troubleshooting and resolving technical issues with Cisco products and technologies. To receive security and technical information about your products, you can subscribe to various services, such as the Product Alert Tool (accessed from Field Notices), the Cisco Technical Services Newsletter, and Really Simple Syndication (RSS) Feeds. Access to most tools on the Cisco Support website requires a Cisco.com user ID and password. |
Feature Information for Flexible NetFlow
Release |
Modification |
|---|---|
Cisco IOS 15.0(2)EX1 |
This feature was introduced. |
 Feedback