Cisco Video Surveillance Monitoring Workstation Profiler Tool, Release 7.x User Guide
Available Languages
Table of Contents
Using the Cisco Video Surveillance Monitoring Workstation Profiler Tool, Release 7
Installing the Profiler Tool and Sample Video Files
Understanding the Test Results
Creating Baseline and Operational Profiles
Using the Cisco Video Surveillance Monitoring Workstation Profiler Tool, Release 7
This guide describes how to use the Cisco Video Surveillance Workstation Profiler Tool (Profiler Tool) to analyze the ability of a PC client to render video using Cisco VSM 7.0 or higher.
Overview
The Cisco Video Surveillance Workstation Profiler Tool (Profiler Tool) is a stand-alone Windows utility that validates and predicts the ability of a PC client to render video.
Workstation hardware and software strongly affects the ability of a workstation to play video. The Profiler Tool characterizes your workstation’s hardware and software capabilities and limitations, allowing you to make the workstation adjustments that are optimal for your operational environment.
The Profiler Tool provides a consistent means of measuring not only how well the workstation can display video in general, but also how well it performs under different conditions.
To establish a baseline, you first run the Profiler Tool to take measurements right after the workstation is booted and no other applications have consumed system resources. Run the tool again during normal operation when other tools and applications are running.
Examining the differences in performance between the baseline and normal measurements allows you decide how to configure your workstation to strike the best balance between video rendering performance and operational convenience. For example, you may learn that you can continue to run a particular application you need to use because it does not have a major on performance, or you may learn that you need to run the application on a different system because it does have a major impact.
Overall, the Profiler Tool help your stream profiles and workstations that best fit together. You can eliminate issues before they occur and help troubleshoot problems that do occur.
What the Profiler Tool Does and Does Not Do
The Profiler Tool is designed to perform specific tests.
- Summarize the workstation hardware and software attributes.
- Tell the ability of the workstation to successfully display a variety of video clips from different codecs and multiple panes.
- Identify issues or possible causes of concern that may affect the workstation’s ability to render video.
See the “Caveats” section for more information.
System Requirements
You can download and run the Profiler Tool on any PC that meets the system requirements described in the Cisco Video Surveillance Monitoring Workstation Performance Baseline Specification.
After running initial baseline and operational tests, compare the results to determine whether you need to modify the workstation’s operational configuration to improve performance.
Restrictions for Laptops With i3 or i5 Processors
Computers with Intel i3 or i5 processors experience poor performance when running 5x5 video views, including high CPU usage and low frames per second. x5 layouts may be skipped when running the Profiler Tool on these computers.
Summary Steps
Download and extract the Profiler Tool and sample video files. Note The sample video files are placed in the Profiles directory in the same location as the Profiler Tool. |
See the “Installing the Profiler Tool and Sample Video Files” section. 
|
|
Double click ProfilerTool.exe and choose Tools > Start Profiler to run a workstation test. |
See the “Running a Profile Test” section. 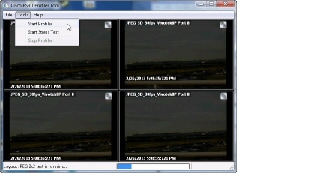
|
|
Wait for the test to complete and the |
See the “Running a Profile Test” section to understand how long the test can take. |
|
Review the test report to identify system performance, system requirements and other possible issues that impact performance. |
See the “Understanding the Test Results” section. 
|
Installing the Profiler Tool and Sample Video Files
The Profiler Tool is distributed in a .ZIP archive file that contains the ProfilerTool.exe executable file.
The Profiler Tool tests the workstation capabilities by playing the video files that are added to the “Profiles” directory located in the same directory as the Profiler Tool
- The sample video files must downloaded and extracted to the “Profiles” directory (located in the same directory as the Profiler Tool), as shown in Figure 1.
- Sample files are available in the H264, H264HD, JPEG, MPEG formats and include 1x1, 2x2, 3x3 and 4x4 layouts. Download and extract the file formats required for testing by your deployment
- We recommend including all 4 layouts for complete workstation analysis.
- Any missing file formats or layouts are skipped and not included in the results. See the “Understanding the Test Results” section.
Figure 1 Sample Video Files in the “Profiles” Directory

Step 1![]() Use a web browser to access the Cisco Video Surveillance Manager product page.
Use a web browser to access the Cisco Video Surveillance Manager product page.
Step 2![]() Click Download Software.
Click Download Software.
Step 3![]() Select Video Surveillance Manager Stand-alone Tools.
Select Video Surveillance Manager Stand-alone Tools.
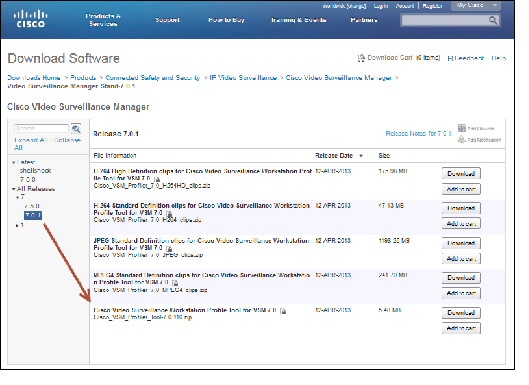
Step 4![]() Select Release 7.0.1 (Figure 2).
Select Release 7.0.1 (Figure 2).
Figure 2 Profiler Tool Download Page
Step 5![]() Download the “Cisco Video Surveillance Workstation Profile Tool” and extract it to a local directory, such as \
Download the “Cisco Video Surveillance Workstation Profile Tool” and extract it to a local directory, such as \ ProfilerTool.
Step 6![]() Download and extract the “Profile Tool Clips” to the same directory (Figure 3).
Download and extract the “Profile Tool Clips” to the same directory (Figure 3).
Figure 3 Profiler Tool Directory
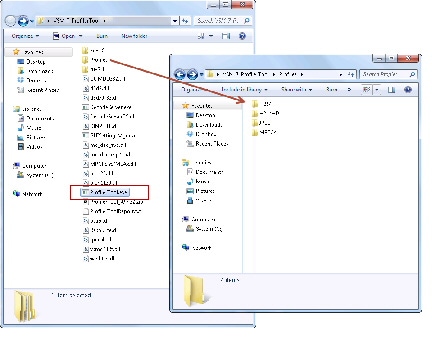

Note![]() Each of the “Profile” video sample codecs (H264, H264HD, JPEG, MPEG4) includes a set of video files in 1x1, 2x2, 3x3 and 4x4 layouts. These files are used by the Profiler Tool to analyze the ability of your workstation to process video. Include the codecs required by your deployment. Any missing files are skipped.
Each of the “Profile” video sample codecs (H264, H264HD, JPEG, MPEG4) includes a set of video files in 1x1, 2x2, 3x3 and 4x4 layouts. These files are used by the Profiler Tool to analyze the ability of your workstation to process video. Include the codecs required by your deployment. Any missing files are skipped.
Running a Profile Test
There are two profile tests: a regular test that skips the remaining layouts for a codec if any layout tests fails, and the Stress test that tests all layouts for all codecs.
Step 1![]() Determine if you want to test the workstation in baseline or operational mode.
Determine if you want to test the workstation in baseline or operational mode.
See the “Creating Baseline and Operational Profiles” section.
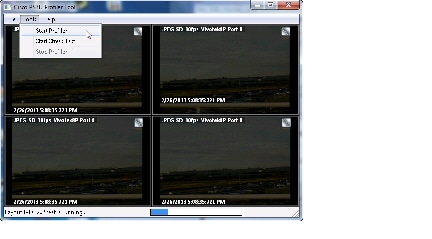
Step 2![]() Launch the
Launch the ProfilerTool.exe from the directory where you extracted the tool and video profiles (Figure 3).
Step 3![]() Click Tools and start the test as described in Table 2 (see also Figure 4):
Click Tools and start the test as described in Table 2 (see also Figure 4):
Note![]() Any missing file format or layout directory is skipped. For example, if the MPEG4 directory is missing, the test proceeds to H264 after completing JPEG. If the 2x2 layout in JPEG directory is missing, the test proceeds to the JPEG 3x3 layout after completing 1x1.
Any missing file format or layout directory is skipped. For example, if the MPEG4 directory is missing, the test proceeds to H264 after completing JPEG. If the 2x2 layout in JPEG directory is missing, the test proceeds to the JPEG 3x3 layout after completing 1x1.
Runs each of the video profiles in succession for 1 minute.
Note A failed test occurs when CPU usage is over 90% or frames-per-second (fps) is 20% below the target frame rate. For example, a fps 30 video clip has a pass threshold of 24 fps. See the “Understanding the Test Results” section. |
||
All video profiles included in the Profiles folder are run even if one or more clips fails. For example, if the 1x1 H264HD video clip fails, the Profiler Tool still tests the remaining H264HD layouts (2x2, 3x3, and 4x4), allowing you to view the results for each test. |
||
Stop a running profile test. Incomplete results will be displayed in the |
Step 4![]() Wait for all tests to complete.
Wait for all tests to complete.
- The test for each layout takes 1 minute to complete.
- Each codec (JPEG, MPEG4, H264, H264HD) includes video clips for four layouts: 1x1, 2x2, 3x3, and 4x4. It takes 16 minutes for all tests to run. Less time is required if a tests fails using the regular test (since additional layouts for that codec are skipped) or if you choose Stop Profiler before testing is complete.
Step 5![]() Continue to “Understanding the Test Results”.
Continue to “Understanding the Test Results”.
Understanding the Test Results
The test results are displayed in the ProfilerToolReport.txt file that is automatically created at the end of the test. The report includes three major sections:

Tip![]() The
The ProfilerToolReport.txt report is automatically created and saved to the Profiler Tool directory. Choose File > Save As to save the file to another name to compare against additional tests.
The Profiler Tool measures successful playback for a given video pane using the following criteria:
- The pane can successfully access the video file
- The pane can successfully play the video file
- The pane can successfully render at least 80% of the nominal video frame rate
- CPU usage is under 90%
Additional criterion for layout success:
Note ●![]() If a layout fails, all subsequent layouts for that profile are skipped unless you selected the Stress Test.
If a layout fails, all subsequent layouts for that profile are skipped unless you selected the Stress Test.
- Any missing or mis-named directories or sample video files are skipped and not included in the results. See the “Installing the Profiler Tool and Sample Video Files” section for more information.
Tip![]() See the “Caveats” section for more information.
See the “Caveats” section for more information.
System Profile
Review the system profile at the top of the ProfilerToolReport.txt output to verify that the workstation meets the basic system requirements. Compare the system profile with the requirements described in the Cisco Video Surveillance Monitoring Workstation Performance Baseline Specification.
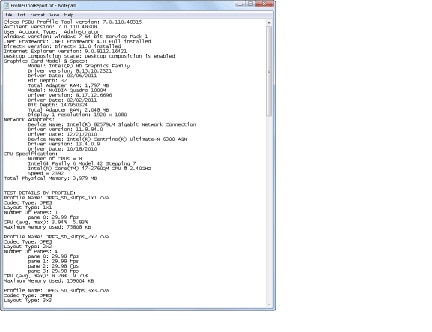
The following example shows the system profile included at the top of the ProfilerToolReport.txt output:
Review this information to verify that the workstation supports the specification in the Cisco Video Surveillance Monitoring Workstation Performance Baseline Specification.
Test Details By Profile
The test results are shown for each “Profile Name”, which is the video file being tested.
Note ●![]() If a layout fails, all subsequent layouts for that profile are skipped unless you selected the Stress Test.
If a layout fails, all subsequent layouts for that profile are skipped unless you selected the Stress Test.
- Any missing or mis-named directories or sample video files are skipped and not included in the results. See the “Installing the Profiler Tool and Sample Video Files” section for more information.
The following example shows the test results for the JPEG_SD_30fps_1x1.cva standard-definition JPEG video file that should play at 30 frame per second in a 1x1 layout (meaning there is only a single pane of video). These results show the fps that actually played for this video layout, the percentage of CPU processing capacity consumed during the playback, and the amount of memory used during the playback.
The following table describes each field in the profile results.
The number of video panes included in the layout. For example, a 1x1 layout includes a single video pane. A 4x4 layout included 16 video panes. |
|
The frames-per-second (fps) that actually played for each video pane in the layout. The following successful test shows a 2x2 layout with 4 video panes: The pane must successfully render at least 80% of the nominal video frame rate for the test to pass. If the test fails, the remaining layouts for the codec are skipped, unless you choose the Stress Test option (see the “Running a Profile Test” section for more information). In the following example, the test fails because the frame rate for one or more panes is below 80% of the nominal 30 fps for the clip. |
|
The average and maximum amount of CPU processing capacity used during the test. A failed test occurs if the CPU usage is over 90%. The following successful test shows a CPU average and maximum of only 7.57% and 9.16%. The following failed test, however, shows a maximum CPU usage of over 99%. The remaining layouts for the codec will be skipped unless you choose the Stress Test option (see the “Running a Profile Test” section for more information). |
|
The maximum amount of memory used during the text of the video file (in KB). |
Issues
The ISSUES section at the end of the report displays issues that should be addressed to improve performance. For example:
Issues include possible items flagged by the system that may or may not impact system performance and test results.
–![]() 6 months = marginally out of date
6 months = marginally out of date
–![]() 1 year = significantly out of date
1 year = significantly out of date
–![]() 2+ years = extremely out of date
2+ years = extremely out of date
See the “System Requirements” section for more information.
Creating Baseline and Operational Profiles
We strongly recommend that you take a baseline profile of your system to determine an upper bound on the ability of your workstation to play video. The baseline profile is taken with all applications and services that are not essential to run your system turned off, and then saved for later reference.
You can then turn on the applications and services again and run profiles again. If the measurements you get are significantly lower than the baseline, you can turn non-critical applications and services off selectively until you are able to achieve acceptable measurements.
In particular, note that following applications and services may have a significant impact on performance:
- Backup, restoring, and archiving processes
- Anti-virus software
- Any other software that requires significant processor resources
Note![]() Firewalls do not affect performance and do not need to be turned off for the baseline measurements.
Firewalls do not affect performance and do not need to be turned off for the baseline measurements.
To create a baseline or operational profile, follow these steps:
Step 1![]() Gather any sample profile clips that you want to use as part of the baseline profile.
Gather any sample profile clips that you want to use as part of the baseline profile.
Step 2![]() Log into your workstation as administrator.
Log into your workstation as administrator.
Step 3![]() Turn off applications and services:
Turn off applications and services:
–![]() If you are running a baseline profile, turn off all applications and services that are not essential to running your workstation, and reboot your system.
If you are running a baseline profile, turn off all applications and services that are not essential to running your workstation, and reboot your system.
–![]() If you are running an operational profile, turn off all the applications that are not needed for normal operation, and reboot your system.
If you are running an operational profile, turn off all the applications that are not needed for normal operation, and reboot your system.
Step 4![]() Extract all the contents of the Profiler Tool
Extract all the contents of the Profiler Tool.ZIP archive (see the “Installing the Profiler Tool and Sample Video Files” section).
Step 5![]() Complete the profile test as described in the “Running a Profile Test” section.
Complete the profile test as described in the “Running a Profile Test” section.
Step 6![]() Interpret the test results as described in the “Understanding the Test Results” section.
Interpret the test results as described in the “Understanding the Test Results” section.
Step 7![]() (Optional) Click Save As and save the results to a text file.
(Optional) Click Save As and save the results to a text file.
Step 8![]() (Optional) Revise the workstation hardware or software attributes to align with the requirements defined in the Cisco Video Surveillance Monitoring Workstation Performance Baseline Specification.
(Optional) Revise the workstation hardware or software attributes to align with the requirements defined in the Cisco Video Surveillance Monitoring Workstation Performance Baseline Specification.
Step 9![]() (Optional) Repeat this procedures to compare the results with the previous test.
(Optional) Repeat this procedures to compare the results with the previous test.
Caveats
Many factors combine in complex ways to produce the quality of experience for displayed video. Because the Profiler Tool is a stand-alone utility that uses local clip files, it cannot guarantee that video streams over the network will play properly. It cannot determine the visual quality of video; therefore, it displays video for you to examine visually while the test are running.
The following specific factors are outside the measurement and prediction scope of the Profiler Tool.
- Cannot alter the CPU usage on your workstation. To improve performance, you must make hardware or software adjustments based on the baseline and operational test results.
- Cannot validate video quality.
- Does not determine the smoothness of play back.
- Does not report number of dropped frames.
- Cannot evaluate network throughput.
- Only.CVA video files are supported. The Profiler Tool does not test video from other formats.
- Can estimate, but not calculate precisely, the overall performance within a Operations Manager interface running in a browser.
- Cannot predict interactions with applications that are not part of the test.
- Can save test result details only for the currently completed test.
Sample Test Results
The following sample test results include a summary of the test results, workstation details, possible issues that may affect video performance, and detailed test results. See the “Understanding the Test Results” section for more information.
Related Documentation
- Cisco Video Surveillance Monitoring Workstation Performance Baseline Specification
- See the Cisco Video Surveillance 7 Documentation Roadmap for descriptions and links to Cisco Video Surveillance documentation, server and storage platform documentation, and other related documentation.
Cisco and the Cisco logo are trademarks or registered trademarks of Cisco and/or its affiliates in the U.S. and other countries. To view a list of Cisco trademarks, go to this URL: www.cisco.com/go/trademarks. Third-party trademarks mentioned are the property of their respective owners. The use of the word partner does not imply a partnership relationship between Cisco and any other company. (1110R)
Any Internet Protocol (IP) addresses and phone numbers used in this document are not intended to be actual addresses and phone numbers. Any examples, command display output, network topology diagrams, and other figures included in the document are shown for illustrative purposes only. Any use of actual IP addresses or phone numbers in illustrative content is unintentional and coincidental.
 Feedback
Contact Cisco
- Open a Support Case

- (Requires a Cisco Service Contract)