Assessing Traffic Utilization
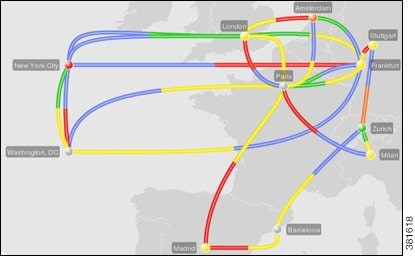
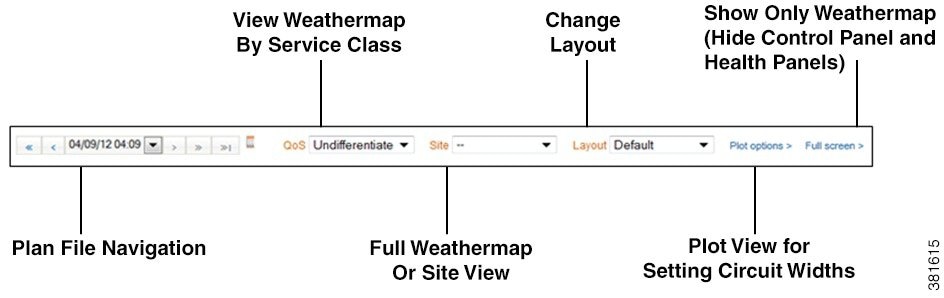
WAE Live offers multiple ways to quickly assess network health. The most immediate way is to look at the color of the interfaces, nodes, and sites in the weathermap and to look at the color of the peer icons in the Peering health panel. These colors represent the outbound traffic utilization on the interface. If parallel circuits1 have been grouped, these utilizations represent the average of the grouped interfaces.
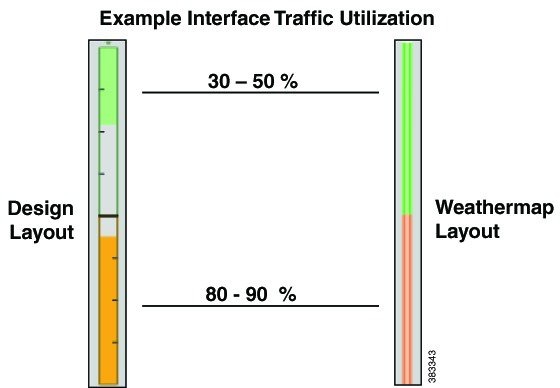
Default utilization colors depends on how your administrator set up the visualization of the plan file. This visualization might be either in a Design or Weathermap color scheme. Default colors are blue, green, yellow, orange, red, and purple (Design) or magenta (Weathermap), and sequentially each of these colors represents increased utilization.
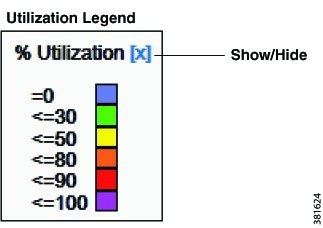
Note these colors are configurable in the WAE Design GUI where the administrator creates the template for the WAE Live plan files. The utilization legend at the bottom of the weathermap identifies the template’s utilization colors and their values.
Peering Health Panel
The Peering health panel is based on BGP information. It shows the highest traffic utilization per peer and per site. This panel lets you monitor critical peers and their growth so that you can quickly detect and overcome congestion issues.
The far left column lists the peers, while each top column lists the associated sites. The icons represent the traffic flowing between the two. While the color gives you a visual indication of traffic, hovering the mouse over each icon lists the numeric values.

To navigate to graphs for all interfaces connected to that peer, click the icon. Graphs appear for only those interfaces connecting this peer on its associated site. To go to the associated Explore page for these interfaces, click the All Interfaces link at the top of the graphs.
 Note |
The administrator can configure this panel name to something other than “Peering.” |
Events Health Panel
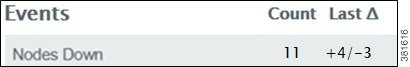
The Events health panel lists the number of current events and the number of changes since the last plan file was received.
-
Event—The event being tracked. The default set is as follows, though these can be configured differently.
-
Circuits down
-
Nodes down
-
Interfaces errors/drops
-
External (peering) interfaces over 80%
-
Internal (non-peering) interfaces over 80%
-
-
Count—The number of objects of that event type.
Example: If there are 10 nodes total that are down, the Nodes Down Count is 10.
-
Last Delta—How many objects have changed their state since the last snapshot was taken.
Example: If 4 nodes came up since the last snapshot, and 3 nodes went down, the Last Delta column would show +4/-3. Note, if the Count was previously 10, it would now be 11.
Note |
The administrator can configure this panel name to something other than “Events” and can configure a different set of events to appear in this panel. |
Navigating to Related Explore Information
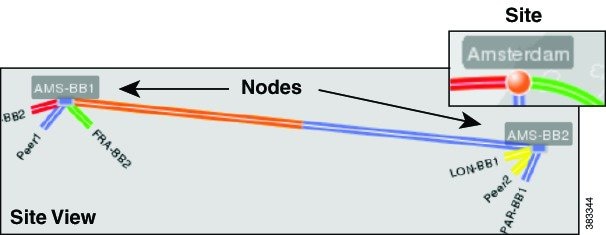
From a weathermap, you can navigate to related Explore information for nodes and interfaces. Note that regardless of the plan file date, the resulting Explore information is the most recent. For more information on Explore capabilities, see Exploring Network Data .
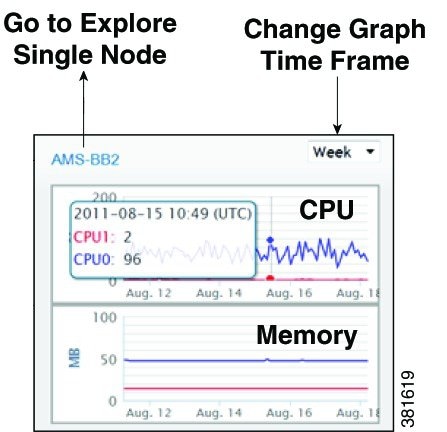
Graphing Node CPU and Memory Usage
To graph node CPU and memory usage, click its parent site. From here you can graph usage for this particular node, or you can go to the Explore tables for one or more nodes in the site.
|
Graph Node CPU and Memory Usage |
View Node Tables |
|---|---|
|
Click a node in the site view.
|
|
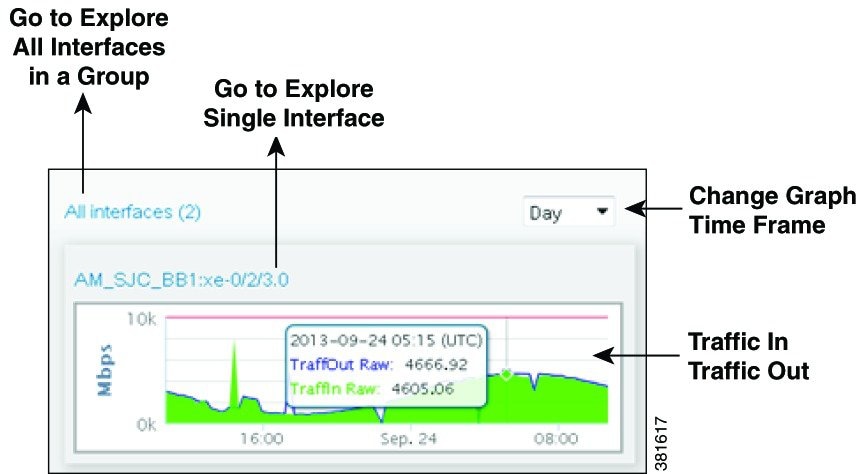
Graphing Interface Traffic In/Traffic Out
To graph the traffic coming into an interface and leaving it, click the interface. The height of the interface is in relationship to the capacity so you can see how close the interface is to being filled. If the weathermap is displaying an interface group, all interfaces within it appear in the graph.
From here you can go to the Explore tables for one or more interfaces in the group by clicking on name of the interface.
|
Graph Interface Traffic In/Traffic Out |
View Interface Tables |
|---|---|
|
Click an interface or set of grouped interfaces. (Interfaces with a common source and destination are sometimes grouped in the template to improve visualization.) A single interface and grouped interfaces look the same in the weathermap.
|
|
 Feedback