The documentation set for this product strives to use bias-free language. For the purposes of this documentation set, bias-free is defined as language that does not imply discrimination based on age, disability, gender, racial identity, ethnic identity, sexual orientation, socioeconomic status, and intersectionality. Exceptions may be present in the documentation due to language that is hardcoded in the user interfaces of the product software, language used based on RFP documentation, or language that is used by a referenced third-party product. Learn more about how Cisco is using Inclusive Language.
During the Cisco NFVI deployment, SSH public keys for each node are added to .../.ssh/authorized_keys, so you should be able
to log in from the build node into each of the Cisco NFVI nodes without passwords. If, for some reason you do need account
information, see the openstack-configs/secrets.yaml file on the build node.
Enter the ip a command to get a list of all interfaces on the node:
[root@j11-control-server-1 ~]# ip a
1: lo: <LOOPBACK,UP,LOWER_UP> mtu 65536 qdisc noqueue state UNKNOWN
    link/loopback 00:00:00:00:00:00 brd 00:00:00:00:00:00
    inet 127.0.0.1/8 scope host lo
       valid_lft forever preferred_lft forever
2: enp8s0: <BROADCAST,MULTICAST,UP,LOWER_UP> mtu 1500 qdisc mq state UP qlen 1000
    link/ether 54:a2:74:7d:42:1d brd ff:ff:ff:ff:ff:ff
3: enp9s0: <BROADCAST,MULTICAST,UP,LOWER_UP> mtu 1500 qdisc mq state UP qlen 1000
    link/ether 54:a2:74:7d:42:1e brd ff:ff:ff:ff:ff:ff
4: mx0: <BROADCAST,MULTICAST,SLAVE,UP,LOWER_UP> mtu 1500 qdisc mq master mx state UP qlen 1000
    link/ether 54:a2:74:7d:42:21 brd ff:ff:ff:ff:ff:ff
5: mx1: <BROADCAST,MULTICAST,SLAVE,UP,LOWER_UP> mtu 1500 qdisc mq master mx state UP qlen 1000
    link/ether 54:a2:74:7d:42:21 brd ff:ff:ff:ff:ff:ff
6: t0: <BROADCAST,MULTICAST,SLAVE,UP,LOWER_UP> mtu 1500 qdisc mq master t state UP qlen 1000
    link/ether 54:a2:74:7d:42:23 brd ff:ff:ff:ff:ff:ff
7: t1: <BROADCAST,MULTICAST,SLAVE,UP,LOWER_UP> mtu 1500 qdisc mq master t state UP qlen 1000
    link/ether 54:a2:74:7d:42:23 brd ff:ff:ff:ff:ff:ff
8: e0: <BROADCAST,MULTICAST,SLAVE,UP,LOWER_UP> mtu 1500 qdisc mq master e state UP qlen 1000
    link/ether 54:a2:74:7d:42:25 brd ff:ff:ff:ff:ff:ff
9: e1: <BROADCAST,MULTICAST,SLAVE,UP,LOWER_UP> mtu 1500 qdisc mq master e state UP qlen 1000
    link/ether 54:a2:74:7d:42:25 brd ff:ff:ff:ff:ff:ff
10: p0: <BROADCAST,MULTICAST,SLAVE,UP,LOWER_UP> mtu 1500 qdisc mq master p state UP qlen 1000
    link/ether 54:a2:74:7d:42:27 brd ff:ff:ff:ff:ff:ff
11: p1: <BROADCAST,MULTICAST,SLAVE,UP,LOWER_UP> mtu 1500 qdisc mq master p state UP qlen 1000
    link/ether 54:a2:74:7d:42:27 brd ff:ff:ff:ff:ff:ff
12: a0: <BROADCAST,MULTICAST,SLAVE,UP,LOWER_UP> mtu 1500 qdisc mq master a state UP qlen 1000
    link/ether 54:a2:74:7d:42:29 brd ff:ff:ff:ff:ff:ff
13: a1: <BROADCAST,MULTICAST,SLAVE,UP,LOWER_UP> mtu 1500 qdisc mq master a state UP qlen 1000
    link/ether 54:a2:74:7d:42:29 brd ff:ff:ff:ff:ff:ff
14: bond0: <BROADCAST,MULTICAST,MASTER> mtu 1500 qdisc noop state DOWN
    link/ether 4a:2e:2a:9e:01:d1 brd ff:ff:ff:ff:ff:ff
15: a: <BROADCAST,MULTICAST,MASTER,UP,LOWER_UP> mtu 1500 qdisc noqueue master br_api state UP
    link/ether 54:a2:74:7d:42:29 brd ff:ff:ff:ff:ff:ff
16: br_api: <BROADCAST,MULTICAST,UP,LOWER_UP> mtu 1500 qdisc noqueue state UP
    link/ether 54:a2:74:7d:42:29 brd ff:ff:ff:ff:ff:ff
17: e: <BROADCAST,MULTICAST,MASTER,UP,LOWER_UP> mtu 1500 qdisc noqueue state UP
    link/ether 54:a2:74:7d:42:25 brd ff:ff:ff:ff:ff:ff
18: mx: <BROADCAST,MULTICAST,MASTER,UP,LOWER_UP> mtu 1500 qdisc noqueue master br_mgmt state UP
    link/ether 54:a2:74:7d:42:21 brd ff:ff:ff:ff:ff:ff
19: br_mgmt: <BROADCAST,MULTICAST,UP,LOWER_UP> mtu 1500 qdisc noqueue state UP
    link/ether 54:a2:74:7d:42:21 brd ff:ff:ff:ff:ff:ff
    inet 10.23.221.41/28 brd 10.23.221.47 scope global br_mgmt
       valid_lft forever preferred_lft forever
20: p: <BROADCAST,MULTICAST,MASTER,UP,LOWER_UP> mtu 1500 qdisc noqueue state UP
    link/ether 54:a2:74:7d:42:27 brd ff:ff:ff:ff:ff:ff
21: t: <BROADCAST,MULTICAST,MASTER,UP,LOWER_UP> mtu 1500 qdisc noqueue state UP
    link/ether 54:a2:74:7d:42:23 brd ff:ff:ff:ff:ff:ff
    inet 17.16.3.8/24 brd 17.16.3.255 scope global t
       valid_lft forever preferred_lft forever
22: docker0: <NO-CARRIER,BROADCAST,MULTICAST,UP> mtu 1500 qdisc noqueue state DOWN
    link/ether 02:42:70:f6:8b:da brd ff:ff:ff:ff:ff:ff
    inet 172.17.42.1/16 scope global docker0
       valid_lft forever preferred_lft forever
24: mgmt-out@if23: <BROADCAST,MULTICAST,UP,LOWER_UP> mtu 1500 qdisc pfifo_fast master br_mgmt state UP qlen 1000
    link/ether 5a:73:51:af:e5:e7 brd ff:ff:ff:ff:ff:ff link-netnsid 0
26: api-out@if25: <BROADCAST,MULTICAST,UP,LOWER_UP> mtu 1500 qdisc pfifo_fast master br_api state UP qlen 1000
    link/ether 6a:a6:fd:70:01:f9 brd ff:ff:ff:ff:ff:ff link-netnsid 0
List all of the network bond configuration files in the /proc/net/bonding/ directory:
[root@j11-control-server-1 ~]# ls /proc/net/bonding/
a  bond0  e  mx  p  t
Step 3
To view more information about a particular bond configuration, enter:
[root@j11-control-server-1 ~]# more /proc/net/bonding/a
Ethernet Channel Bonding Driver: v3.7.1 (April 27, 2011)

Bonding Mode: load balancing (xor)
Transmit Hash Policy: layer3+4 (1)
MII Status: up
MII Polling Interval (ms): 100
Up Delay (ms): 0
Down Delay (ms): 0

Slave Interface: a0
MII Status: up
Speed: 10000 Mbps
Duplex: full
Link Failure Count: 1
Permanent HW addr: 54:a2:74:7d:42:29
Slave queue ID: 0

Slave Interface: a1
MII Status: up
Speed: 10000 Mbps
Duplex: full
Link Failure Count: 2
Permanent HW addr: 54:a2:74:7d:42:2a
Slave queue ID: 0
Viewing Cisco NFVI Node Route Information
Complete the following steps to view Cisco NFVI node route information. Note that this is not the HAProxy container running
on the controller. The default gateway should point to the gateway on the management network using the br_mgmt bridge.
Procedure
Step 1
SSH into the target node, for example, one of the Cisco VIM controllers:
View the routing table (verify the default gateway) of the Cisco NFVI node:
[root@j11-control-server-1 ~]# route -n
Kernel IP routing table
Destination     Gateway         Genmask         Flags Metric Ref    Use Iface
0.0.0.0         10.23.221.33    0.0.0.0         UG    0      0        0 br_mgmt
10.23.221.32    0.0.0.0         255.255.255.240 U     0      0        0 br_mgmt
17.16.3.0       0.0.0.0         255.255.255.0   U     0      0        0 t
169.254.0.0     0.0.0.0         255.255.0.0     U     1016   0        0 br_api
169.254.0.0     0.0.0.0         255.255.0.0     U     1017   0        0 e
169.254.0.0     0.0.0.0         255.255.0.0     U     1019   0        0 br_mgmt
169.254.0.0     0.0.0.0         255.255.0.0     U     1020   0        0 p
169.254.0.0     0.0.0.0         255.255.0.0     U     1021   0        0 t
172.17.0.0      0.0.0.0         255.255.0.0     U     0      0        0 docker0
Viewing Linux
Network Namespace Route Information
Complete the
following steps to view the route information of the Linux network namespace
that the HAProxy container uses on a Cisco NFVI controller node. The default
gateway should point to the gateway on the API network using the API interface
in the Linux network namespace.
Procedure
Step 1
SSH into the
target node, for example, one of the Cisco VIM controllers:
Enter the
ip
netns command to find the name of the network namespace:
[root@j11-control-server-2 ~]# ip netns 17550 (id: 0)
Step 3
Enter the
ip netns
exec command to view the routing table (verify the default gateway)
of the Linux network namespace:
[root@j11-control-server-2 ~]# ip netns exec 17550 route -n
Kernel IP routing table
Destination     Gateway         Genmask         Flags Metric Ref    Use Iface
0.0.0.0         172.29.86.1     0.0.0.0         UG    0      0        0 api
10.23.221.32    0.0.0.0         255.255.255.240 U     0      0        0 mgmt
172.29.86.0     0.0.0.0         255.255.255.0   U     0      0        0 api
Prior to Remove
Storage Operation
Upon completion of
the pod management operations such as add-storage, the operator needs to ensure
that any subsequent operation such as remove-storage on the same storage node
is done after accounting for all of the devices and their corresponding OSDs
have been marked in the persistent crush map as shown in the output of the ceph
osd crush tree.
Execute the following
command on the storage node where a remove-storage pod operation is performed,
to get a list of all the devices configured for ceph osds:
Login to any of the
controller nodes and run the following commands within the ceph mon container:
$ cephmon
$ ceph osd crush tree
From the json output,
locate the storage node to be removed and ensure all of the devices listed for
ceph osds have corresponding osd entries for them by running the following
commands:
The following topics
provide Cisco NFVI general troubleshooting procedures.
Container Download Problems
Check installer
logs log file /var/log/mercury/mercury_buildorchestration.log for any build
node orchestration failures including stuck "registry-Populate local registry".
In some cases, the Docker container download from your management node might be
slow.
Check the network
connectivity between the management node and the remote registry in
defaults.yaml on the management node (grep "^registry:"
openstack-configs/defaults.yaml).
Verify valid
remote registry credentials are defined in setup_data.yaml file.
A proxy server
might be needed to pull the container images from remote registry. If a proxy
is required, exclude all IP addresses for your setup including management node.
PXE Boot Problems
Check log file
/var/log/mercury/mercury_baremetal_install.log and connect to failing node CIMC
KVM console to find out more on PXE boot failure reason.
Ensure all
validations (step 1) and hardware validations (step 3) pass.
Check the
kickstart file used in setup_data.yaml for controller, compute, and storage
nodes and that matches with the hardware of corresponding nodes.
Check the Cobbler
web interface to see all the configured systems got populated:
Check that the
gateway of management/provision network is not the same as that of management
interface IP address of the management node.
Check L2/L3
network connectivity between the failing node and the management node. Also,
check the VPC configuration and port-channel status.
Check that the
actual PXE boot order is not different from the configured boot-order.
Check that PXE
(DHCP/TFTP) packets arrive at the management node by performing tcpdump on
management interface and looking for UDP 67 or UDP 69 port.
Check that HTTP
request reaches management node by performing tcpdump on management node
management interface on TCP 80 and TCP 443 port. Also check the Docker logs for
HTTP request from the failing node: docker exec -it repo_mirror tail -f
/var/log/httpd/access_log.
Verify all nodes
are running on supported Cisco NFVI CIMC firmware or above.
There are times
(especially on redeployment) when the overcloud nodes (controller or compute)
for some reason do not get their boot order set correctly even though CIMC says
the order is correct. In such instances step 4 of runner fails as PXE boot
never completes in time. The workaround is to manually enter the boot menu from
the KVM console of the affected nodes and make sure the correct order (NIC
interface) is chosen for the PXE boot. Note: the solution is likely to clear
the BIOS CMOS before PXE booting. Will confirm if this solves the problem to
avoid waiting on the KVM console at the time of PXE booting
Cisco IMC Connection
Problems during Bare Metal Installation
The likely cause is
Cisco IMC has too many connections, so the installer cannot connect to it.
Clear the connections by logging into your Cisco IMC, going into the
Admin->Sessions tab and clearing the connections.
API VIP Connection
Problems
Verify the active
HAProxy container is running in one of the controller nodes. On that controller
within the HAProxy container namespace verify the IP address is assigned to the
API interface. Also, verify that your ToR and the network infrastructure
connecting your ToR is provisioned with API network segment VLAN.
HAProxy Services Downtime
after Initial Installation or HA Failover
The HAProxy web
interface can be accessed on TCP port 1936
http://<external_lb_vip_address>:1936/
Username: haproxy
Password: <HAPROXY_PASSWORD> from secrets.yaml file
After initial
installation, the HAProxy web interface might report several OpenStack services
with downtime depending upon when that OpenStack service was installed after
HAProxy install. The counters are not synchronized between HAProxy active and
standby. After HA proxy failover, the downtime timers might change based on the
uptime of new active HAproxy container.
To identify all the
services that are running, enter:
$ systemctl -a | grep docker | grep service
	On controller ignore status of:
docker-neutronlb
On compute ignore status of:
docker-neutronlb, docker-keystone
To start a service
on a host, enter:
$ systemctl start <service_name>
To stop a service on
a host, enter:
$ systemctl stop <service_name>
To restart a service
on a host, enter:
$ systemctl restart <service_name>
To check service
status on a host, enter:
$ systemctl status <service_name>
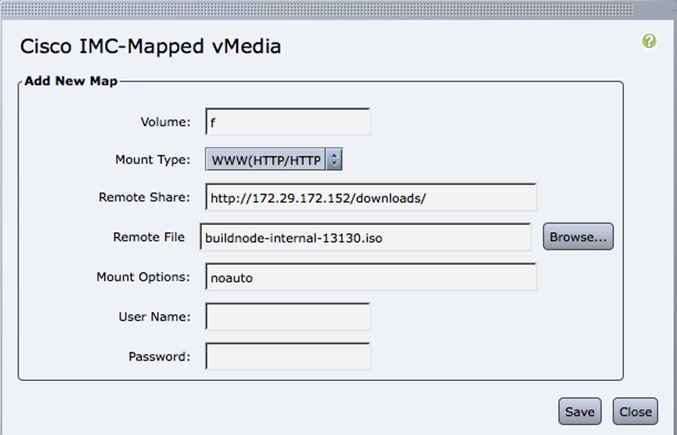
Managing CIMC and ISO Installation
When you are remote it is good to map the ISO through the CIMC Mapped vMedia.
To add new mapping:
Procedure
Step 1
Click Server > Remote Presence > Virtual Media > Add New Mapping.
Step 2
Enter the field values such as the Volume, Mount Type, Remote Share, Remote File, User name, and Password.
Step 3
Click Save. .The CIMC pulls the ISO directly from the HTTP server.
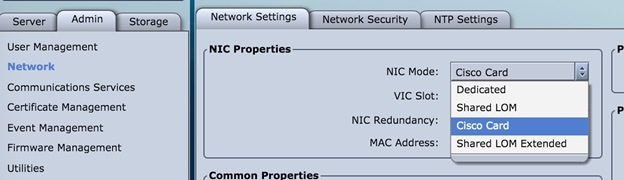
Management Node Installation Fails
Management node installation fails if the CIMC is configured for cisco card mode.
Procedure
Choose the dedicated mode in the following screen:
The selected method that is shown in the preceding screen is the incorrect mode.
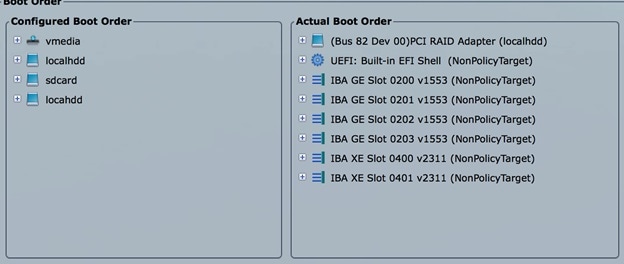
Configuring Boot Order
Management node does not come up post reboot. It must boot from hard drive to check for the actual boot order.
Procedure
Choose Server > BIOS > Configure Boot Order > Boot Order.
PXE Failure Issue During Baremetal Step
Perform the following steps in case of PXE boot failure:
Procedure
Step 1
Check log file /var/log/mercury/mercury_baremetal_install.log and connect to failing node CIMC KVM console to find out more
on PXE boot failure reason.
Step 2
Ensure all validations (step 1) and hardware validations (step 3) pass.
Connect to KVM console of failing node(s) to find out more on PXE boot failure.
Step 5
Check L2/L3 network connectivity between failing node(s) and management node.
Step 6
Check for VPC configuration and port-channel status of failing node(s) and ensure no lacp suspend-individual is configured on the port-channel.
Step 7
Check the actual PXE boot order must not differ from the boot-order configured.
Step 8
Perform tcpdump on the management node interface br_mgmt to watch for UDP port 67 (dhcp) or UDP pot 69 (tftp) tcpdump -I br_mgmt
port 67 or port 69 # on the management node.
Step 9
Perform tcpdump on the management node management interfacebr_mgmt on TCP 80 tcpdump -I br_mgmt port 80 # on the management
node.
Step 10
Check the apache log to watch the management IP address of failing node (if static allocated) tail -f /var/log/cobblerhttpd/access_log
# on the management node.
Step 11
For Authorization Required error messages during bare metal (Step 4) with CIMC operations such as hardware validations or
cleaning up vNIC, check whether the maximum allowed simultaneous connection (4) are in use. All four connections are run when
the 3rd party application monitoring CIMC does not properly close CIMC. This makes CiscoVIM installer not to log in using
xmlapi with valid username and password. Check Cisco IMC logs on CIMC (Server > Faults and Logs > Cisco IMC Logs) for the
reason why user was denied the access (maximum session, incorrect credentials.). The workaround is to disable 3rd party monitoring,
wait at least 10 minutes and then perform CiscoVIM operations.
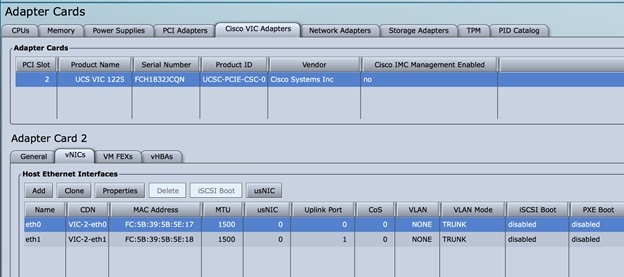
Step 12
In case none of the nodes are getting DHCP address; DHCP requests arrive at the management node but no response goes out,
then check CIMC VIC adapter settings. Server > Inventory > Cisco VIC Adapters > vNICs | VLAN & VLAN Mode. Ensure the VLAN
(both id and mode) configured does not matche with that of N9K switch
Option
Description
CIMC
Trunk:None
Switch
Access:vlan_mgmt
The following topics provide Cisco NFVI general troubleshooting procedures.
Container Download Problems
Check installer logs log file /var/log/mercury/mercury_buildorchestration.log for any build node orchestration failures including
stuck "registry-Populate local registry". Downloaing the Docker container from your management node can be slow.
Check the network connectivity between the management node and the remote registry in defaults.yaml on the management node
(grep "^registry:" openstack-configs/defaults.yaml).
Verify valid remote registry credentials are defined in setup_data.yaml file.
A proxy server is required to pull the container images from remote registry. If a proxy is required, exclude all IP addresses
for your setup including management node.
Cisco IMC Connection Problems during Bare Metal Installation
The cause may be Cisco IMC has too many connections, so the installer cannot connect to it. Clear the connections by logging
into your Cisco IMC, going into the Admin->Sessions tab and clearing the connections.
API VIP Connection Problems
Verify the active HAProxy container is running in one of the controller nodes. On that controller within the HAProxy container
namespace verify the IP address is assigned to the API interface. Also, verify that your ToR and the network infrastructure
connecting your ToR is provisioned with API network segment VLAN.
HAProxy Services Downtime after Initial Installation or HA Failover
The HAProxy web interface can be accessed on TCP port 1936
http://<external_lb_vip_address>:1936/
Username: haproxy
Password: <HAPROXY_PASSWORD> from secrets.yaml file
After initial installation, the HAProxy web interface can report to several OpenStack services with downtime depending upon
when that OpenStack service was installed after HAProxy install. The counters are not synchronized between HAProxy active
and standby. After HA proxy failover, the downtime timers can change based on the uptime of new active HAproxy container.
Management Node Problems
Service Commands
To identify all the services that are running, enter:
$ systemctl -a | grep docker | grep service
	On controller ignore status of:
docker-neutronlb
On compute ignore status of:
docker-neutronlb, docker-keystone
To start a service on a host, enter:
$ systemctl start <service_name>
To stop a service on a host, enter:
$ systemctl stop <service_name>
To restart a service on a host, enter:
$ systemctl restart <service_name>
To check service status on a host, enter:
$ systemctl status <service_name>
Connecting to Docker Container
Procedure
To connect to the docket container do the following:
# generally, aliases are created for all containers
# use alias to identify those
alias | grep in_container
# checking specific alias by name
alias cobbler

# check docker containers
# alias created by CVIM
dp
# list docker containers
docker ps -a
# list docker images
docker images

# connecting to container
docker exec -it my_cobbler_<tag_id> /bin/bash

# connecting to docker container as privileged user
docker exec -it -u root my_cobbler_<tag_id> /bin/bash

# systemctl files
systemctl -a | egrep "docker-.*.service"

# check specific service
systemctl status mercury-restapi -l
systemctl status docker-vmtp

# restart specific service
systemctl restart docker-vmtp
Management Node
Recovery Scenarios
The Cisco NFVI
management node hosts the Cisco VIM Rest API service, Cobbler for PXE services,
ELK for Logging/Kibana dashboard services and VMTP for cloud validation.
Because the maintenance node currently does not have redundancy, understanding
its points of failure and recovery scenarios is important. These are described
in this topic.
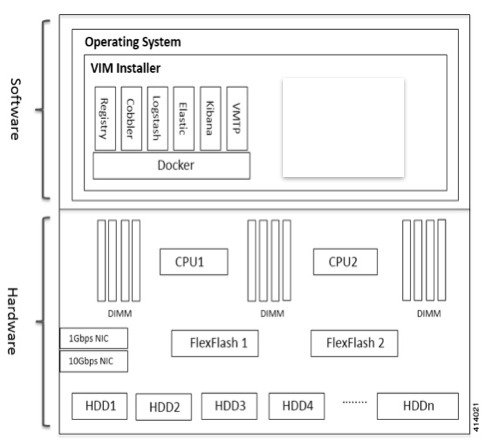
The management node
architecture includes a Cisco UCS C240 M4 server with dual CPU socket. It has a
1 Gbps on-board (LOM) NIC and a 10 Gbps Cisco VIC mLOM. HDDs are used in 8,16,
or 24 disk configurations. The following figure shows a high level maintenance
node hardware and software architecture.
Figure 1. Cisco NFVI
Management Node Architecture
Different management
node hardware or software failures can cause Cisco NFVI service disruptions and
outages. Some failed services can be recovered through manual intervention. In
cases where the system is operational during a failure, double faults might not
be recoverable. The following table lists different management node failure
scenarios and their recovery options.
Table 1. Management Node
Failure Scenarios
Scenario #
Failure/Trigger
Recoverable?
Operational
Impact
1
Failure of 1
or 2 active HDD
Yes
No
2
Simultaneous
failure of more than 2 active HDD
No
Yes
3
Spare HDD
failure: 4 spare for 24 HDD; or 2 spare for 8 HDD
Yes
No
4
Power
outage/hard reboot
Yes
Yes
5
Graceful
reboot
Yes
Yes
6
Docker
daemon start failure
Yes
Yes
7
Service
container (Cobbler, ELK) start failure
Yes
Yes
8
One link
failure on bond interface
Yes
No
9
Two link
failures on bond interface
Yes
Yes
10
REST API
service failure
Yes
No
11
Graceful
reboot with Cisco VIM Insight
Yes
Yes; CLI
alternatives exist during reboot.
12
Power
outage/hard reboot with Cisco VIM Insight
Yes
Yes
13
VIM Insight
Container reinstallation
Yes
Yes; CLI
alternatives exist during re-insight.
14
Cisco VIM
Insight Container reboot
Yes
Yes; CLI
alternatives exist during reboot.
15
Intel 1350
1Gbps LOM failure
Yes
Yes
16
Cisco VIC
1227 10 Gbps mLOM failure
Yes
Yes
17
DIMM memory
failure
Yes
No
18
One CPU
failure
Yes
No
Scenario 1: Failure of one
or two active HDDs
The management node
has either 8,16, or 24 HDDs. The HDDs are configured with RAID 6, which helps
enable data redundancy and storage performance and overcomes any unforeseen HDD
failures.
When 8 HDDs are
installed, 7 are active disks and one is spare disk.
When 16 HDDs
are installed, 14 are active disks and two are spare disks.
When 24 HDDs
are installed, 20 are active disks and four are spare disks.
With RAID 6 up to
two simultaneous active HDD failures can occur. When an HDD fails, the system
starts automatic recovery by moving the spare disk to active state and starts
recovering and rebuilding the new active HDD. It takes approximately four hours
to rebuild the new disk and move to synchronized state. During this operation,
the system is completely functional and no impacts are seen. However, you must
monitor the system to ensure that additional failures do not occur to enter
into a double fault situation.
You can use the
storcli commands to check the disk and RAID state as
shown below:
Note
Make sure the
node is running with hardware RAID by checking the storcli output and comparing
to the one preceding. If hardware RAID is not found, refer to Cisco NFVI Admin
Guide 1.0 for HDDs replacement or contact TAC.
[root@mgmt-node ~]# /opt/MegaRAID/storcli/storcli64 /c0 show

<…snip…>

TOPOLOGY:
========
-----------------------------------------------------------------------------
DG Arr Row EID:Slot DID Type  State BT       Size PDC  PI SED DS3  FSpace TR
-----------------------------------------------------------------------------
 0 -   -   -        -   RAID6 Optl  N    4.087 TB dflt N  N   dflt N      N
 0 0   -   -        -   RAID6 Optl  N    4.087 TB dflt N  N   dflt N      N       <== RAID 6 in optimal state
 0 0   0   252:1    1   DRIVE Onln  N  837.258 GB dflt N  N   dflt -      N
 0 0   1   252:2    2   DRIVE Onln  N  837.258 GB dflt N  N   dflt -      N
 0 0   2   252:3    3   DRIVE Onln  N  930.390 GB dflt N  N   dflt -      N
 0 0   3   252:4    4   DRIVE Onln  N  930.390 GB dflt N  N   dflt -      N
 0 0   4   252:5    5   DRIVE Onln  N  930.390 GB dflt N  N   dflt -      N
 0 0   5   252:6    6   DRIVE Onln  N  930.390 GB dflt N  N   dflt -      N
 0 0   6   252:7    7   DRIVE Onln  N  930.390 GB dflt N  N   dflt -      N
 0 -   -   252:8    8   DRIVE DHS   -  930.390 GB -    -  -   -    -      N

-----------------------------------------------------------------------------

<…snip…>

PD LIST:
=======
-------------------------------------------------------------------------
EID:Slt DID State DG       Size Intf Med SED PI SeSz Model            Sp
-------------------------------------------------------------------------
252:1     1 Onln   0 837.258 GB SAS  HDD N   N  512B ST900MM0006      U   <== all disks functioning
252:2     2 Onln   0 837.258 GB SAS  HDD N   N  512B ST900MM0006      U
252:3     3 Onln   0 930.390 GB SAS  HDD N   N  512B ST91000640SS     U
252:4     4 Onln   0 930.390 GB SAS  HDD N   N  512B ST91000640SS     U
252:5     5 Onln   0 930.390 GB SAS  HDD N   N  512B ST91000640SS     U
252:6     6 Onln   0 930.390 GB SAS  HDD N   N  512B ST91000640SS     U
252:7     7 Onln   0 930.390 GB SAS  HDD N   N  512B ST91000640SS     U
252:8     8 DHS    0 930.390 GB SAS  HDD N   N  512B ST91000640SS     D
-------------------------------------------------------------------------


[root@mgmt-node ~]# /opt/MegaRAID/storcli/storcli64 /c0 show

<…snip…>

TOPOLOGY :
========
-----------------------------------------------------------------------------
DG Arr Row EID:Slot DID Type  State BT       Size PDC  PI SED DS3  FSpace TR
-----------------------------------------------------------------------------
 0 -   -   -        -   RAID6 Pdgd  N    4.087 TB dflt N  N   dflt N      N    <== RAID 6 in degraded state
 0 0   -   -        -   RAID6 Dgrd  N    4.087 TB dflt N  N   dflt N      N
 0 0   0   252:8    8   DRIVE Rbld  Y  930.390 GB dflt N  N   dflt -      N
 0 0   1   252:2    2   DRIVE Onln  N  837.258 GB dflt N  N   dflt -      N
 0 0   2   252:3    3   DRIVE Onln  N  930.390 GB dflt N  N   dflt -      N
 0 0   3   252:4    4   DRIVE Onln  N  930.390 GB dflt N  N   dflt -      N
 0 0   4   252:5    5   DRIVE Onln  N  930.390 GB dflt N  N   dflt -      N
 0 0   5   252:6    6   DRIVE Onln  N  930.390 GB dflt N  N   dflt -      N
 0 0   6   252:7    7   DRIVE Onln  N  930.390 GB dflt N  N   dflt -      N
-----------------------------------------------------------------------------

<…snip…>

PD LIST :
=======
-------------------------------------------------------------------------
EID:Slt DID State DG       Size Intf Med SED PI SeSz Model            Sp
-------------------------------------------------------------------------
252:1     1 UGood -  837.258 GB SAS  HDD N   N  512B ST900MM0006      U    <== active disk in slot 1 disconnected from drive group 0
252:2     2 Onln  0  837.258 GB SAS  HDD N   N  512B ST900MM0006      U
252:3     3 Onln  0  930.390 GB SAS  HDD N   N  512B ST91000640SS     U
252:4     4 Onln  0  930.390 GB SAS  HDD N   N  512B ST91000640SS     U
252:5     5 Onln  0  930.390 GB SAS  HDD N   N  512B ST91000640SS     U
252:6     6 Onln  0  930.390 GB SAS  HDD N   N  512B ST91000640SS     U
252:7     7 Onln  0  930.390 GB SAS  HDD N   N  512B ST91000640SS     U
252:8     8 Rbld  0  930.390 GB SAS  HDD N   N  512B ST91000640SS     U    <== spare disk in slot 8 joined drive group 0 and in rebuilding state
-------------------------------------------------------------------------


[root@mgmt-node ~]# /opt/MegaRAID/storcli/storcli64 /c0/e252/s8 show rebuild
Controller = 0
Status = Success
Description = Show Drive Rebuild Status Succeeded.

------------------------------------------------------
Drive-ID    Progress% Status      Estimated Time Left
------------------------------------------------------
/c0/e252/s8        20 In progress 2 Hours 28 Minutes     <== spare disk in slot 8 rebuild status
------------------------------------------------------
To replace the
failed disk and add it back as a spare:
[root@mgmt-node ~]# /opt/MegaRAID/storcli/storcli64 /c0/e252/s1 add hotsparedrive dg=0
Controller = 0
Status = Success
Description = Add Hot Spare Succeeded.


[root@mgmt-node ~]# /opt/MegaRAID/storcli/storcli64 /c0 show

<…snip…>

TOPOLOGY :
========
-----------------------------------------------------------------------------
DG Arr Row EID:Slot DID Type  State BT       Size PDC  PI SED DS3  FSpace TR
-----------------------------------------------------------------------------
 0 -   -   -        -   RAID6 Pdgd  N    4.087 TB dflt N  N   dflt N      N
 0 0   -   -        -   RAID6 Dgrd  N    4.087 TB dflt N  N   dflt N      N
 0 0   0   252:8    8   DRIVE Rbld  Y  930.390 GB dflt N  N   dflt -      N
 0 0   1   252:2    2   DRIVE Onln  N  837.258 GB dflt N  N   dflt -      N
 0 0   2   252:3    3   DRIVE Onln  N  930.390 GB dflt N  N   dflt -      N
 0 0   3   252:4    4   DRIVE Onln  N  930.390 GB dflt N  N   dflt -      N
 0 0   4   252:5    5   DRIVE Onln  N  930.390 GB dflt N  N   dflt -      N
 0 0   5   252:6    6   DRIVE Onln  N  930.390 GB dflt N  N   dflt -      N
 0 0   6   252:7    7   DRIVE Onln  N  930.390 GB dflt N  N   dflt -      N
 0 -   -   252:1    1   DRIVE DHS   -  837.258 GB -    -  -   -    -      N
-----------------------------------------------------------------------------

<…snip…>

PD LIST :
=======
-------------------------------------------------------------------------
EID:Slt DID State DG       Size Intf Med SED PI SeSz Model            Sp
-------------------------------------------------------------------------
252:1     1 DHS   0  837.258 GB SAS  HDD N   N  512B ST900MM0006      U    <== replacement disk added back as spare
252:2     2 Onln  0  837.258 GB SAS  HDD N   N  512B ST900MM0006      U
252:3     3 Onln  0  930.390 GB SAS  HDD N   N  512B ST91000640SS     U
252:4     4 Onln  0  930.390 GB SAS  HDD N   N  512B ST91000640SS     U
252:5     5 Onln  0  930.390 GB SAS  HDD N   N  512B ST91000640SS     U
252:6     6 Onln  0  930.390 GB SAS  HDD N   N  512B ST91000640SS     U
252:7     7 Onln  0  930.390 GB SAS  HDD N   N  512B ST91000640SS     U
252:8     8 Rbld  0  930.390 GB SAS  HDD N   N  512B ST91000640SS     U
-------------------------------------------------------------------------
Scenario 2:
Simultaneous
failure of more than two active HDDs
If more than two HDD
failures occur at the same time, the management node goes into an unrecoverable
failure state because RAID 6 allows for recovery of up to two simultaneous HDD
failures. To recover the management node, reinstall the operating system.
Scenario 3: Spare HDD
failure
When the management
node has 24 HDDs, four are designated as spares. Failure of any of the disks
does not impact the RAID or system functionality. Cisco recommends replacing
these disks when they fail (see the steps in Scenario 1) to serve as standby
disks and so when an active disk fails, an auto-rebuild is triggered.
Scenario 4: Power
outage/hard reboot
If a power outage or
hard system reboot occurs, the system will boot up and come back to operational
state. Services running on management node during down time will be disrupted.
See the steps in Scenario 9 for the list of commands to check the services
status after recovery.
Scenario 5: System
reboot
If a graceful
system reboot occurs, the system will boot up and come back to operational
state. Services running on management node during down time will be disrupted.
See the steps in Scenario 9 for the list of commands to check the services
status after recovery.
Scenario 6: Docker daemon
start failure
The management node
runs the services using Docker containers. If the Docker daemon fails to come
up, it causes services such as ELK, Cobbler and VMTP to go into down state. You
can use the
systemctl
command to check the status of the Docker daemon, for example:
# systemctl status docker
docker.service - Docker Application Container Engine
Loaded: loaded (/usr/lib/systemd/system/docker.service; enabled; vendor preset: disabled)
Active: active (running) since Mon 2016-08-22 00:33:43 CEST; 21h ago
Docs: http://docs.docker.com
Main PID: 16728 (docker)
If the Docker
daemon is in down state, use the
systemctl restart
docker
command to restart the Docker service. Run the commands listed in
Scenario 9 to verify that all the Docker services are active.
Scenario 7: Service
container (Cobbler, ELK) start failure
As described in
Scenario 8, all the services run as Docker containers on the management node.
To find all services running as containers, use the
docker ps –a
command. If any services are in Exit state, use the
systemctl
command and grep for Docker to find the exact service name, for example:
If any services need
restarting, use the
systemctl
command. For example, to restart a Kibana service:
# systemctl restart docker-kibana.service
Scenario 8: One link
failure on the bond Interface
The management node
is set up with two different networks: br_api and br_mgmt. The br_api interface
is the external. It is used for accessing outside services such as the Cisco
VIM REST API, Kibana and Cobbler. The br_mgmt interface is internal. It is used
for provisioning and to provide management connectivity to all OpenStack nodes
(control, compute and storage). Each network has two ports that are bonded to
provide redundancy. If one port fails, the system will remain completely
functional through the other port. If a port fails, check for physical network
connectivity and/or remote switch configuration to debug the underlying cause
of the link failure.
Scenario 9: Two link
failures on the bond Interface
As described in
Scenario 10, each network is configured with two ports. If both ports are down,
the system is not reachable and management node services could be disrupted.
After the ports are back up, the system is fully operational. Check the
physical network connectivity and/or the remote switch configuration to debug
the underlying link failure cause.
Scenario 10: REST API
service failure
The management node
runs the REST API service for Cisco VIM clients to reach the server. If the
REST service is down, Cisco VIM clients cannot reach the server to trigger any
server operations. However, with the exception of the REST service, other
management node services remain operational.
To verify the
management node REST services are fully operational, use the following command
to check that the httpd and mercury-restapi services are in active and running
state:
# systemctl status httpd
httpd.service - The Apache HTTP Server
   Loaded: loaded (/usr/lib/systemd/system/httpd.service; enabled; vendor preset: disabled)
   Active: active (running) since Mon 2016-08-22 00:22:10 CEST; 22h ago

# systemctl status mercury-restapi.service
mercury-restapi.service - Mercury Restapi
   Loaded: loaded (/usr/lib/systemd/system/mercury-restapi.service; enabled; vendor preset: disabled)
   Active: active (running) since Mon 2016-08-22 00:20:18 CEST; 22h ago
A tool is also
provided so that you can check the REST API server status and the location of
the directory it is running from. To execute run the following command:
# cd installer-<tagid>/tools
#./restapi.py -a status
   Status of the REST API Server:  active (running) since Thu 2016-08-18 09:15:39 UTC; 9h ago
   REST API launch directory: /root/installer-<tagid>/
Confirm the server
status is active and check that the restapi launch directory matches the
directory where the installation was launched. The restapi tool also provides
the options to launch, tear down, and reset password for the restapi server as
shown below:
# ./restapi.py –h

usage: restapi.py [-h] --action ACTION [--yes] [--verbose]

REST API setup helper

optional arguments:
  -h, --help            show this help message and exit
  --action ACTION, -a ACTION
                        setup - Install and Start the REST API server.
                        teardown - Stop and Uninstall the REST API
 					 server.
                        restart - Restart the REST API server.
                        regenerate-password - Regenerate the password for
 					 REST API server.
                        reset-password - Reset the REST API password with
					 user given password.
                        status - Check the status of the REST API server
  --yes, -y             Skip the dialog. Yes to the action.
  --verbose, -v         Perform the action in verbose mode.
If the REST API
server is not running, execute
./ciscovimclient/ciscovim to show the following error
message:
# cd installer-<tagid>/
#./ciscovimclient/ciscovim –setupfile ~/Save/<setup_data.yaml> run
  ERROR: Error communicating with https://<api_ip:8445> [Errno 111] Connection refused
If the installer
directory or the REST API state is not correct or points to an incorrect REST
API launch directory, go to the installer-<tagid>/tools directory and
execute:
# ./restapi.py –action setup
To confirm that the
REST API server state and launch directory is correct run the following
command:
# ./restapi.py –action status
Scenario 11: Graceful
reboot with Cisco VIM Insight
Cisco VIM Insight
runs as a container on the management node. After a graceful reboot of the
management node, the VIM Insight and its associated database containers will
come up. So there is no impact on recovery.
Scenario 12: Power outage
or hard reboot with VIM Insight
The Cisco VIM
Insight container will come up automatically following a power outage or hard
reset of the management node.
Scenario 13: Cisco VIM
Insight reinstallation
If the management
node which is running the Cisco VIM Insight fails and cannot come up, you must
uninstall and reinstall the Cisco VIM Insight. After the VM Insight container
comes up, add the relevant bootstrap steps as listed in the install guide to
register the pod. VIM Insight then automatically detects the installer status
and reflects the current status appropriately.
To clean up and
reinstall Cisco VIM Insight run the following command:
On Reboot of the
VIM Insight container, services will continue to work as it is.
Scenario 15: Intel (I350)
1Gbps LOM failure
The management node
is set up with an Intel (I350) 1 Gbps LOM for API connectivity. Two 1 Gbps
ports are bonded to provide connectivity redundancy. No operational impact
occurs if one of these ports goes down. However, if both ports fail, or the LOM
network adapter fails, the system cannot be reached through the API IP address.
If this occurs you must replace the server because the LOM is connected to the
system motherboard. To recover the management node with a new server, complete
the following steps. Make sure the new management node hardware profile matches
the existing server and the Cisco IMC IP address is assigned.
Shut down the
existing management node.
Unplug the power
from the existing and new management nodes.
Remove all HDDs
from existing management node and install them in the same slots of the new
management node.
Plug in the
power to the new management node, but do not boot the node.
Verify the configured boot
order is set to boot from local HDD.
Verify the Cisco
NFVI management VLAN is configured on the Cisco VIC interfaces.
Boot the
management node for the operating system to start.
After the
management node is up, the management node bond interface will be down due to
the incorrect MAC address on the ifcfg files. It will point to old node network
card MAC address.
Update the MAC
address on the ifcfg files under /etc/sysconfig/network-scripts.
Reboot the
management node.
It will come up
and be fully operational. All interfaces should be in an up state and be
reachable.
Verify that
Kibana and Cobbler dashboards are accessible.
Verify the Rest
API services are up. See Scenario 15 for any recovery steps.
Scenario 16: Cisco VIC 1227
10Gbps mLOM failure
The management node
is configured with a Cisco VIC 1227 dual port 10 Gbps mLOM adapter for
connectivity to the other Cisco NFVI nodes. Two 10 Gbps ports are bonded to
provide connectivity redundancy. If one of the 10 Gbps ports goes down, no
operational impact occurs. However, if both Cisco VIC 10 Gbps ports fail, the
system goes into an unreachable state on the management network. If this
occurs, you must replace the VIC network adapters. Otherwise pod management and
the Logstash forwarding service will be disrupted. If you replace a Cisco VIC,
update the management and provisioning VLAN for the VIC interfaces using Cisco
IMC and update the MAC address in the interfaces under
/etc/sysconfig/network-scripts interface configuration file.
Scenario 17: DIMM memory
failure
The management node
is set up with multiple DIMM memory across different slots. Failure of one or
memory modules could cause the system to go into unstable state, depending on
how many DIMM memory failures occur. DIMM memory failures are standard system
failures like any other Linux system server. If a DIMM memory fails, replace
the memory module(s) as soon as possible to keep the system in stable state.
Scenario 18: One CPU
failure
Cisco NFVI
management nodes have dual core Intel CPUs (CPU1 and CPU2). If one CPU fails,
the system remains operational. However, always replace failed CPU modules
immediately. CPU failures are standard system failures like any other Linux
system server. If a CPU fails, replace it immediately to keep the system in
stable state.
Recovering Compute
Node Scenario
The Cisco NFVI
Compute node hosts the OpenStack services to provide processing, network, and
storage resources to run instances. The node architecture includes a Cisco UCS
C220 M4 server with dual CPU socket, 10 Gbps Cisco VIC mLOM, and two HDDs in
RAID 1 configuration.
Failure of one
active HDD
With RAID 1, data are
mirrored and can allow up to one active HDD failure. When a HDD fails, the node
is still functional with no impacts. However, the data are no longer mirrored
and losing another HDD will result in unrecoverable and operational downtime.
The failed disk should be replaced soon as it takes approximately two hours to
rebuild the new disk and move to synchronized state.
To check the disk and
RAID state run the storcli commands as follows:
Note
Make sure that the
node is running with hardware RAID by checking the storcli output and comparing
to the one below. If hardware RAID is not found, refer to Cisco NFVI Admin
Guide 1.0 for HDDs replacement or contact TAC.
[root@compute-node ~]# /opt/MegaRAID/storcli/storcli64 /c0 show

<…snip…>

TOPOLOGY :
========
-----------------------------------------------------------------------------
DG Arr Row EID:Slot DID Type  State BT       Size PDC  PI SED DS3  FSpace TR
-----------------------------------------------------------------------------
 0 -   -   -        -   RAID1 Optl  N  837.258 GB dflt N  N   dflt N      N  <== RAID 1 in optimal state
 0 0   -   -        -   RAID1 Optl  N  837.258 GB dflt N  N   dflt N      N
 0 0   0   252:2    9   DRIVE Onln  N  837.258 GB dflt N  N   dflt -      N
 0 0   1   252:3    11  DRIVE Onln  N  837.258 GB dflt N  N   dflt -      N
-----------------------------------------------------------------------------

<…snip…>

Physical Drives = 2

PD LIST :
=======
-------------------------------------------------------------------------
EID:Slt DID State DG       Size Intf Med SED PI SeSz Model            Sp
-------------------------------------------------------------------------
252:2     9 Onln   0 837.258 GB SAS  HDD N   N  512B ST900MM0006      U   <== all disks functioning
252:3    11 Onln   0 837.258 GB SAS  HDD N   N  512B ST900MM0006      U
-------------------------------------------------------------------------


[root@compute-node ~]# /opt/MegaRAID/storcli/storcli64 /c0 show

<…snip…>

TOPOLOGY :
========
-----------------------------------------------------------------------------
DG Arr Row EID:Slot DID Type  State BT       Size PDC  PI SED DS3  FSpace TR
-----------------------------------------------------------------------------
 0 -   -   -        -   RAID1 Dgrd  N  837.258 GB dflt N  N   dflt N      N  <== RAID 1 in degraded state.
 0 0   -   -        -   RAID1 Dgrd  N  837.258 GB dflt N  N   dflt N      N
 0 0   0   -        -   DRIVE Msng  -  837.258 GB -    -  -   -    -      N
 0 0   1   252:3    11  DRIVE Onln  N  837.258 GB dflt N  N   dflt -      N
-----------------------------------------------------------------------------

<…snip…>

PD LIST :
=======
-------------------------------------------------------------------------
EID:Slt DID State DG       Size Intf Med SED PI SeSz Model            Sp
-------------------------------------------------------------------------
252:2     9 UGood -  837.258 GB SAS  HDD N   N  512B ST900MM0006      U   <== active disk in slot 2 disconnected from drive group 0
252:3    11 Onln  0  837.258 GB SAS  HDD N   N  512B ST900MM0006      U
-------------------------------------------------------------------------
To replace the failed
disk and add it back as a spare run the following command:
[root@compute-node ~]# /opt/MegaRAID/storcli/storcli64 /c0/e252/s2 add hotsparedrive dg=0
Controller = 0
Status = Success
Description = Add Hot Spare Succeeded.


[root@compute-node ~]# /opt/MegaRAID/storcli/storcli64 /c0 show

<…snip…>

TOPOLOGY :
========
-----------------------------------------------------------------------------
DG Arr Row EID:Slot DID Type  State BT       Size PDC  PI SED DS3  FSpace TR
-----------------------------------------------------------------------------
 0 -   -   -        -   RAID1 Dgrd  N  837.258 GB dflt N  N   dflt N      N
 0 0   -   -        -   RAID1 Dgrd  N  837.258 GB dflt N  N   dflt N      N
 0 0   0   252:2    9   DRIVE Rbld  Y  837.258 GB dflt N  N   dflt -      N
 0 0   1   252:3    11  DRIVE Onln  N  837.258 GB dflt N  N   dflt -      N
-----------------------------------------------------------------------------

<…snip…>

PD LIST :
=======
-------------------------------------------------------------------------
EID:Slt DID State DG       Size Intf Med SED PI SeSz Model            Sp
-------------------------------------------------------------------------
252:2     9 Rbld   0 837.258 GB SAS  HDD N   N  512B ST900MM0006      U   <== replacement disk in slot 2 joined device group 0 and in rebuilding state
252:3    11 Onln   0 837.258 GB SAS  HDD N   N  512B ST900MM0006      U
-------------------------------------------------------------------------


[root@compute-node ~]# /opt/MegaRAID/storcli/storcli64 /c0/e252/s2 show rebuild
Controller = 0
Status = Success
Description = Show Drive Rebuild Status Succeeded.


------------------------------------------------------
Drive-ID    Progress% Status      Estimated Time Left
------------------------------------------------------
/c0/e252/s2        10 In progress 1 Hours 9 Minutes    <== replacement disk in slot 2 rebuild status
------------------------------------------------------
Running the Cisco
VIM Technical Support Tool
Cisco VIM includes a
tech-support tool that you can use to gather Cisco VIM information to help
solve issues working with Cisco Technical Support. The tech-support tool can be
extended to execute custom scripts. It can be called after runner is executed
at least once. The tech-support tool uses a configuration file that specifies
what information to collect. The configuration file is located in the following
location: /root/openstack-configs/tech-support/tech_support_cfg.yaml.
The tech-support tool
keeps track of the point where the Cisco VIM installer has executed and
collects the output of files or commands indicated by the configuration file.
For example, if the installer fails at Step 3 (VALIDATION), the tech-support
will provide information listed in the configuration file up to Step 3
(included). You can override this default behavior by adding the --stage option
to the command.
The tech-support
script is located at the management node /root/installer-{tag-id}/tech-support
directory. To run it after the runner execution, enter the following command:
./tech-support/tech_support.py
The command creates a
compressed tar file containing all the information it gathered. The file
location is displayed in the console at the end of the execution. You do not
need to execute the command with any options. However, if you want to override
any default behavior, you can use the following options:
/tech_support.py --help
Usage: tech_support.py [options]

tech_support.py collects information about your cloud
Options:
  -h, --help            show this help message and exit
  --stage=STAGE         specify the stage where installer left off
  --config-file=CFG_FILE specify alternate configuration file
  --tmp-dir=TMP_DIR     specify alternate temporary directory
  --file-size=TAIL_SIZE specify max size (in KB) of each file collected
Where:
stage—tells the
tech-support at which state the installer left off. The possible values are:
INPUT_VALIDATION, BUILDNODE_ORCHESTRATION, VALIDATION, BAREMETAL_INSTALL,
COMMON_SETUP, CEPH, ORCHESTRATION or VMTP
config-file—Provides the path for a specific configuration file.
Make sure that your syntax is correct. Look at the default
/root/tech-support/openstack-configs/tech_support_cfg.yaml file as an example
on how to create a new config-file or modify the default file.
tmp-dir—Provides
the path to a temp directory tech-support can use to create the compressed tar
file. The tech-support tool provides the infrastructure to execute standard
Linux commands from packages included in the Cisco VIM installation. This
infrastructure is extensible and you can add commands, files, or custom
bash/Python scripts into the appropriate configuration file sections for the
tool to collect the output of those commands/scripts. (See the README section
at the beginning of the file for more details on how to do this.)
file-size—Is an
integer that specifies (in KB) the maximum file size that tech-support will
capture and tail the file if needed. By default, this value is set to 10 MB.
For example, if no file-size option is provided and the tech-support needs to
collect /var/log/mercury/data.log and the data.log is more than 10 MB,
tech-support will get the last 10 MB from /var/log/mercury/data.log.
Tech-support
configuration file
Cisco VIM
tech-support is a utility tool designed to collect the VIM pod logs which help
users to debug the issues offline. The administrator uses the tech-support
configuration files to provide the list of commands or configuration files. The
tech support tool of the Cisco VIM gathers list of commands or configuration
files for the offline diagnostic or debugging purposes.
By default the
tech-support configuration file is located at the
/root/openstack-configs/tech-support/tech_support_cfg.yaml file. Alternatively,
you can use a different one by specifying the -config-file option. The syntax
of this configuration file must be as follows:
The tech-support
configuration file section is divided into eight sections which corresponds to
each of the installer stages:
INPUT_VALIDATION
BUILDNODE_ORCHESTRATION
VALIDATION
BAREMETAL_INSTALL
COMMON_SETUP
CEPH
ORCHESTRATION
VMTP
Inside each of these
eight sections, there are tags divided on hierarchical levels. At the first
level, the tag indicates the host(s) or path on which the command(s) run and
from where the file(s) can be collected. The possible tags are as follows:
-
HOSTS_MANAGEMENT: Run in Management node only
- HOSTS_CONTROL:
Run in all the Control nodes
- HOSTS_COMPUTE:
Run in all the Compute nodes
- HOSTS_STORAGE:
Run in all the Storage nodes
- HOSTS_COMMON:
Run in all the Compute and Control nodes
- HOSTS_ALL: Run
in all the Compute, Control and Storage nodes
Note
In any of these
eight sections, if HOSTS tag is not specified then no information is collected
for that stage.
For each of the hosts
mentioned above there will be a second level tag which specifies where to run
the command. The possible values of those tags are as follows:
- SERVER_FILES:
Path(s) to the file(s) that tech-support needs to collect.
-
SERVER_COMMANDS: Command(s) or script name(s) which need to be executed
directly on the desired server. The command(s) need to be already included in
the $PATH. For the scripts, please refer to the Custom Scripts paragraph below.
- CONTAINERS:
Indicates the tech-support tool that the command(s) need to be executed and the
files to be gathered from inside a container. See the following steps for more
specific information of what can be added in this section.
In the CONTAINERS
section, indicate the path in which container the commands should be executed
or gathered from. This is done with a <container_name> tag (Shown below
are example of where to get the string for the <container_name> tag):
all_containers:
Execute inside all containers (regardless of the state).
<container_name>: This must be the name of a container and
it indicates in which container to run the command or gather the information.
This will run commands inside the container only if the mentioned container is
up (as we cannot run commands on dead containers). Example of how to get the
container name:
Execute
docker ps and get the name (without any numbers) of
the last column of output
docker ps
-a.
For example:
CONTAINER ID  IMAGE                 COMMAND   <snip>  NAMES
81bc4e54cbfb  <registry>/vmtp:4263  /bin/bash"        vmtp_4263
The tech-support runs
the linux commands on the server (from packages included in RHEL7.3). Add the
name of the commands under the SERVER_COMMANDS section of the configuration
file to run the commands.
However, if the
administrator wants to add a custom bash or python script to be executed in
some set of servers in the cloud. In this case the user just needs to add the
script into the custom-scripts directory on the current directory path
(/root/openstack-configs/tech-support/) and add the script name into the
corresponding SERVER_COMMANDS section.
The tech-support tool
will scp the script(s) included in the custom-scripts directory into the
appropriate cloud nodes where it will be executed (as# indicated in this config
file) and capture the output (stdout and stderr) and add it to the collection
of files collected by the tech-support tool. It is assumed that the scripts are
self-standing and independent and needs no external input.
Following is an
example of a custom tech-support configuration file. This is just an example of
what information the tech-support tool will gather if given the following
configuration file:
COMMON_SETUP:
  HOSTS_ALL:   # All compute, control and storage hosts
    SERVER_FILES:
      - /usr/lib/docker-storage-setup
    SERVER_COMMANDS:
      - docker info
      - my_script.sh
    CONTAINERS:
      all_containers:  #execute in all containers (even if they are in down state)
        CONTAINER_COMMANDS:
          - docker inspect
          - docker logs
      logstash:
        CONTAINER_FILES:
          - /var/log/
        CONTAINER_COMMANDS:
          - ls -l
Given this example of
configuration, and assuming that the installer ended in at least the
COMMON_SETUP state, the tech-support tool will run under all OpenStack nodes
(Compute, Control and Storage) and it will:
Gather (if exists)
the contents of /usr/lib/docker-storage-setup file.
Run
docker
info command and collect the output.
Run
my_script.sh
and collect the output. The
my_script.sh is an example of a bash script which the
user previously added to the
/root/openstack-configs/tech-support/custom-scripts directory.
Collect the output
of docker inspect and docker logs for all containers.
Collect the files
in /var/log inside the logstash container (if there is container with that
name). This is equivalent to running the following command (where /tmp
indicates a temporary location where the tech-support tool gathers all the
information):
docker
cp logstash_{tag}:/var/log/ /tmp.
Collect the output
of the command
docker
exec logstash_{{tag}}: ls -l.
.
Tech-Support When Servers Are Offline
It is difficult to collect the information from the servers if one or more cloud nodes are not reachable. In this case, you
can connect through the KVM console into those servers and run the local tech-support tool.
Procedure
Step 1
To run the local tech-support
tool run the following command:
/root/tech_support_offline
Step 2
Cisco VIM tech_support _offline collects the Logs and other troubleshooting output from the server and place it in the location
of the other server:
/root/tech_support
Note
After the server is reachable, you can use the Cisco VIM tech-support tool which collects all the files under the /root/tech-support/
directory which can be used to debug any issue which are offline.
Disk-Maintenance Tool to Manage Physical Drives
In VIM you can use the disk-maintenance tool to check the status of all physical drives that are present in running and operational
nodes in the following roles -
Management
Control (all or specific nodes)
Compute (all or specific nodes) (Expect for third party)
This provides the information about the present status of the physical drives - if they are in Online, Offline, Rebuilding,
Unconfigured Good or JBOD states if all disks are ok. If not, the disks that have gone bad are displayed with the slot number
and server information, that has to be replaced. When multiple disks have to be replaced, we recommend you to execute remove
or add of the node.
Physically remove and insert a new disk before attempting to replace.
For smooth operation, wipe out disk before attempting replace operations.
Call Cisco TAC if you face any issue. Do not reattempt.
Note
Make sure that each node is running with hardware RAID , the steps for which can be found in the section titled Recovering
Compute Node Scenario. Refer to step 15 of the section "Upgrading Cisco VIM Software Using a USB" on how to move the pod from
hardware RAID to software RAID.
To check the status of the Diskmgmt log in to the management node and run the ciscovim command with the diskmgmt option. The
design of the diskmgmt user interface follows a test job create, list, show, and delete workflow.
Diskmgmt user workflow:
A database of disk operation results is maintained so that you can keep the results of multiple disk check or replace and
view them at any time.
Procedure
Step 1
Run the Help command to see all available command line options:
# ciscovim help diskmgmt
usage: ciscovim diskmgmt [--server <node1,node2,...>] [--id <id>]
                         [--locator {on,off}] [--json-display] [-y]
                         create|delete|list|show check-disks|replace-disks
                         all|management|control|compute

HDD maintenance helper

Positional arguments:
  create|delete|list|show         The control command to perform
  check-disks|replace-disks       The identity of the task/action
  all|management|control|compute  The role of the target host(s)

Optional arguments:
  --server <node1,node2,...>      List of specific control/compute host names
                                  within the target role.
  --id <id>                       ID used to identify specific item to
                                  show/delete.
  --locator {on,off}              Turn on|off locator LED for server with bad
                                  disks and for the physical drives.
  --json-display                  Shows output in JSON format.
  -y, --yes                       Yes option to perform the action
Step 2
Check Disk operation creates check-disks operation for all control nodes in the POD. The system responds with a message indicating
the Time, ID and when it was Created. Run the following check-disk operation command:
# ciscovim diskmgmt create check-disks control
+------------+--------------------------------------+
| Field      | Value                                |
+------------+--------------------------------------+
| action     | check-disks                          |
| command    | create                               |
| created_at | 2018-03-07T21:12:20.684648+00:00     |
| id         | 0c6d27c8-bdac-493b-817e-1ea8640dae57 |
| locator    | False                                |
| result     |                                      |
| role       | control                              |
| servers    | None                                 |
| status     | not_run                              |
| updated_at | None                                 |
+------------+--------------------------------------+
Step 3
The cisco vim diskmgmt list command is used to monitor a currently running task, and the completed tasks. The list command
can filter based on the role. Using ‘all’ command lists all tests that are in the database.
# ciscovim diskmgmt list check-disks control
+--------------------------------------+-------------+---------+----------+---------------------------+
| ID                                   | Action      | Role    | Status   | Created                   |
+--------------------------------------+-------------+---------+----------+---------------------------+
| 861d4d73-ffee-40bf-9348-13afc697ee3d | check-disks | control | Complete | 2018-03-05 14:44:47+00:00 |
| 0c6d27c8-bdac-493b-817e-1ea8640dae57 | check-disks | control | Running  | 2018-03-07 21:12:20+00:00 |
+--------------------------------------+-------------+---------+----------+---------------------------+
[root@F24-Michigan ~]# ciscovim diskmgmt list check-disks compute
+--------------------------------------+-------------+---------+----------+---------------------------+
| ID                                   | Action      | Role    | Status   | Created                   |
+--------------------------------------+-------------+---------+----------+---------------------------+
| 0be7a55a-37fe-43a1-a975-cbf93ac78893 | check-disks | compute | Complete | 2018-03-05 14:45:45+00:00 |
+--------------------------------------+-------------+---------+----------+---------------------------+
[root@F24-Michigan ~]# ciscovim diskmgmt list check-disks all
+--------------------------------------+-------------+---------+----------+---------------------------+
| ID                                   | Action      | Role    | Status   | Created                   |
+--------------------------------------+-------------+---------+----------+---------------------------+
| cdfd18c1-6346-47a2-b0f5-661305b5d160 | check-disks | all     | Complete | 2018-03-05 14:43:50+00:00 |
| 861d4d73-ffee-40bf-9348-13afc697ee3d | check-disks | control | Complete | 2018-03-05 14:44:47+00:00 |
| 0be7a55a-37fe-43a1-a975-cbf93ac78893 | check-disks | compute | Complete | 2018-03-05 14:45:45+00:00 |
| 0c6d27c8-bdac-493b-817e-1ea8640dae57 | check-disks | control | Complete | 2018-03-07 21:12:20+00:00 |
+--------------------------------------+-------------+---------+----------+---------------------------+
Step 4
Run the following command to show the detailed results of a diskmgmt check-disks operation:
# ciscovim diskmgmt show check-disks control --id 0c6d27c8-bdac-493b-817e-1ea8640dae57
+----------------------------+----------------------+-------------------------------+---------+--------------------------+
| Message                    | Host                 | Role                          | Server  | State                    |
+----------------------------+----------------------+-------------------------------+---------+--------------------------+
| Raid Health Status         | f24-michigan-micro-1 | block_storage control compute | 7.7.7.7 | Optimal                  |
|                            | f24-michigan-micro-2 | block_storage control compute | 7.7.7.6 | Optimal                  |
|                            | f24-michigan-micro-3 | block_storage control compute | 7.7.7.5 | Optimal                  |
|                            |                      |                               |         |                          |
| VD Health Status           | f24-michigan-micro-1 | block_storage control compute | 7.7.7.7 | Optimal                  |
|                            | f24-michigan-micro-2 | block_storage control compute | 7.7.7.6 | Optimal                  |
|                            | f24-michigan-micro-3 | block_storage control compute | 7.7.7.5 | Optimal                  |
|                            |                      |                               |         |                          |
| RAID Level and Type        | f24-michigan-micro-1 | block_storage control compute | 7.7.7.7 | Type - HW; Level - RAID1 |
|                            | f24-michigan-micro-2 | block_storage control compute | 7.7.7.6 | Type - HW; Level - RAID1 |
|                            | f24-michigan-micro-3 | block_storage control compute | 7.7.7.5 | Type - HW; Level - RAID1 |
|                            |                      |                               |         |                          |
| Number of Physical Disks   | f24-michigan-micro-1 | block_storage control compute | 7.7.7.7 | 8                        |
|                            | f24-michigan-micro-2 | block_storage control compute | 7.7.7.6 | 8                        |
|                            | f24-michigan-micro-3 | block_storage control compute | 7.7.7.5 | 8                        |
|                            |                      |                               |         |                          |
| Number of Virtual Disks    | f24-michigan-micro-1 | block_storage control compute | 7.7.7.7 | 1                        |
|                            | f24-michigan-micro-2 | block_storage control compute | 7.7.7.6 | 1                        |
|                            | f24-michigan-micro-3 | block_storage control compute | 7.7.7.5 | 1                        |
|                            |                      |                               |         |                          |
| Boot Drive Disk Media-Type | f24-michigan-micro-1 | block_storage control compute | 7.7.7.7 | HDD                      |
|                            | f24-michigan-micro-2 | block_storage control compute | 7.7.7.6 | HDD                      |
|                            | f24-michigan-micro-3 | block_storage control compute | 7.7.7.5 | SSD                      |
+----------------------------+----------------------+-------------------------------+---------+--------------------------+
State Keys:
DHS-Dedicated Hot Spare|UGood-Unconfigured Good|GHS-Global Hotspare
UBad-Unconfigured Bad|Onln-Online|Offln-Offline
Rbld-Rebuilding|JBOD-Just a Bunch Of Disks
Step 5
Run the following command to delete the diskmgmt check-disks:
Delete a diskmgmt check-disks result:
Note
We recommand you to delete the tests which are not in use.
OSD-Maintenance Tool
In VIM you can use the osd-maintenance tool to check the status of all OSDs that are present in running and operational block
storage nodes. OSD maintenance tool gives you the detailed information about the status of the OSDs - if they are Up or Down,
in addition to what HDD corresponds to which OSD, including the slot number and server hostname.
If it is down OSD is discovered after check_osds is performed, run the cluster recovery and recheck.
If still down, wait 30 minutes before attempting replace - time for ceph-mon to sync.
Physically remove and insert a new disk before attempting replace.
For smooth operation, wipe out disk before attempting replace operations.
Need a dedicated journal SSD for each storage server where osdmgmt is attempted.
Only allowed to replace one OSD at a time. Space out each replace OSD by 30 minutes - time for ceph-mon to sync.
Call TAC if any issue is hit. Do not reattempt.
To check the status of the osdmgmt tool log in to the management node and run the ciscovim command with the osdmgmt option.
The osdmgmt user interface allows you to create, list, show, and delete workflow.
Use ‘ciscovim osdmgmt create …’ command to initiate a check and replace OSD operation
Use ‘ciscovim osdmgmt list …’ command to view summary and status of current OSD operations
Use ‘ciscovim osdmgmt show … --id <ID>’ command to view detail OSD operation results
Use ‘ciscovim osdmgmt delete … --id <ID>’ command to delete the results.
Examples of usage of this tool:
Procedure
Step 1
Run the Help command to see all the option:
# ciscovim help osdmgmt
usage: ciscovim osdmgmt [--server <node1,node2,...>] [--detail] [--id <id>]
                        [--osd <osd_name>] [--locator {on,off}]
                        [--json-display] [-y]
                        create|delete|list|show check-osds|replace-osd

OSD maintenance helper

Positional arguments:
  create|delete|list|show     The control command to perform
  check-osds|replace-osd      The identity of the task/action

Optional arguments:
  --server <node1,node2,...>  List of specific block_storage hostnames
  --detail                    Display full OSD details
  --id <id>                   ID used to identify specific item to
                              show/delete.
  --osd <osd_name>            Name of down OSD to replace. Eg. 'osd.xx'
  --locator {on,off}          Turn on|off locator LED for server with bad OSDs
                              and for the physical drives.
  --json-display              Show output will be in JSON format.
  -y, --yes                   Yes option to perform the action

--+------------+----------+-----------+---------------------------+-----------+
Monitor the osdmgmt check operations using te list command. Cisco Vim Osd mgmt list commands are used to monitor the currently
running test. It also helps you to view the tests that are run/ completed.
# ciscovim osdmgmt list check-osds
+--------------------------------------+------------+----------+---------------------------+
| ID                                   | Action     | Status   | Created                   |
+--------------------------------------+------------+----------+---------------------------+
| 5fd4f9b5-786a-4a21-a70f-bffac70a3f3f | check-osds | Complete | 2018-03-08 21:11:13+00:00 |
| 4efd0be8-a76c-4bc3-89ce-142de458d844 | check-osds | Complete | 2018-03-08 21:31:01+00:00 |
+--------------------------------------+------------+----------+---------------------------+
Step 4
To show the detailed results of a osdmgmt check-osds operation run the following command:
To delete the check-disk osds run the following command:
# ciscovim osdmgmt delete check-osds --id 5fd4f9b5-786a-4a21-a70f-bffac70a3f3f

Perform the action. Continue (Y/N)Y
Delete of UUID 5fd4f9b5-786a-4a21-a70f-bffac70a3f3f Successful

[root@F24-Michigan ~]# ciscovim osdmgmt list check-osds
+--------------------------------------+------------+----------+---------------------------+
| ID                                   | Action     | Status   | Created                   |
+--------------------------------------+------------+----------+---------------------------+
| 4efd0be8-a76c-4bc3-89ce-142de458d844 | check-osds | Complete | 2018-03-08 21:31:01+00:00 |
+--------------------------------------+------------+----------+---------------------------++--------------------+------------------------+---------------+----------+-----------------+
Utility to Resolve Cisco VIM Hardware Validation Failures
The Cisco VIM Hardware Validation utility tool is used to perform hardware validation during the installation of UCS C-series
servers. It captures the user and environmental hardware validation errors that occur during the installation process. The
tool enables you to fix these errors that are based on the inputs you provide at the Command Line Interface (CLI). It validates
the updated configurations to verify if the changes are applied properly. After the error is resolved, you can resume the
installation from the point of failure.
The ciscovim hardware-mgmt user interface allows you to test the job validate orresolve-failures(create), list, show, and
delete workflow
Hardware-mgmt user workflow:
Use “ciscovim hardware-mgmt validate …” command to initiate a validation.
Use “ciscovim hardware-mgmt list …” command to view summary/status of current test jobs.
Use “ciscovim hardware-mgmt show … --id <ID>” command to view detail test results
Use “ciscovim hardware-mgmt delete … --id <ID>” to delete test results.
A database of results is maintained so that the user can keep the results of multiple hardware-mgmt operations and view them
at any time.
Note
You cannot use the utility for the following tasks:
Configuring BIOS settings for the B-series pods.
Upgrading or changing the firmware version.
Resolving hardware failures other than lom, hba, flexflash, pcie_slot, power, and vnic_pxe_boot.
Command
Usage
To capture the list of failures that can be resolved by using the utility, go to the install directory and execute the help
command:
# cd <installer-id>/clouddeploy
# python hw_validations.py -help
.
The following shows the output of the help command.
usage: hw_validations.py [-h] [--resolve-failures RESOLVE_FAILURES]
[--validate VALIDATE_OF] [-y] [--host HOSTS]
[--file SETUP_FILE_LOCATION]
UCS Hardware Validations
optional arguments:
-h, --help show this help message and exit
--resolve-failures RESOLVE_FAILURES, -rf RESOLVE_FAILURES
                      all - Fix all the failures.
                      lom - Fix LOM port(s) status failures.
                      hba - Fix HBA port status failures.
                      flexflash - Fix Flexflash failures.
                      pcie_slot - Fix PCIe slot status failures.
                      power - Fix Power failures.
                      vnic_pxe_boot - Fix Vnic PXE_Boot statusfailures
-y, -yes
--host HOSTS Comma separated list of hostnames
--file SETUP_FILE_LOCATION, -f SETUP_FILE_LOCATION
            Provide a valid 'setup_data.yaml' file
Enables you to specify the failure that you want to resolve.
The optional arguments are as follows:
[-y]
Yes
[--host HOSTS]
Enables you to specify the hostname of the server for which you want to resolve failures. You cannot specify the IP address
or CIMC IP address of servers as arguments. You can specify a list of hostnames as comma-separated arguments.
If the -host option is not specified, the failures of all the
servers that are specified in the setup_data.yaml file are resolved.
[--file SETUP_FILE_LOCATION]
[-f SETUP_FILE_LOCATION]
Enables you to specify the name of a setup_data.yaml file.
Examples of
Command Usage
The following table provides the commonly used commands along with
their examples.
Purpose
Syntax
Example
To resolve all failures.
python hw_validations.py --resolve-failures all -y
python hw_validations.py --resolve-failures all -y
The --debug option enables you to get verbose logging on the ciscovim client console. You can use verbose logging to troubleshoot
issues with the ciscovim client.
The debug option has the following parts:
Curl Command: Curl command can be used for debugging. It can be executed standalone. Curl Command also displays the REST API
Endpoint and the Request Payload.
Response of REST API
Examples of Using debug Option to get list of passwords
Example of Getting Response from REST API using Curl Commands
Get the REST API Password.
# cat /opt/cisco/ui_config.json
{
"Kibana-Url": "http://172.31.231.17:5601",
"RestAPI-Url": "https://172.31.231.17:8445",
"RestAPI-Username": "admin",
"RestAPI-Password": "*******************",
"RestDB-Password": "*******************",
"BuildNodeIP": "172.31.231.17"
}

Form the Curl Command.
curl -k –u <RestAPI-Username>:<RestAPI-Password>  <RestAPI-Url>/<Endpoint>
E.g. To get Nodes Info of Cloud
curl -k -u admin:**** http://172.31.231.17:5601/v1/nodes

 Feedback