Table Of Contents
Statistics Summary
D.1 Data Transmission Process Overview
D.1 Connection Statistics
D.1.1 AXSM Connection
D.1.2 AXSM-E Connection
D.1.3 VXSM ATM Connection Statistics
D.2 Service Line Statistics
D.2.1 CESM, FRSM, SRM, and SRME T3/E3 Service
D.2.2 SRM and SRME SONET Service Line
D.2.3 AXSM Line
D.2.4 AXSM-E Line
D.3 Port Statistics
D.3.1 AXSM Port
D.3.2 AXSM-E Port
D.3.3 VXSM Port Statistics
D.4 Card Statistics
D.4.1 AXSM Card Statistics
D.5 Path Statistics
D.5.1 VXSM STS Path Statistics
D.5.2 VXSM DS3 Path Statistics
D.5.3 VXSM DS1 N DS3 Path Statistics
D.5.4 VXSM DS1 VT Path Statistics
D.6 PNNI Network Statistics
D.6.1 PNNI Nodal Statistics
D.6.2 PNNI Port Statistics
D.7 Protocol Statistics
D.7.1 VXSM Megaco Statistics
D.7.2 VXSM Megaco Physical Termination Protocol Statistics
D.7.3 VXSM Megaco Ephemeral Termination Protocol Statistics
D.7.4 VXSM LAPD Protocol Statistics
D.8 Physical Line Statistics
D.8.1 AXSM-E T1/E1 Physical Line
D.8.2 AXSM-E T3/E3 Physical Line
D.8.3 AXSM-E SONET Physical Line
D.8.4 VXSM SONET Physical Line
D.8.5 VXSM T1E1 Physical Line Statistics
Statistics Summary
This appendix defines the statistics that are collected from the following nodes:
• Cisco MGX 8880 PXM45-based
•Cisco MGX 8850 PXM45-based
Data Transmission Process Overview details how data travels through two cards that are connected across the bus.
The statistics are categorized under a major grouping known by an object type name and organized by the subobject type number. Within the subtype, each statistic contains a statistic type number.
The following sections provide the reporting parameters for the various statistic types:
•Data Transmission Process Overview
•Service Line Statistics
•Port Statistics
•Card Statistics
•Path Statistics
•PNNI Network Statistics
•Protocol Statistics
•Physical Line Statistics
The statistics are organized in ascending order by object type then subobject type.
Note The IDs of the statistics that are collected by Cisco MGM do not correspond to the IDs of the statistics that are collected by the switch.
D.1 Data Transmission Process Overview
Statistics are collected at different points during data transmission. Figure 1 shows how data travels through two cards that are connected across the bus.
Figure 1 Data Flow Through Two Cards Connected Across a Bus
The ingress direction describes traffic that travels toward the bus. The egress direction describes traffic that travels from the bus.
The numbers in Figure 1 correspond to the points at which statistics are collected. Points 1-7 show data on the incoming path with policing. Points 8-13 show data on the return path without policing.
•1—Data enters the UNI/NNI port card (ingress).
•2—Data is queued (ingress).
•3—Data is scheduled for admission onto the bus (ingress).
•4—Data is queued for going onto the bus (ingress).
•5—Data is queued for being taken off the bus (egress).
•6—Data is processed on the trunk card (egress).
•7—Data is queued for going out the trunk (egress).
•8—Data enters the card from the trunk (ingress).
•9—Data is scheduled for admission onto the bus (ingress).
•10—Data is queued for going onto the bus (ingress).
•11—Data is queued for being taken off the bus (egress).
•12—Data is processed on the port card (egress).
•13—Data is queued for going out the port (egress).
Note The data flow process might vary depending on the card type. See the corresponding sections in this chapter.
D.1 Connection Statistics
The following connection statistics are applicable:
•AXSM Connection
•AXSM-E Connection
•VXSM ATM Connection Statistics
D.1.1 AXSM Connection
This section provides information about the statistics contained in the AXSM_ATM_conn group. This group contains statistics that are applicable AXSM card on the Cisco MGX 8850 PXM45-based switch.
Table D-1 lists the attributes that are common to all of the AXSM connection statistics.
Table D-1 Attributes Common to all AXSM Connection Statistics
|
Object
|
Attribute
|
Front Cards |
MGX-AXSM-16-T3E3, MGX-AXSM-16-155, MGX-AXSM-4-622, MGX-AXSM-1-2488 |
Back Cards |
MGX-SMB-8-T3, MGX-SMB-8-E3, MGX-SMB-4-155, MGX-SMFIR-8-155, MGX-SMFLR-8-155, MGX-MMF-8-155, MGX-SMFLR-2-622, MGX-SMFIR-2-622, MGX-SMFSR-1-2488, MGX-SMFLR-1-2488, MGX-SMFXLR-1-2488 |
Object Type |
0 |
Subobject Type |
12 |
Default Peak Interval |
300 seconds |
The AXSM connection statistics are used primarily for gathering billing data.
Table D-2 includes the description of each statistic and the point during the data flow at which the statistic gathers the appropriate information. Each measurement point refers to the corresponding point in Figure 1.
Table D-2 AXSM Connection Statistics—Descriptions
|
Stat ID
|
AXSM Connection Statistics
|
Subset of Other Statistics
|
Ingress/Egress Measurement Point
|
Description
|
0 |
Ingress CLP0 Cells From Port |
No |
Ingress-2, 8 |
Provides a count of the ingress cells with cell loss priority (CLP) equal to 0 that are received. Range: 0 to (240-1) cells |
1 |
Ingress CLP1 Cells From Port |
No |
Ingress-2, 8 |
Provides a count of the ingress cells with CLP equal to 1 that are received. Range: 0 to (240-1) cells |
2 |
Ingress CLP0 cells discarded |
Ingress CLP0+1 cells discarded |
Ingress-2, 8 |
Provides a count of the ingress cells with CLP equal to 0 that are discarded due to policing. Range: 0 to (240-1) cells |
3 |
Ingress CLP0+1 cells discarded |
No |
Ingress-2, 8 |
Provides a count of the total ingress cells with CLP (0+1) that are discarded due to policing. Range: 0 to (240-1) cells |
4 |
Ingress CLP0+1 non-compliant cells |
No |
Ingress-2, 8 |
Provides a count of the total cells that are non-compliant as a result of policing. Depending on the configuration, this count includes cells that are tagged non-compliant or are discarded. Range: 0 to (240-1) cells |
5 |
Ingress EFCI=1 Cells From Port |
No |
Ingress-3, 9 |
Provides a count of the ingress explicit forward congestion indication (EFCI) cells. Range: 0 to (240-1) cells |
6 |
Ingress EOF=1 Cells From Port |
No |
Ingress-3, 9 |
Provides a count of the ingress end of frame (EOF) cells. Range: 0 to (240-1) cells |
7 |
Egress CLP0 Cells to Port |
No |
Egress-7, 13 |
Provides a count of the egress cells with CLP equal to 0. Range: 0 to (240-1) cells |
8 |
Egress CLP1 Cells to Port |
No |
Egress-7, 13 |
Provides a count of the egress cells with CLP equal to 1. Range: 0 to (240-1) cells |
9 |
Egress EFCI=1 Cells to Port |
No |
Egress-6, 12 |
Provides a count of the egress cells with EFCI equal to 1. Range: 0 to (240-1) cells |
10 |
Egress EOF=1 Cells to Port |
No |
Egress-6, 12 |
Provides a count of the egress cells with EOF equal to 1. Range: 0 to (240-1) cells |
D.1.2 AXSM-E Connection
This section provides information about the statistics contained in the AXSME_ATM_conn group. The AXSM-E connection statistics in this group are applicable to the Cisco MGX 8850 PXM45-based switch.
Table D-3 lists the attributes that are common to the AXSM-E connection statistics.
Table D-3 AXSM-E Connection Statistics—Common Attributes
|
Object
|
Attribute
|
Front Cards |
AXSM-2-622-E, AXSM-8-155-E, AXSM-16-T3E3-E |
Back Cards |
SMFLR-1-622, SMFIR-1-622, SMFLR-4-155, SMFIR-4-155, MMF-4-155, SMB-4-155, SMB-8-T3, SMB-8-E3 |
Object Type |
0 |
Subobject Type |
13 |
Allowable Peak Intervals |
60 seconds, 300 seconds |
Default Peak Interval |
300 seconds |
The AXSM-E connection statistics are used primarily for gathering troubleshooting and performance data.
Table D-4 includes the description of each statistic and the point during the data flow at which the statistic gathers the appropriate information. Each measurement point refers to the corresponding point in Figure 1.
Note AXSM-E statistics are only collected at measurement points 1, 2, and 13.
Table D-4 AXSM-E Connection Statistics—Descriptions
|
Stat ID
|
AXSM-E Connection Statistics
|
Subset of Other Statistics
|
Ingress/Egress Measurement Point
|
Description
|
1 |
CLP1 non-compliant cells |
Tagged non compliant cells |
Ingress-1 |
Provides a count of the discarded cells with cell loss priority (CLP) bit equal to 1 that are tagged non-compliant. Range: 0 to (240-1) cells |
2 |
CLP0 non-compliant cells |
Tagged non compliant cells |
Ingress-1 |
Provides a count of the discarded cells with CLP equal to 0 that are tagged non-compliant. Range: 0 to (240-1) cells |
3 |
Tagged non compliant cells |
No |
Ingress-1 |
Provides a count of the total number of cells that are tagged non-compliant. These cells are received at the port. Range: 0 to (240-1) cells |
5 |
CLP0 cells from port |
No |
Ingress-1 |
Provides a count of the cells with CLP equal to 0. These cells are received from the port before policing. Range: 0 to (240-1) cells |
6 |
CLP1 cells from port |
No |
Ingress-1 |
Provides a count of the cells with CLP equal to 1. These cells are received from the port before policing. Range: 0 to (240-1) cells |
8 |
EFCI=1 cells from the port |
No |
Ingress-2 |
Provides a count of the cells with the explicit forward congestion indication (EFCI) equal to 1. These cells are received from the port. Range: 0 to (240-1) cells |
12 |
EFCI=1 cells to the network |
No |
Ingress-2 |
Provides a count of the cells with EFCI equal to 1 that are transmitted to the bus after policing. Range: 0 to (240-1) cells |
14 |
Ingress CLP0 cells discarded in qe |
No |
Ingress-2 |
Provides a count of the cells with CLP equal to 0 that are discarded due to an overflow in the queuing engine. Range: 0 to (240-1) cells |
15 |
Ingress CLP1 cells discarded in qe |
No |
Ingress-2 |
Provides a count of the cells with CLP equal to 1 that are discarded due to an overflow in the queuing engine. Range: 0 to (240-1) cells |
19 |
CLP1 cells to the port |
No |
After 13 |
Provides a count of the cells with CLP equal to 1 that are transmitted to the port. Range: 0 to (240-1) cells |
20 |
CLP0 cells to the port |
No |
After 13 |
Provides a count of the cells with CLP equal to 0 that are transmitted to the port. Range: 0 to (240-1) cells |
23 |
EFCI=1 cells to the port |
No |
Egress-13 |
Provides a count of the cells with EFCI equal to 1 that are transmitted to the port. Range: 0 to (240-1) cells |
28 |
EFC1=1 cells from the network |
No |
Egress-13 |
Provides a count of the cells with EFCI equal to 1 that are received from the bus prior to queuing. Range: 0 to (240-1) cells |
30 |
Egress CLP0 cells discarded in qe |
No |
Egress-13 |
Provides a count of the cells with CLP equal to 0 that are discarded due to an overflow in the queuing engine. Range: 0 to (240-1) cells |
31 |
Egress CLP1 cells discarded in qe |
No |
Egress-13 |
Provides a count of the cells with CLP equal to 1 that are discarded due to an overflow in the queuing engine. Range: 0 to (240-1) cells |
D.1.3 VXSM ATM Connection Statistics
This section provides information about the statistics contained in the VXSM_ATM_conn group. The VXSM connection statistics are applicable to the VXSM cards on the Cisco MGX 8880 PXM45-based nodes and the Cisco MGX 8850 PXM45-based nodes.
Table D-5 lists the attributes that are common to all of the VXSM connection statistics.
Table D-5 Attributes Common to all VXSM Connection Statistics
|
Object
|
Attribute
|
Front Card |
VXSM |
Back Card |
VXSM-BC-4-155 |
Object Type |
0 |
Subobject Type |
17 |
Default Peak Interval |
300 seconds |
Table D-6 includes the VXSM ATM connection statistics.
Table D-6 VXSM ATM Connection Statistics—Descriptions
|
Stat ID
|
VXSM ATM Connection Statistics
|
Subset of Other Statistics
|
Ingress/Egress Measurement Point
|
Description
|
0 |
Total Ingress Cells from port |
— |
Ingress |
Provides a count of the total ingress cells. Range: 0 to (264-1) |
1 |
CLP0 cells from port (before policing) |
— |
Ingress-1 |
Provides a count of the ingress cells with cell loss priority (CLP) equal to 0 that are received prior to policing. Range: 0 to (264-1) |
2 |
CLP1 cells from port (before policing) |
— |
Ingress-1 |
Provides a count of the ingress cells with cell loss priority (CLP) equal to 1 that are received prior to policing. Range: 0 to (264-1) |
3 |
EFCI=1 CLP0 cells from the port |
— |
Ingress |
Provides a count of the CLP0 cells with the explicit forward congestion indication (EFCI) equal to 1. These cells are received from the port. Range: 0 to (264-1) |
4 |
EFCI=1 CLP1 cells from the port |
— |
Ingress |
Provides a count of the CLP1 cells with the explicit forward congestion indication (EFCI) equal to 1. These cells are received from the port. Range: 0 to (264-1) |
5 |
Total Egress Cells to network |
— |
Egress |
Provides a count of the total egress cells. Range: 0 to (264-1) |
6 |
CLP0 cells to network (before policing) |
— |
Egress-1 |
Provides a count of the egress cells with cell loss priority (CLP) equal to 0 that are received prior to policing. Range: 0 to (264-1) |
7 |
CLP1 cells to network (before policing) |
— |
Egress-1 |
Provides a count of the egress cells with cell loss priority (CLP) equal to 1 that are received prior to policing. Range: 0 to (264-1) |
8 |
EFCI=1 CLP0 cells to the network |
— |
Egress |
Provides a count of the CLP0 cells with the explicit forward congestion indication (EFCI) equal to 1. Range: 0 to (264-1) |
9 |
EFCI=1 CLP1 cells to the network |
— |
Egress |
Provides a count of the CLP1 cells with the explicit forward congestion indication (EFCI) equal to 1. Range: 0 to (264-1) |
D.2 Service Line Statistics
The following service line statistics are applicable:
•CESM, FRSM, SRM, and SRME T3/E3 Service
•SRM and SRME SONET Service Line
•AXSM Line
•AXSM-E Line
D.2.1 CESM, FRSM, SRM, and SRME T3/E3 Service
This section provides information about the statistics contained in the MGX-T3/E3 group. The CESM, FRSM, SRM, and SRME T3/E3 service line statistics are applicable to the Cisco MGX 8230, Cisco MGX 8250, Cisco MGX 8850 PXM1-based nodes.
Table D-7 lists the attributes that are common to all of the CESM, FRSM, SRM, and SRME T3/E3 service line statistics.
Table D-7 Attributes Common to all CESM, FRSM, SRM, and SRME T3/E3 Service Line Statistics
|
Object
|
Attribute
|
Front Cards |
AX-CESM-8T1, AX-CESM-8E1, MGX-CESM-T3, MGX-CESM-E3, FRSM-8T1, FRSM-8E1, FRSM-2CT3, FRSM-2T3, FRSM-2E3, FRSM-HS2, FRSM-HS1, SRM-3T3, SRME-3T3 |
Back Cards |
RJ48-8T1, RJ48-8E1, SMB-8E1, BNC-2T3, BNC-2E3, SCSC2-2HSSI |
Object Type |
1 |
Subobject Type |
6 |
Default Peak Interval |
60 seconds (fixed setting) |
The CESM, FRSM, SRM, and SRME T3/E3 service line statistics are used primarily for gathering billing and performance
Table D-8 includes the description of each statistic and the point during the data flow at which the statistic gathers the appropriate information. Each measurement point refers to the corresponding point in Figure 1.
Table D-8 CESM, FRSM, SRM, and SRME T3/E3 Service Line Statistics—Descriptions
|
Stat ID
|
CESM, FRSM, SRM, and SRME T3/E3 Service Line Statistics
|
Subset of Other Statistics
|
Ingress/Egress Measurement Point
|
Description
|
2 |
Out of Frames |
No |
Ingress-1 |
Provides a count of the times an out of frame (OOF) is detected. The count includes the number of OOF alarms. Range: 0 to (232-1) |
3 |
Losses of Signal |
No |
Ingress-1 |
Provides a count of the times a loss of signal (LOS) is detected. The count includes the number of LOS alarms. Range: 0 to (232-1) |
28 |
B3ZS Line Code Violations |
No |
Ingress-1 |
Provides a count of the B3ZS line code violations that are encountered by the interface. These violations occur when more than three zeroes in a row are transmitted. Range: 0 to (232-1) |
29 |
Line Errored Seconds |
No |
Ingress-1 |
Provides a count of the line code violation errored seconds that occur within the collection interval. Range: 0 to (232-1) |
30 |
Line Severely Errored Seconds |
Line Errored Seconds |
Ingress-1 |
Provides a count of the line code violation severely errored seconds (SES) that occur within the collection interval. Severely errored seconds are classified as errored seconds that are greater than the total line bits per second multiplied by 10-6. Range: 0 to (232-1) |
31 |
P-bit Line Parity Errors |
No |
Ingress-1 |
Provides a count of the parity bit (P-bit) code violations that are encountered by the interface. Range: 0 to (232-1) |
32 |
Errored Seconds-Parity |
No |
Ingress-1 |
Provides a count of the parity code violation (PCV) errored seconds that occur within the collection interval. Range: 0 to (232-1) |
33 |
Severely Errored Seconds- Parity |
Errored Seconds-Parity |
Ingress-1 |
Provides a count of the P-bit code SES violations that occur within the collection interval. Range: 0 to (232-1) |
34 |
C-bit Parity Code Violations |
No |
Ingress-1 |
Provides a count of the C Bit code violations that are encountered by the interface. Range: 0 to (232-1) |
35 |
Errored Seconds-Path |
No |
Ingress-1 |
Provides a count of the PCV errored seconds that occur within the collection interval. Range: 0 to (232-1) |
36 |
Severely Errored Seconds- Path |
Errored Seconds-Path |
Ingress-1 |
Provides a count of the PCV severely errored seconds that occur within the collection interval. Range: 0 to (232-1) |
37 |
Severely Errored Framing Seconds |
No |
Ingress-1 |
Provides a count of the severely errored framing seconds that occur within the collection interval. Range: 0 to (232-1) |
38 |
Alarm Indication Signal Seconds |
No |
Ingress-1 |
Provides a count of the alarm seconds that occur within the collection interval. Range: 0 to (232-1) |
39 |
Unavailable Seconds |
No |
Ingress-1 |
Provides a count of the unavailable seconds that occur within the collection interval. Range: 0 to (232-1) |
144 |
FEBE Counts |
No |
Ingress-1 |
Provides a count of the far end block errors (FEBEs) that are detected. Range: 0 to (232-1) |
145 |
FE Counts |
No |
Ingress-1 |
Provides a count of the framing pattern errors that are encountered by a DS3/E3 interface. Range: 0 to (232-1) |
150 |
YEL Transitions |
No |
Ingress-1 |
Provides a count of the times yellow alarms are detected. The count includes the number of remote alarm indicator (RAI) alarms. Range: 0 to (232-1) |
220 |
Excessive Zero Counts |
No |
Ingress-1 |
Provides a count of the excessive zero bits that are encountered by the interface. Excessive zeros are three or more zeros occurring on the line. Range: 0 to (232-1) |
221 |
PLCP OOF Transition Counts |
No |
Ingress-1 |
Provides a count of the times the OOF is detected by the physical layer convergence protocol (PLCP) interface. Range: 0 to (232-1) |
222 |
PLCP Remote Alarm Indication |
No |
Ingress-1 |
Provides a count of the remote alarms that are detected by the PLCP interface. Range: 0 to (232-1) |
223 |
PLCP Framing Errors |
No |
Ingress-1 |
Provides a count of the framing errors that are detected by the PLCP interface. Range: 0 to (232-1) |
224 |
PLCP FEBE Counts |
No |
Ingress-1 |
Provides a count of the FEBEs that are encountered by the PLCP interface. Range: 0 to (232-1) |
225 |
PLCP FEBE Err Secs |
No |
Ingress-1 |
Provides a count of the FEBE seconds that occur within the collection interval. Range: 0 to (232-1) |
226 |
PLCP FEBE Severely Err Secs |
PLCP FEBE Err Secs |
Ingress-1 |
Provides a count of the FEBE severely errored seconds that occur within the collection interval. Range: 0 to (232-1) |
227 |
PLCP HCS Errors |
No |
Ingress-1 |
Provides a count of the cell header checksum errors that are encountered by the PLCP interface. Range: 0 to (232-1) |
228 |
PLCP HCS Errored Secs |
No |
Ingress-1 |
Provides a count of the cell header checksum errored seconds that occur within the collection interval. Range: 0 to (232-1) |
229 |
PLCP HCS Severely Errored Secs |
PLCP HCS Err Secs |
Ingress-1 |
Provides a count of the cell header checksum severely errored seconds that occur within the collection interval. Range: 0 to (232-1) |
230 |
PLCP BIP-8 Code Violations |
No |
Ingress-1 |
Provides a count of the BIP-8 code violations that are encountered by the interface. Range: 0 to (232-1) |
231 |
PLCP BIP8 CV Err Secs |
No |
Ingress-1 |
Provides a count of the BIP-8 code violation errored seconds that occur within the collection interval. Range: 0 to (232-1) |
232 |
PLCP BIP8 CV Severely Err Secs |
PLCP BIP8 CV Err Secs |
Ingress-1 |
Provides a count of the BIP-8 code violation severely errored seconds that occur within the collection interval. Range: 0 to (232-1) |
233 |
PLCP Severely Err Framing Secs |
No |
Ingress-1 |
Provides a count of the severely errored framing seconds that occur within the collection interval. Range: 0 to (232-1) |
234 |
PLCP Unavailable Secs |
No |
Ingress-1 |
Provides a count of the unavailable seconds that occur within the collection interval. Range: 0 to (232-1) |
235 |
Alarm Indication Signal Severely Seconds |
No |
Ingress-1 |
Provides a count of the alarm indication signal (AIS) severely errored seconds that occur within the collection interval. Range: 0 to (232-1) |
D.2.2 SRM and SRME SONET Service Line
This section provides information about the statistics contained in the SONET group. The SONET line statistics are applicable to the SRM and SRME cards on the Cisco MGX 8230, Cisco MGX 8250, and Cisco MGX 8850 PXM1-based nodes.
Table D-9 lists the attributes that are common to all of the SONET line statistics.
Table D-9 Attributes Common to all SONET Line Statistics
|
Object
|
Attribute
|
Front Card |
SRM, SRME |
Back Card |
SRM-3T3-NOBC |
Object Type |
1 |
Subobject Type |
10 |
Default Peak Interval |
60 seconds (fixed setting) |
The SRM and SRME SONET line statistics are used primarily for gathering billing and performance data.
Table D-10 includes the description of each statistic and the point during the data flow at which the statistic gathers the appropriate information. Each measurement point refers to the corresponding point in Figure 1.
Table D-10 SRM and SRME SONET Line Statistics—Descriptions
|
Stat ID
|
SRM and SRME SONET Line Statistics
|
Subset of Other Statistics
|
Ingress/Egress Measurement Point
|
Description
|
236 |
Sonet Loss of Signal |
— |
— |
Provides a count of the times a loss of signal (LOS) is detected. The count includes the number of LOS alarms. Range: 0 to (232-1) |
237 |
Sonet Loss of Frames |
— |
— |
Provides a count of the loss of frames (LOFs) that are encountered by a SONET line. Range: 0 to (232-1) |
238 |
Sonet Path alarm Indictn sgnl secs |
— |
— |
Provides a count of the alarm indication signal (AIS) instances on the path. Range: 0 to (232-1) |
239 |
Sonet Remote Failure Indication |
— |
— |
Provides a count of the remote failure indications (RFIs) that occur. Range: 0 to (232-1) |
240 |
Sonet Line Alarm indication signal |
— |
— |
Provides a count of the times that an alarm indication signal is detected on the line. Range: 0 to (232-1) |
241 |
Sonet Line Remote Far end Indicatn |
— |
— |
Provides a count of the remote failure indications (RFIs) that are encountered by a SONET line. Range: 0 to (232-1) |
D.2.3 AXSM Line
This section provides information about the ATM line statistics contained in the AXSM_ATM_line group. The AXSM ATM line statistics are applicable to the Cisco MGX 8850 PXM45-based switch.
Table D-11 lists the attributes that are common to all of the AXSM line statistics.
Table D-11 Attributes Common to all AXSM Line Statistics
|
Object
|
Attribute
|
Front Card |
MGX-AXSM-16-T3E3, MGX-AXSM-16-155, MGX-AXSM-4-622, MGX-AXSM-1-2488 |
Back Cards |
MGX-SMB-8-T3, MGX-SMB-8-E3, MGX-SMB-4-155, MGX-SMFIR-8-155, MGX-SMFLR-8-155, MGX-MMF-8-155, MGX-SMFLR-2-622, MGX-SMFIR-2-622, MGX-SMFSR-1-2488, MGX-SMFLR-1-2488, MGX-SMFXLR-1-2488 |
Object Type |
1 |
Subobject Type |
11 |
Default Peak Interval |
300 seconds |
The AXSM line statistics are used primarily for gathering billing data.
Table D-12 includes the description of each statistic and the point during the data flow at which the statistic gathers the appropriate information. Each measurement point refers to the corresponding point in Figure 1.
Table D-12 AXSM Line Statistics—Descriptions
|
Stat ID
|
AXSM Line Statistics
|
Subset of Other Statistics
|
Ingress/Egress Measurement Point
|
Description
|
0 |
Ingress CLP0 Cells From Port |
Ingress CLP0+1 Cells |
Ingress-2, 8 |
Provides a count of the ingress cells with cell loss priority (CLP) equal to 0 that are received. Range: 0 to (240-1) cells |
1 |
Ingress CLP1 Cells From Port |
Ingress CLP0+1 Cells |
Ingress-2, 8 |
Provides a count of the ingress cells with CLP equal to 1 that are received. Range: 0 to (240-1) cells |
2 |
Ingress CLP0+1 Cells From Port |
No |
Ingress-2, 8 |
Provides a count of the ingress cells with CLP (0+1) that are received. Range: 0 to (240-1) cells |
3 |
Ingress UPC CLP0 Discards |
Ingress UPC CLP0+1 Discards |
Ingress-2, 8 |
Provides a count of the total cells with CLP equal to 0 that are discarded due to usage parameter control (UPC). Range: 0 to (240-1) cells |
4 |
Ingress UPC CLP0+1 Discards |
No |
Ingress-2, 8 |
Provides a count of the total cells with CLP (0+1) that are discarded due to UPC. Range: 0 to (240-1) cells |
5 |
Ingress Non-Compliant CLP0+1 |
No |
Ingress-2, 8 |
Provides a count of the total cells with CLP (0+1) that are non-compliant or discarded due to policing. Range: 0 to (240-1) cells |
6 |
Ingress Total Valid
OAM Cells |
No |
Ingress-2, 8 |
Provides a count of the ingress operation, administration, and maintenance (OAM) cells that have a valid cell type and function type. Range: 0 to (240-1) cells |
7 |
Ingress Total Valid RM Cells |
No |
Ingress-2, 8 |
Provides a count of the ingress resource management (RM) cells that have a valid cell type and function type. Range: 0 to (240-1) cells |
8 |
Ingress Total Errored OAM/RM cells |
No |
Ingress-2, 8 |
Provides a count of the total errored OAM and RM cells in the ingress direction. The errored cells include: •OAM cells with an incorrect CRC-10 •Undefined OAM or function type •RM cells with an incorrect CRC-10 Range: 0 to (240-1) cells |
9 |
Ingress non-zero GFC cells |
No |
Ingress-2, 8 |
Provides a count of the cells with a non-zero generic flow control (GFC) field. This statistic is applicable only for UNI and ingress directions. Range: 0 to (240-1) cells |
10 |
Ingress Invalid VPI/VCI Cells |
No |
Ingress-2, 8 |
Provides a count of the ingress cells with an unassigned or invalid virtual path identifier (VPI) or virtual channel identifier (VCI). Range: 0 to (240-1) cells |
11 |
Ingress Last Unknown VPI.VCI (invalid) |
No |
Ingress-2, 8 |
Provides the last unknown VPI.VCI value on the line. Range: VPI/VCI value |
12 |
Ingress HEC Errored Cells Discarded |
Ingress Total HEC-errored Cells |
Ingress-2, 8 |
Provides a count of the header error control (HEC) errored cells that are discarded on the line. Range: 0 to (240-1) cells |
13 |
Ingress HEC Errored Cells Corrected |
Ingress Total HEC-errored Cells |
Ingress-2, 8 |
Provides a count of the HEC errored cells that are corrected on the line. Range: 0 to (240-1) cells |
14 |
Ingress Total HEC-errored cells |
No |
Ingress-2, 8 |
Provides a count of the total HEC errored cells that are received on the line. Range: 0 to (240-1) cells |
15 |
Egress CLP0 Cells to Port |
Egress CLP0+1 Cells |
Egress-7, 13 |
Provides a count of the egress cells with CLP equal to 0. Range: 0 to (240-1) cells |
16 |
Egress CLP1 Cells to Port |
Egress CLP0+1 Cells |
Egress-7, 13 |
Provides a count of the egress cells with CLP equal to 1. Range: 0 to (240-1) cells |
17 |
Egress CLP0+1 Cells to Port |
No |
Egress-7, 13 |
Provides a count of the egress cells with CLP (0+1). Range: 0 to (240-1) cells |
18 |
Egress OAM Valid cells |
No |
Egress-7, 13 |
Provides a count of the egress valid OAM cells. Range: 0 to (240-1) cells |
19 |
Egress RM Valid Cells |
No |
Egress-7, 13 |
Provides a count of the egress RM valid cells. Range: 0 to (240-1) cells |
20 |
Egress OAM/RM Errored Cells |
No |
Egress-7, 13 |
Provides a count of the errored OAM and RM cells in the egress direction. The errored cells include: •OAM cells with an incorrect CRC-10 •Undefined OAM type or function type •RM cells with an incorrect CRC-10 Range: 0 to (240-1) cells |
21 |
Egress Invalid VPI/VCI Cells |
No |
Egress-7, 13 |
Provides a count of the egress cells with errored headers. This count includes cells with an unassigned or invalid VPI or VCI. Range: 0 to (240-1) cells |
D.2.4 AXSM-E Line
This section provides information about the ATM statistics contained in the AXSME_ATM_line group. The AXSM-E line statistics in this group are applicable to the Cisco MGX 8850 PXM45-based switch.
Table D-13 lists the attributes that are common to the AXSM-E line statistics.
Table D-13 Attributes Common to all AXSM-E Line Statistics
|
Object
|
Attribute
|
Front Cards |
AXSM-2-622-E, AXSM-8-155-E, AXSM-16-T3E3-E |
Back Cards |
SMFLR-1-622, SMFIR-1-622, SMFLR-4-155, SMFIR-4-155, MMF-4-155, SMB-4-155, SMB-8-T3, SMB-8-E3 |
Object Type |
1 |
Subobject Type |
12 |
Allowable Peak Intervals |
60 seconds, 300 seconds |
Default Peak Interval |
300 seconds |
The AXSM-E line statistics are used primarily for gathering troubleshooting and performance data.
Table D-14 includes the description of each statistic and the point during the data flow at which the statistic gathers the appropriate information. Each measurement point refers to the corresponding point in Figure 1.
Note AXSM-E statistics are only collected at measurement points 1, 2, and 13.
Table D-14 AXSM-E Line Statistics—Descriptions
|
Stat ID
|
AXSM-E Line Statistics
|
Subset of Other Statistics
|
Ingress/Egress Measurement Point
|
Description
|
0 |
Ingress CLP0 cells received |
Cells received |
Ingress-1 |
Provides a count of the ingress cells with cell loss priority (CLP) equal to 0 that are received. Range: 0 to (240-1) cells |
1 |
Ingress CLP1 cells received |
Cells received |
Ingress-1 |
Provides a count of the ingress cells with CLP equal to 1 that are received. Range: 0 to (240-1) cells |
2 |
Ingress valid OAM cells received |
No |
Ingress-1 |
Provides a count of the operation, administration, and maintenance (OAM) that are received at the port. Range: 0 to (240-1) cells |
3 |
Ingress valid RM cells received |
No |
Ingress-1 |
Provides a count of the resource management (RM) cells that are received at the port. Range: 0 to (240-1) cells |
4 |
UNI only cells received |
No |
Ingress-1 |
Provides a count of the cells tagged as UNI. These cells are received at the port. Range: 0 to (240-1) cells |
5 |
Error OAM cells received |
No |
Ingress-1 |
Provides a count of the errored OAM cells that are received. The errored cells include: •OAM cells with an incorrect CRC-10 •Undefined OAM type or function type Range: 0 to (240-1) cells |
6 |
Ingress cells received with header error |
No |
Before-1 |
Provides a count of the total cells with a header error. These cells are received at the port. Range: 0 to (240-1) cells |
7 |
Egress CLP0 cells received |
Cells transmitted |
After 13 |
Provides a count of the cells with CLP equal to 0 that are received at the port in the egress direction. Range: 0 to (240-1) cells |
8 |
Egress CLP1 cells received |
Cells transmitted |
After 13 |
Provides a count of the cells with CLP equal to 1 that are received at the port in the egress direction. Range: 0 to (240-1) cells |
9 |
Egress valid OAM cells received |
Cells transmitted |
After 13 |
Provides a count of the OAM cells that are received at the port in the egress direction. Range: 0 to (240-1) cells |
10 |
Egress valid RM cells received |
Cells transmitted |
After 13 |
Provides a count of the RM cells that are received at the port in the egress direction. Range: 0 to (240-1) cells |
11 |
Egress OAM cells received with errors |
No |
After 13 |
Provides a count of the errored OAM cells that are received at the port in the egress direction. The errored cells include: •OAM cells with an incorrect CRC-10 •Undefined OAM type or function type Range: 0 to (240-1) cells |
12 |
Uncorrectable header errors |
No |
Before 1 |
Provides a count of the cells that are discarded due to uncorrectable header errors. Range: 0 to (240-1) cells |
13 |
Corrected header errors |
No |
Before 1 |
Provides a count of the cells with header errors that are corrected. Range: 0 to (240-1) cells |
14 |
Idle/unassigned cells |
No |
Before 1 |
Provides a count of the idles or unassigned cells that are received. Range: 0 to (240-1) cells |
15 |
Cells received |
No |
Ingress-1 |
Provides a count of the total cells that are received at the port. Range: 0 to (240-1) cells |
16 |
Cells transmitted |
No |
After 13 |
Provides a count of the total cells that are transmitted. Range: 0 to (240-1) cells |
D.3 Port Statistics
The following port statistics are supported:
•AXSM Port
•AXSM-E Port
•VXSM Port Statistics
D.3.1 AXSM Port
This section provides information about the statistics contained in the AXSM_ATM_ port group. The statistics in this group are applicable to the Cisco MGX 8850 PXM45-based switch.
Table D-15 lists the attributes that are common to all of the AXSM port statistics.
Table D-15 Attributes Common to all AXSM Port Statistics
|
Object
|
Attribute
|
Front Cards |
MGX-AXSM-16-T3E3, MGX-AXSM-16-155, MGX-AXSM-4-622, MGX-AXSM-1-2488 |
Back Cards |
MGX-SMB-8-T3, MGX-SMB-8-E3, MGX-SMB-4-155, MGX-SMFIR-8-155, MGX-SMFLR-8-155, MGX-MMF-8-155, MGX-SMFLR-2-622, MGX-SMFIR-2-622, MGX-SMFSR-1-2488, MGX-SMFLR-1-2488, MGX-SMFXLR-1-2488 |
Object Type |
3 |
Subobject Type |
9 |
Default Peak Interval |
300 seconds |
The AXSM port statistics are used primarily for gathering performance data.
Table D-16 includes the description of each statistic and the point during the data flow at which the statistic gathers the appropriate information. Each measurement point refers to the corresponding point in Figure 1.
Table D-16 AXSM Port Statistics—Descriptions
|
Stat ID
|
AXSM Port Statistics
|
Subset of Other Statistics
|
Ingress/Egress Measurement Point
|
Description
|
0 |
Ingress CLP0 Cells From Policer |
No |
Ingress-3, 9 |
Provides a count of the cells with cell loss priority (CLP) equal to 0 that arrive at the queueing engine. The count includes both discarded and non-discarded cells. Range: 0 to (240-1) cells |
1 |
Ingress CLP1 Cells From Policer |
No |
Ingress-3, 9 |
Provides a count of the cells with CLP equal to 1 that arrive at the queueing engine. The count includes both discarded and non-discarded cells. Range: 0 to (240-1) cells |
2 |
Ingress CLP0 Cells Discarded (dropped) |
Ingress CLP0 Cells From Policer |
Ingress-3, 9 |
Provides a count of ingress cells with CLP equal to 0 that are discarded by the queueing engine. Range: 0 to (240-1) cells |
3 |
Ingress CLP1 Cells Discarded (dropped) |
Ingress CLP0 Cells From Policer |
Ingress-3, 9 |
Provides a count of ingress cells with CLP equal to 1 that are discarded by the queueing engine. Range: 0 to (240-1) cells |
4 |
Ingress CLP0 Cells to backplane |
No |
Ingress-3, 9 |
Provides a count of the cells with CLP equal to 0 that travel from the queueing engine to the bus. Range: 0 to (240-1) cells |
5 |
Ingress CLP1 Cells to backplane |
No |
Ingress-3, 9 |
Provides a count of the cells with CLP equal to 1 that travel from the queueing engine to the bus. Range: 0 to (240-1) cells |
6 |
Egress CLP0 Cells From backplane |
No |
Egress-6, 12 |
Provides a count of the cells with CLP equal to 0 that arrive at the queueing engine. The count includes both discarded and non-discarded cells. Range: 0 to (240-1) cells |
7 |
Egress CLP1 Cells From backplane |
No |
Egress-6, 12 |
Provides a count of the cells with CLP equal to 1 that arrive at the queueing engine. The count includes both discarded and non-discarded cells. Range: 0 to (240-1) cells |
8 |
Egress CLP0 Cells Discarded (dropped) |
Egress CLP0 Cells From backplane |
Egress-6, 12 |
Provides a count of egress cells with CLP equal to 0 that are discarded by the queueing engine. Range: 0 to (240-1) cells |
9 |
Egress CLP1 Cells Discarded (dropped) |
Egress CLP1 Cells From backplane |
Egress-6, 12 |
Provides a count of egress cells with CLP equal to 1 that are discarded by the queueing engine. Range: 0 to (240-1) cells |
10 |
Egress CLP0 Cells to port |
No |
Egress-6, 12 |
Provides a count of the cells with CLP equal to 0 that travel from the queueing engine to the line. Range: 0 to (240-1) cells |
11 |
Egress CLP1 Cells to port |
No |
Egress-6, 12 |
Provides a count of the cells with CLP equal to 1 that travel from the queueing engine to the line. Range: 0 to (240-1) cells |
12 |
Egress Total OAM Cells |
No |
Egress-6, 12 |
Provides a count of the operation, administration, and maintenance (OAM) cells that travel from the queueing engine to the line. Range: 0 to (240-1) cells |
D.3.2 AXSM-E Port
This section provides information about the statistics contained in the AXSME_ATM_port group. The AXSM-E port statistics in this group are applicable to the Cisco MGX 8850 PXM45-based switch.
Table D-17 lists the attributes that are common to the AXSM-E port statistics.
Table D-17 Attributes Common to all AXSM-E PortStatistics
|
Object
|
Attribute
|
Front Cards |
AXSM-2-622-E, AXSM-8-155-E, AXSM-16-T3E3-E |
Back Cards |
SMFLR-1-622, SMFIR-1-622, SMFLR-4-155, SMFIR-4-155, MMF-4-155, SMB-4-155, SMB-8-T3, SMB-8-E3 |
Object Type |
3 |
Subobject Type |
11 |
Allowable Peak Intervals |
60 seconds, 300 seconds |
Default Peak Interval |
300 seconds |
The AXSM-E port statistics are used primarily for gathering troubleshooting and performance data.
Table D-18 includes the description of each statistic and the point during the data flow at which the statistic gathers the appropriate information. Each measurement point refers to the corresponding point in Figure 1.
Note AXSM-E statistics are only collected at measurement points 1, 2, and 13.
Table D-18 AXSM-E Port Statistics—Descriptions
|
Stat ID
|
AXSM-E Port Statistics
|
Subset of Other Statistics
|
Ingress/Egress Measurement Point
|
Description
|
0 |
CLP0 cells transmitted |
No |
After 13 |
Provides a count of the cells with CLP equal to 0 that are transmitted to the port. Range: 0 to (240-1) cells |
1 |
CLP1 cells transmitted |
No |
After 13 |
Provides a count of the total cells with CLP equal to 1 that are transmitted to the port. Range: 0 to (240-1) cells |
2 |
OAM cells transmitted |
No |
After 13 |
Provides a count of the operation, administration, and maintenance (OAM) cells that are transmitted to the port. Range: 0 to (240-1) cells |
3 |
RM cells transmitted |
No |
After 13 |
Provides a count of the resource management (RM) cells that are transmitted to the port. Range: 0 to (240-1) cells |
4 |
CLP0 cells not discarded |
No |
Egress |
Provides a count of the cells with CLP equal to 0 that are received at the port. Range: 0 to (240-1) cells |
5 |
CLP1 cells not discarded |
No |
Egress |
Provides a count of the cells with CLP equal to 1 that are received at the port. Range: 0 to (240-1) cells |
6 |
CLP0 cells discarded due to congestion |
No |
Egress |
Provides a count of the cells with CLP equal to 0 that are received at the port then discarded due to congestion. Range: 0 to (240-1) cells |
7 |
CLP1 cells discarded due to congestion |
No |
Egress |
Provides a count of the cells with CLP equal to 1 that are received at the port then discarded due to congestion. Range: 0 to (240-1) cells |
8 |
OAM cells received |
No |
Egress |
Provides a count of the OAM cells that are received at the port. Range: 0 to (240-1) cells |
9 |
RM cells received |
No |
Egress |
Provides a count of the RM cells that are received at the port. Range: 0 to (240-1) cells |
10 |
EFCI cells transmitted |
No |
Egress-13 |
Provides a count of the cells with the explicit forward congestion indication (EFCI) bit set that are transmitted to the port. Range: 0 to (240-1) cells |
11 |
EFCI cells received |
No |
Egress |
Provides a count of the cells with the EFCI bit set that are received at the port. Range: 0 to (240-1) cells |
12 |
Cells received by Qbin 0 |
— |
— |
Provides a count of the cells that are received on Qbin 0. Range: 0 to (240-1) cells |
13 |
Cells discarded by
Qbin 0 |
— |
— |
Provides a count of the cells that are discarded on Qbin 0. Range: 0 to (240-1) cells |
14 |
Cells transmitted by Qbin 0 |
— |
— |
Provides a count of the cells that are transmitted out of Qbin 0. Range: 0 to (240-1) cells |
15 |
Cells received by Qbin 1 |
— |
— |
Provides a count of the cells that are received on Qbin 1. Range: 0 to (240-1) cells |
16 |
Cells discarded by
Qbin 1 |
— |
— |
Provides a count of the cells that are discarded on Qbin 1. Range: 0 to (240-1) cells |
17 |
Cells transmitted by Qbin 1 |
— |
— |
Provides a count of the cells that are transmitted by Qbin 1. Range: 0 to (240-1) cells |
18 |
Cells received by Qbin 2 |
— |
— |
Provides a count of the cells that are received on Qbin 2. Range: 0 to (240-1) cells |
19 |
Cells discarded by
Qbin 2 |
— |
— |
Provides a count of the cells that are discarded on Qbin 2. Range: 0 to (240-1) cells |
20 |
Cells transmitted by Qbin 2 |
— |
— |
Provides a count of the cells that are transmitted by Qbin 2. Range: 0 to (240-1) cells |
21 |
Cells received by Qbin 3 |
— |
— |
Provides a count of the cells that are received on Qbin 3. Range: 0 to (240-1) cells |
22 |
Cells discarded by
Qbin 3 |
— |
— |
Provides a count of the cells that are discarded on Qbin 3. Range: 0 to (240-1) cells |
23 |
Cells transmitted by Qbin 3 |
— |
— |
Provides a count of the cells that are transmitted by Qbin 3. Range: 0 to (240-1) cells |
24 |
Cells received by Qbin 4 |
— |
— |
Provides a count of the cells that are received on Qbin 4. Range: 0 to (240-1) cells |
25 |
Cells discarded by
Qbin 4 |
— |
— |
Provides a count of the cells that are discarded on Qbin 4. Range: 0 to (240-1) cells |
26 |
Cells transmitted by Qbin 4 |
— |
— |
Provides a count of the cells that are transmitted by Qbin 4. Range: 0 to (240-1) cells |
27 |
Cells received by Qbin 5 |
— |
— |
Provides a count of the cells that are received on Qbin 5. Range: 0 to (240-1) cells |
28 |
Cells discarded by
Qbin 5 |
— |
— |
Provides a count of the cells that are discarded on Qbin 5. Range: 0 to (240-1) cells |
29 |
Cells transmitted by Qbin 5 |
— |
— |
Provides a count of the cells that are transmitted by Qbin 5. Range: 0 to (240-1) cells |
30 |
Cells received by Qbin 6 |
— |
— |
Provides a count of the cells that are received on Qbin 6. Range: 0 to (240-1) cells |
31 |
Cells discarded by
Qbin 6 |
— |
— |
Provides a count of the cells that are discarded on Qbin 6. Range: 0 to (240-1) cells |
32 |
Cells transmitted by Qbin 6 |
— |
— |
Provides a count of the cells that are transmitted by Qbin 6. Range: 0 to (240-1) cells |
33 |
Cells received by Qbin 7 |
— |
— |
Provides a count of the cells that are received on Qbin 7. Range: 0 to (240-1) cells |
34 |
Cells discarded by
Qbin 7 |
— |
— |
Provides a count of the cells that are discarded on Qbin 7. Range: 0 to (240-1) cells |
35 |
Cells transmitted by Qbin 7 |
— |
— |
Provides a count of the cells that are transmitted by Qbin 7. Range: 0 to (240-1) cells |
36 |
Cells received by Qbin 8 |
— |
— |
Provides a count of the cells that are received on Qbin 8. Range: 0 to (240-1) cells |
37 |
Cells discarded by
Qbin 8 |
— |
— |
Provides a count of the cells that are discarded on Qbin 8. Range: 0 to (240-1) cells |
38 |
Cells transmitted by Qbin 8 |
— |
— |
Provides a count of the cells that are transmitted by Qbin 8. Range: 0 to (240-1) cells |
39 |
Cells received by Qbin 9 |
— |
— |
Provides a count of the cells that are received on Qbin 9. Range: 0 to (240-1) cells |
40 |
Cells discarded by
Qbin 9 |
— |
— |
Provides a count of the cells that are discarded on Qbin 9. Range: 0 to (240-1) cells |
41 |
Cells transmitted by Qbin 9 |
— |
— |
Provides a count of the cells that are transmitted by Qbin 9. Range: 0 to (240-1) cells |
42 |
Cells received by Qbin10 |
— |
— |
Provides a count of the cells that are received on Qbin 10. Range: 0 to (240-1) cells |
43 |
Cells discarded by Qbin10 |
— |
— |
Provides a count of the cells that are discarded on Qbin 10. Range: 0 to (240-1) cells |
44 |
Cells transmitted by Qbin10 |
— |
— |
Provides a count of the cells that are transmitted by Qbin 10. Range: 0 to (240-1) cells |
45 |
Cells received by Qbin11 |
— |
— |
Provides a count of the cells that are received on Qbin 11. If Qbin 11 is not assigned a traffic service, the count returns a value of 0. Range: 0 to (240-1) cells |
46 |
Cells discarded by Qbin11 |
— |
— |
Provides a count of the cells that are discarded on Qbin 11. If Qbin 11 is not assigned a traffic service, the count returns a value of 0. Range: 0 to (240-1) cells |
47 |
Cells transmitted by Qbin11 |
— |
— |
Provides a count of the cells that are transmitted by Qbin 11. If Qbin 11 is not assigned a traffic service, the count returns a value of 0. Range: 0 to (240-1) cells |
48 |
Cells received by Qbin12 |
— |
— |
Provides a count of the cells that are received on Qbin 12. If Qbin 12 is not assigned a traffic service, the count returns a value of 0. Range: 0 to (240-1) cells |
49 |
Cells discarded by Qbin12 |
— |
— |
Provides a count of the cells that are discarded on Qbin 12. If Qbin 12 is not assigned a traffic service, the count returns a value of 0. Range: 0 to (240-1) cells |
50 |
Cells transmitted by Qbin12 |
— |
— |
Provides a count of the cells that are transmitted by Qbin 12. If Qbin 12 is not assigned a traffic service, the count returns a value of 0. Range: 0 to (240-1) cells |
51 |
Cells received by Qbin13 |
— |
— |
Provides a count of the cells that are received on Qbin 13. If Qbin 13 is not assigned a traffic service, the count returns a value of 0. Range: 0 to (240-1) cells |
52 |
Cells discarded by Qbin13 |
— |
— |
Provides a count of the cells that are discarded on Qbin 13. If Qbin 13 is not assigned a traffic service, the count returns a value of 0. Range: 0 to (240-1) cells |
53 |
Cells transmitted by Qbin13 |
— |
— |
Provides a count of the cells that are transmitted by Qbin 13. If Qbin 13 is not assigned a traffic service, the count returns a value of 0. Range: 0 to (240-1) cells |
54 |
Cells received by Qbin14 |
— |
— |
Provides a count of the cells that are received on Qbin 14. If Qbin 14 is not assigned a traffic service, the count returns a value of 0. Range: 0 to (240-1) cells |
55 |
Cells discarded by Qbin14 |
— |
— |
Provides a count of the cells that are discarded on Qbin 14. If Qbin 14 is not assigned a traffic service, the count returns a value of 0. Range: 0 to (240-1) cells |
56 |
Cells transmitted by Qbin14 |
— |
— |
Provides a count of the cells that are transmitted by Qbin 14. If Qbin 14 is not assigned a traffic service, the count returns a value of 0. Range: 0 to (240-1) cells |
57 |
Cells received by Qbin15 |
— |
— |
Provides a count of the cells that are received on Qbin 15. If Qbin 15 is not assigned a traffic service, the count returns a value of 0. Range: 0 to (240-1) cells |
58 |
Cells discarded by Qbin15 |
— |
— |
Provides a count of the cells that are discarded on Qbin 15. If Qbin 15 is not assigned a traffic service, the count returns a value of 0. Range: 0 to (240-1) cells |
59 |
Cells transmitted by Qbin15 |
— |
— |
Provides a count of the cells that are transmitted by Qbin 15. If Qbin 15 is not assigned a traffic service, the count returns a value of 0. Range: 0 to (240-1) |
61 |
CLP0 cells transmitted (Ingress) |
— |
Ingress |
Provides a count of the cells with CLP equal to 0 that are transmitted from the port. Range: 0 to (240-1) cells |
62 |
CLP1 cells transmitted (Ingress) |
— |
Ingress |
Provides a count of the total cells with CLP equal to 1 that are transmitted from the port. Range: 0 to (240-1) cells |
63 |
OAM cells transmitted (Ingress) |
No |
Ingress |
Provides a count of the OAM cells that are transmitted from the port. Range: 0 to (240-1) cells |
64 |
RM cells transmitted (Ingress) |
No |
Ingress |
Provides a count of the RM cells that are transmitted from the port. Range: 0 to (240-1) cells |
65 |
CLP0 cells not discarded due to congestion |
No |
Ingress |
Provides a count of the cells with CLP equal to 0 that are received at the port. Range: 0 to (240-1) cells |
66 |
CLP1 cells not discarded due to congestion |
No |
Ingress |
Provides a count of the cells with CLP equal to 1 that are received at the port. Range: 0 to (240-1) cells |
67 |
CLP0 cells discarded due to congestion |
No |
Ingress-1 |
Provides a count of the cells with CLP equal to 0 that are received at the port then discarded due to congestion. Range: 0 to (240-1) cells |
68 |
CLP1 cells discarded due to congestion |
No |
Ingress-1 |
Provides a count of the cells with CLP equal to 1 that are received at the port then discarded due to congestion. Range: 0 to (240-1) cells |
69 |
OAM cells received (Ingress) |
No |
Ingress-1 |
Provides a count of the OAM cells that are received at the port. Range: 0 to (240-1) cells |
70 |
RM cells received (Ingress) |
No |
Ingress-1 |
Provides a count of the RM cells that are received at the port. Range: 0 to (240-1) cells |
71 |
EFCI cells transmitted (Ingress) |
No |
Egress-13 |
Provides a count of the cells with the explicit forward congestion indication (EFCI) bit set that are transmitted to the port. Range: 0 to (240-1) cells |
72 |
EFCI cells received (Ingress) |
No |
Ingress-1 |
Provides a count of the cells with the EFCI bit set that are received at the port. Range: 0 to (240-1) cells |
D.3.3 VXSM Port Statistics
This section provides information about the statistics contained in the VXSM ATM Port group. The VXSM port statistics are applicable to the VXSM cards on the Cisco MGX 8880 PXM45-based nodes and the Cisco MGX 8850 PXM45-based nodes.
Table D-19 lists the attributes that are common to all of the VXSM port statistics.
Table D-19 Attributes Common to all VXSM Port Statistics
|
Object
|
Attribute
|
Front Card |
VXSM |
Back Card |
VXSM-BC-4-155 |
Object Type |
3 |
Subobject Type |
15 |
Default Peak Interval |
300 seconds |
The VXSM port statistics are used primarily for gathering troubleshooting and performance data.
Table D-20 includes the description of each statistic and the point during the data flow at which the statistic gathers the appropriate information. Each measurement point refers to the corresponding point in Figure 1.
Table D-20 VXSM Port Statistics—Descriptions
|
Stat ID
|
VXSM Port Statistics
|
Subset of Other Statistics
|
Ingress/Egress Measurement Point
|
Description
|
0 |
Ingress CLP0 cells transmitted |
— |
Ingress |
Provides a count of the ingress cells with CLP equal to 0 that are transmitted. Range: 0 to (264-1) |
1 |
Ingress CLP1 cells transmitted |
— |
Ingress |
Provides a count of the ingress cells with CLP equal to 1 that are transmitted. Range: 0 to (264-1) |
2 |
Egress CLP0 cells not discarded to congestion |
— |
Egress |
Provides a count of the egress cells with CLP equal to 0 that are not discarded due to congestion. Range: 0 to (264-1) |
3 |
Egress CLP1 cells not discarded to congestion |
— |
Egress |
Provides a count of the egress cells with CLP equal to 1 that are not discarded due to congestion. Range: 0 to (264-1) |
4 |
Egress CLP0 cells discarded due to congestion |
— |
Egress |
Provides a count of the egress cells with CLP equal to 0 that are discarded due to congestion. Range: 0 to (264-1) |
5 |
Egress CLP1 cells discarded due to congestion |
— |
Egress |
Provides a count of the egress cells with CLP equal to 1 that are discarded due to congestion. Range: 0 to (264-1) |
D.4 Card Statistics
The following card statistics are supported:
•AXSM Card Statistics
D.4.1 AXSM Card Statistics
This section provides information about the statistics contained in the AXSM_ATM_card group. The AXSM card statistics are applicable to the Cisco MGX 8850 PXM45-based switch.
Table D-21 lists the attributes that are common to the AXSM card statistics.
Table D-21 Attributes Common to all AXSM Card Statistics
|
Object
|
Attribute
|
Front Cards |
MGX-AXSM-16-T3E3, MGX-AXSM-16-155, MGX-AXSM-4-622, MGX-AXSM-1-2488 |
Back Cards |
MGX-SMB-8-T3, MGX-SMB-8-E3, MGX-SMB-4-155, MGX-SMFIR-8-155, MGX-SMFLR-8-155, MGX-MMF-8-155, MGX-SMFLR-2-622, MGX-SMFIR-2-622, MGX-SMFSR-1-2488, MGX-SMFLR-1-2488, MGX-SMFXLR-1-2488 |
Object Type |
4 |
Subobject Type |
0 |
Default Peak Interval |
300 seconds |
The AXSM card statistics are used primarily for gathering performance data.
Table D-22 includes the description of each statistic and the point during the data flow at which the statistic gathers the appropriate information. Each measurement point refers to the corresponding point in Figure 1.
Table D-22 AXSM Card Statistics—Descriptions
|
Stat ID
|
AXSM Card Statistics
|
Subset of Other Statistics
|
Ingress/Egress Measurement Point
|
Description
|
0 |
Cells to backplane - QLSI |
No |
Ingress-4, 10 |
Provides a count of the cells that are sent to the bus. Range: 0 to (240-1) cells |
1 |
Cells from queue (from QE48) |
No |
Ingress-4, 10 |
Provides a count of the cells traveling from the queueing engine to the bus. Range: 0 to (240-1) cells |
2 |
Cells from backplane - QLSI |
No |
Egress-5, 11 |
Provides a count of the cells that are received from the bus. Range: 0 to (240-1) cells |
3 |
CLP0 Cells dropped due to congestion |
No |
Ingress-3, 9 Egress-6, 12 |
Provides a count of the cells with cell loss priority (CLP) equal to 0 that are discarded due to congestion or buffer management by the queueing engine. Range: 0 to (240-1) cells |
4 |
CLP1 Cells dropped due to congestion |
No |
Ingress-3, 9 Egress-6, 12 |
Provides a count of the cells with CLP equal to 1 that are dropped due to congestion or buffer management by the queueing engine. Range: 0 to (240-1) cells |
5 |
Undefined Cells from port |
No |
Ingress-3, 9 Egress-6, 12 |
Provides a count of the undefined cells from the queuing engine. An undefined cell can be routed, but it might not be discarded. The queueing engine can not distinguish between payload or operation, administration, and maintenance (OAM) cells. Range: 0 to (240-1) cells |
6 |
Errored OAM Cells from port |
No |
Ingress-3, 9 Egress-6, 12 |
Provides a count of OAM cells that have cyclic redundancy check (CRC) errors. Range: 0 to (240-1) cells |
7 |
Invalid OAM Cells from port |
No |
Ingress-3, 9 Egress-6, 12 |
Provides a count of OAM cells with a bad cell or function type that the queueing engine is unable to decode. Range: 0 to (240-1) cells |
8 |
Unsupported OAM Cells from port |
No |
Ingress-3, 9 Egress-6, 12 |
Provides a count of unsupported OAM cells. These cells are discarded at the queuing engine. Range: 0 to (240-1) cells |
9 |
Errored RM Cells from port |
No |
Ingress-3, 9 Egress-6, 12 |
Provides a count of resource management (RM) cells that have CRC errors. Range: 0 to (240-1) cells |
D.5 Path Statistics
The following path statistics are supported:
•VXSM STS Path Statistics
•VXSM DS3 Path Statistics
•VXSM DS1 N DS3 Path Statistics
•VXSM DS1 VT Path Statistics
D.5.1 VXSM STS Path Statistics
This section provides information about the statistics contained in the VXSM_STS Path group. The VXSM STS path statistics are applicable to the VXSM cards on the
Cisco MGX 8880 PXM45-based nodes and the Cisco MGX 8850 PXM45-based nodes.
Table D-23 lists the attributes that are common to all of the VXSM path statistics.
Table D-23 Attributes Common to all VXSM Path Statistics
|
Object
|
Attribute
|
Front Card |
VXSM |
Back Card |
VXSM-BC-4-155 |
Object Type |
6 |
Subobject Type |
2 |
Default Peak Interval |
300 seconds |
Table D-24 includes the description of each statistic.
Table D-24 VXSM STS Path Statistics—Descriptions
|
Stat ID
|
VXSM Path Statistics
|
Subset of Other Statistics
|
Ingress/Egress Measurement Point
|
Description
|
0 |
Sonet Path AIS |
— |
— |
Provides a count of the alarm indication signal (AIS) instances on the path. Range: 0 to (264-1) |
1 |
Sonet Path RDI |
— |
— |
Provides a count of the remote defect indications (RDIs)/yellow alarms that occur on the path. Range: 0 to (264-1) |
2 |
Loss of Pointer |
— |
— |
Provides a count of the loss of pointer (LOP) defect states. Range: 0 to (264-1) |
3 |
Trace path |
— |
— |
Provides a count of the trace paths. Range: 0 to (264-1) |
4 |
Code Violations for Path |
— |
— |
Provides a count of the code violations (CVs) for the path. Range: 0 to (264-1) |
5 |
Errored seconds for path |
— |
— |
Provides a count of the errored seconds (ES) for the path. Range: 0 to (264-1) |
6 |
Severely errored seconds for path |
— |
— |
Provides a count of the severely errored seconds (SES) for the path. Range: 0 to (264-1) |
7 |
Unavailable seconds for path |
— |
— |
Provides a count of the unavailable seconds for the path. Range: 0 to (264-1) |
D.5.2 VXSM DS3 Path Statistics
This section provides information about the statistics contained in the VXSM_DS3 Path group. The VXSM DS3 path statistics are applicable to the VXSM cards on the
Cisco MGX 8880 PXM45-based nodes and the Cisco MGX 8850 PXM45-based nodes.
Table D-25 lists the attributes that are common to all of the VXSM DS3 path statistics.
Table D-25 Attributes Common to all VXSM DS3 Path Statistics
|
Object
|
Attribute
|
Front Card |
VXSM |
Back Card |
VXSM-BC-4-155 |
Object Type |
6 |
Subobject Type |
3 |
Default Peak Interval |
300 seconds |
Table D-26 includes the description of each statistic.
Table D-26 VXSM DS3 Path Statistics—Descriptions
|
Stat ID
|
VXSM DS3 Path Statistics
|
Subset of Other Statistics
|
Ingress/Egress Measurement Point
|
Description
|
0 |
LOF count |
— |
— |
Provides a count of the loss of frames (LOFs) on the DS3 path. Range: 0 to (264-1) |
1 |
Remote AIS Count |
— |
— |
Provides a count of the remote alarm indication signal (AIS) instances on the DS3 path. Range: 0 to (264-1) |
2 |
Remote Defect Count |
— |
— |
Provides a count of the remote defect indications (RDIs)/yellow alarms that occur on the DS3 path. Range: 0 to (264-1) |
3 |
P-bit Code Violations for Path |
— |
— |
Provides a count of the P-bit code violations (CVs) for the DS3 path. Range: 0 to (264-1) |
4 |
C-bit Code Violations for Path |
— |
— |
Provides a count of the C-bit code violations (CVs) for the DS3 path. Range: 0 to (264-1) |
144 |
FEBE Counts |
— |
— |
Provides a count of the FEBEs ( far-end block errors) that are encountered by the DS3 path. Range: 0 to (232-1) |
6 |
P-bit Errored Seconds for Path |
— |
— |
Provides a count of the errored seconds (ES) for the DS3 path. Range: 0 to (264-1) |
7 |
C-bit Errored Seconds for Path |
— |
— |
Provides a count of the errored seconds (ES) for the DS3 path. Range: 0 to (264-1) |
8 |
P-bit Severely Errored Seconds for Path |
— |
— |
Provides a count of the severely errored seconds (SES) for the DS3 path. Range: 0 to (264-1) |
9 |
C-bit Severely Errored Seconds for Path |
— |
— |
Provides a count of the severely errored seconds (SES) for the DS3 path. Range: 0 to (264-1) |
10 |
Severely Errored Framing Seconds for DS3 Path |
— |
— |
Provides a count of the severely errored framing seconds (SEFS) for the DS3 path. Range: 0 to (264-1) |
11 |
Unavailable Seconds for DS3 Path |
— |
— |
Provides a count of the unavailable seconds for the DS3 path. Range: 0 to (264-1) |
D.5.3 VXSM DS1 N DS3 Path Statistics
This section provides information about the statistics contained in the VXSM_DS1 N DS3 Path group. The VXSM DS1 N DS3 path statistics are applicable to the VXSM cards on the
Cisco MGX 8880 PXM45-based nodes and the Cisco MGX 8850 PXM45-based nodes.
Table D-27 lists the attributes that are common to all of the VXSM DS1 N DS3 path statistics.
Table D-27 Attributes Common to all VXSM DS1 N DS3 Path Statistics
|
Object
|
Attribute
|
Front Card |
VXSM |
Back Card |
VXSM-BC-4-155 |
Object Type |
6 |
Subobject Type |
4 |
Default Peak Interval |
300 seconds |
Table D-28 includes the description of each statistic.
Table D-28 VXSM DS1 N DS3 Path Statistics—Descriptions
|
Stat ID
|
VXSM DS1 N DS3 Path Statistics
|
Subset of Other Statistics
|
Ingress/Egress Measurement Point
|
Description
|
0 |
Errored Seconds for Path |
— |
— |
Provides a count of the errored seconds (ES) for the DS1 path. Range: 0 to (264-1) |
1 |
Severely errored seconds for path |
— |
— |
Provides a count of the severely errored seconds (SES) for the DS1 path. Range: 0 to (264-1) |
2 |
Severely errored framing seconds for path |
— |
— |
Provides a count of the SEFS for the DS1 path. Range: 0 to (264-1) |
3 |
Unavailable seconds for path |
— |
— |
Provides a count of the unavailable seconds for the DS1 path. Range: 0 to (264-1) |
4 |
Code Violations for Path |
— |
— |
Provides a count of the code violations (CVs) for the DS1 path. Range: 0 to (264-1) |
5 |
Errored Seconds for line |
— |
— |
Provides a count of the errored seconds (ES) for the DS1 path. Range: 0 to (264-1) |
6 |
Severely errored seconds for line |
— |
— |
Provides a count of the severely errored seconds (SES) for the DS1 path. Range: 0 to (264-1) |
7 |
Severely errored framing seconds for line |
— |
— |
Provides a count of the SEFS for the DS1 path. Range: 0 to (264-1) |
8 |
Losses of Signal |
— |
— |
Provides a count of the times a loss of signal (LOS) is detected. The count includes the number of LOS alarms. Range: 0 to (264-1) |
9 |
LOF count |
— |
— |
Provides a count of the loss of frames (LOFs) on the DS1 path. Range: 0 to (264-1) |
10 |
Remote AIS Count |
— |
— |
Provides a count of the remote alarm indication signal (AIS) instances on the DS1 path. Range: 0 to (264-1) |
11 |
Errored seconds for DS1 path at far end |
— |
— |
Provides a count of the ES for the DS1 path at the far end. Range: 0 to (264-1) |
12 |
Severely errored seconds for DS1 path at far end |
— |
— |
Provides a count of the SES for the DS1 path at the far end. Range: 0 to (264-1) |
13 |
Severely errored framing seconds for DS1 path at far end |
— |
— |
Provides a count of the SEFS for the DS1 path at the far end. Range: 0 to (264-1) |
14 |
Unavailable seconds for DS1 path at far end |
— |
— |
Provides a count of the unavailable seconds for the DS1 path at the far end. Range: 0 to (264-1) |
15 |
Severely errored seconds for DS1 line at far end |
— |
— |
Provides a count of the SES for the DS1 line at the far end. Range: 0 to (264-1) |
16 |
Code violations for DS1 path at far end |
— |
— |
Provides a count of the code violations for the DS1 path at the far end. Range: 0 to (264-1) |
17 |
Code Violations for line |
— |
— |
Provides a count of the code violations (CVs) for the DS1 line. Range: 0 to (264-1) |
18 |
LOF count |
— |
— |
Provides a count of the loss of frames (LOFs) on the DS1 path. Range: 0 to (264-1) |
19 |
Remote AIS Count |
— |
— |
Provides a count of the remote alarm indication signal (AIS) instances on the DS1 path. Range: 0 to (264-1) |
20 |
Remote Defect Count |
— |
— |
Provides a count of the remote defect indications (RDIs)/yellow alarms that occur on the DS1 path. Range: 0 to (264-1) |
21 |
Bursty Errored Seconds for Path |
— |
— |
Provides a count of the bursty errored seconds (BES) for the DS1 path. Range: 0 to (264-1) |
22 |
Degraded Minutes |
— |
— |
Provides a count of the degraded minutes (60-second periods where the cumulative errors exceed 1E-6 but does not exceed 1E-3) for the DS1 path. Range: 0 to (264-1) |
21 |
Controlled Slip Seconds for Path |
— |
— |
Provides a count of the controlled slip seconds (CSS) for the DS1 path. A Controlled Slip is the replication or deletion of the payload bits of a DS1 frame. A Controlled Slip may be performed when there is a difference between the timing of a synchronous receiving terminal and the received signal. A Controlled Slip does not cause an Out of Frame defect. Range: 0 to (264-1) |
D.5.4 VXSM DS1 VT Path Statistics
This section provides information about the statistics contained in the VXSM_DS1 VT Path group. The VXSM DS1 VT path statistics are applicable to the VXSM cards on the
Cisco MGX 8880 PXM45-based nodes and the Cisco MGX 8850 PXM45-based nodes.
Table D-29 lists the attributes that are common to all of the VXSM DS1 VT path statistics.
Table D-29 Attributes Common to all VXSM DS1 VT Path Statistics
|
Object
|
Attribute
|
Front Card |
VXSM |
Back Card |
VXSM-BC-4-155 |
Object Type |
6 |
Subobject Type |
5 |
Default Peak Interval |
300 seconds |
Table D-30 includes the description of each statistic.
Table D-30 VXSM DS1 VT Path Statistics—Descriptions
|
Stat ID
|
VXSM DS1 VT Path Statistics
|
Subset of Other Statistics
|
Ingress/Egress Measurement Point
|
Description
|
0 |
Errored Seconds for Path |
— |
— |
Provides a count of the errored seconds (ES) for the DS1 path. Range: 0 to (264-1) |
1 |
Severely errored seconds for path |
— |
— |
Provides a count of the severely errored seconds (SES) for the DS1 path. Range: 0 to (264-1) |
2 |
Severely errored framing seconds for path |
— |
— |
Provides a count of the SEFS for the DS1 path. Range: 0 to (264-1) |
3 |
Unavailable seconds for path |
— |
— |
Provides a count of the unavailable seconds for the DS1 path. Range: 0 to (264-1) |
4 |
Code Violations for Path |
— |
— |
Provides a count of the code violations (CVs) for the DS1 path. Range: 0 to (264-1) |
5 |
Errored Seconds for line |
— |
— |
Provides a count of the errored seconds (ES) for the DS1 path. Range: 0 to (264-1) |
6 |
Severely errored seconds for line |
— |
— |
Provides a count of the severely errored seconds (SES) for the DS1 path. Range: 0 to (264-1) |
7 |
Severely errored framing seconds for line |
— |
— |
Provides a count of the SEFS for the DS1 path. Range: 0 to (264-1) |
8 |
Losses of Signal |
— |
— |
Provides a count of the times a loss of signal (LOS) is detected. The count includes the number of LOS alarms. Range: 0 to (264-1) |
9 |
LOF count |
— |
— |
Provides a count of the loss of frames (LOFs) on the DS1 path. Range: 0 to (264-1) |
10 |
Remote AIS Count |
— |
— |
Provides a count of the remote alarm indication signal (AIS) instances on the DS1 path. Range: 0 to (264-1) |
11 |
Errored seconds for DS1 path at far end |
— |
— |
Provides a count of the ES for the DS1 path at the far end. Range: 0 to (264-1) |
12 |
Severely errored seconds for DS1 path at far end |
— |
— |
Provides a count of the SES for the DS1 path at the far end. Range: 0 to (264-1) |
13 |
Severely errored framing seconds for DS1 path at far end |
— |
— |
Provides a count of the SEFS for the DS1 path at the far end. Range: 0 to (264-1) |
14 |
Unavailable seconds for DS1 path at far end |
— |
— |
Provides a count of the unavailable seconds for the DS1 path at the far end. Range: 0 to (264-1) |
15 |
Severely errored seconds for DS1 line at far end |
— |
— |
Provides a count of the SES for the DS1 line at the far end. Range: 0 to (264-1) |
16 |
Code violations for DS1 path at far end |
— |
— |
Provides a count of the code violations for the DS1 path at the far end. Range: 0 to (264-1) |
17 |
Code Violations for line |
— |
— |
Provides a count of the code violations (CVs) for the DS1 line. Range: 0 to (264-1) |
18 |
LOF count |
— |
— |
Provides a count of the loss of frames (LOFs) on the DS1 path. Range: 0 to (264-1) |
19 |
Remote AIS Count |
— |
— |
Provides a count of the remote alarm indication signal (AIS) instances on the DS1 path. Range: 0 to (264-1) |
20 |
Remote Defect Count |
— |
— |
Provides a count of the remote defect indications (RDIs)/yellow alarms that occur on the DS1 path. Range: 0 to (264-1) |
21 |
Bursty Errored Seconds for Path |
— |
— |
Provides a count of the bursty errored seconds (BES) for the DS1 path. Range: 0 to (264-1) |
22 |
Degraded Minutes |
— |
— |
Provides a count of the degraded minutes (60-second periods where the cumulative errors exceed 1E-6 but does not exceed 1E-3) for the DS1 path. Range: 0 to (264-1) |
21 |
Controlled Slip Seconds for Path |
— |
— |
Provides a count of the controlled slip seconds (CSS) for the DS1 path. A Controlled Slip is the replication or deletion of the payload bits of a DS1 frame. A Controlled Slip may be performed when there is a difference between the timing of a synchronous receiving terminal and the received signal. A Controlled Slip does not cause an Out of Frame defect. Range: 0 to (264-1) |
D.6 PNNI Network Statistics
The following PNNI network statistics are supported:
•PNNI Nodal Statistics
•PNNI Port Statistics
D.6.1 PNNI Nodal Statistics
This section provides information about contained in the PNNI_Nodal_Level group. The PNNI node statistics are applicable to the Cisco MGX 8950, Cisco MGX 8850 PXM45-based,
Cisco MGX 8850 PXM1E-based, and Cisco MGX 8830 switches.
Table D-31 lists the attributes that are common to the PNNI node statistics.
Table D-31 Attributes Common to all PNNI Node Statistics
|
Object
|
Attribute
|
Front Cards |
PXM45, PXM1E-16T1E1 |
Back Cards |
16 Port T1E1 RJ48, 16 Port E1 MCC |
Object Type |
7 |
Subobject Type |
0 |
Collection Interval |
15 minutes |
Default Peak Interval |
Not supported |
The PNNI node statistics are used for gathering information about SPVCs and SPVPs.
Note To collect PNNI SPVC and SPVP statistics in Cisco MGM, first enable the statistics on the switch by executing the CLI command cnfpnstat.
Table D-32 includes the description of each statistic and the point during the data flow at which the statistic gathers the appropriate information. Each measurement point refers to the corresponding point in Figure 1.
Table D-32 PNNI Node Statistics—Descriptions
|
Stat ID
|
PNNI Node Statistics
|
Subset of Other Statistics
|
Ingress/Egress Measurement Point
|
Description
|
0 |
Con success at orig node |
— |
— |
Provides a count of the successful connections at the originating node. |
1 |
Con failed at orig node |
— |
— |
Provides a count of the failed connections at the originating node. |
D.6.2 PNNI Port Statistics
This section provides information about statistics contained in the PNNI_Port_Level group. The PNNI port statistics are applicable to the Cisco MGX 8950, Cisco MGX 8850 PXM45-based,
Cisco MGX 8850 PXM1E-based, and Cisco MGX 8830 switches.
Table D-33 lists the attributes that are common to the PNNI port statistics.
Table D-33 Attributes Common to all PNNI Port Statistics
|
Object
|
Attribute
|
Front Cards |
PXM45, PXM1E-16T1E1 |
Back Cards |
16 Port T1E1 RJ48, 16 Port E1 MCC |
Object Type |
7 |
Subobject Type |
1 |
Collection Interval |
15 minutes |
Default Peak Interval |
Not supported |
The PNNI port statistics are used for gathering information about SPVCs and SPVPs.
Note To collect PNNI SPVC and SPVP statistics in Cisco MGM, first enable the statistics on the switch by executing the CLI command cnfpnstat.
Table D-34 includes the description of each statistic and the point during the data flow at which the statistic gathers the appropriate information. Each measurement point refers to the corresponding point in Figure 1.
Table D-34 PNNI Port Statistics—Descriptions
|
Stat ID
|
PNNI Port Statistics
|
Subset of Other Statistics
|
Ingress/Egress Measurement Point
|
Description
|
0 |
Con success at orig node |
— |
— |
Provides a count of the successful connections at the originating node. |
1 |
Con failed at orig node |
— |
— |
Provides a count of the failed connections at the originating node. |
2 |
Received crankback at orig node |
— |
— |
Provides a count of the crankbacks at the originating node. |
3 |
Initiate Crankback |
— |
— |
Provides a count of the crankbacks that are initiated. |
4 |
Con success at border node |
— |
— |
Provides a count of the successful connections at the border node. |
5 |
Con failed at border node |
— |
— |
Provides a count of the failed connections at the boarder node. |
6 |
Received crankback at border node |
— |
— |
Provides a count of the crankbacks at the boarder node. |
D.7 Protocol Statistics
The following protocol statistics are supported:
•VXSM Megaco Statistics
•VXSM Megaco Physical Termination Protocol Statistics
•VXSM Megaco Ephemeral Termination Protocol Statistics
•VXSM LAPD Protocol Statistics
D.7.1 VXSM Megaco Statistics
This section provides information about the statistics contained in the VXSM_PROTO_MEGACO_GATEWAY group. The VXSM megaco statistics are applicable to the VXSM cards on the Cisco MGX 8880 PXM45-based nodes and the Cisco MGX 8850 PXM45-based nodes.
Note H.248, also known as the Megaco protocol, is the international standard for media gateway control.
Table D-35 lists the attributes that are common to all of the VXSM card statistics.
Table D-35 Attributes Common to all VXSM Card Statistics
|
Object
|
Attribute
|
Front Card |
VXSM |
Back Card |
VXSM-BC-4-155 |
Object Type |
8 |
Subobject Type |
0 |
Default Peak Interval |
300 seconds |
Table D-36 includes the VXSM megaco statistics.
Table D-36 VXSM Megaco Path Statistics—Descriptions
|
Stat ID
|
VXSM Megaco Statistics
|
Subset of Other Statistics
|
Ingress/Egress Measurement Point
|
Description
|
0 |
Total messages received |
— |
— |
Provides a count of the total ingress cells. Range: 0 to (264-1) |
1 |
Total messages transmitted |
— |
— |
Provides a count of the ingress cells with cell loss priority (CLP) equal to 0 that are received prior to policing. Range: 0 to (264-1) |
2 |
signaling-level errors |
— |
— |
Provides a count of the ingress cells with cell loss priority (CLP) equal to 1 that are received prior to policing. Range: 0 to (264-1) |
3 |
timer recovery events |
— |
— |
Provides a count of the CLP0 cells with the explicit forward congestion indication (EFCI) equal to 1. These cells are received from the port. Range: 0 to (264-1) |
4 |
Total failed ADD commands |
— |
— |
Provides a count of the total number of ADD commands that have failed. Range: 0 to (264-1) |
5 |
Total successful ADD commands |
— |
— |
Provides a count of the total number of ADD commands that were successful. Range: 0 to (264-1) |
6 |
Total failed SUBTRACT commands |
— |
— |
Provides a count of the total number of SUBTRACT commands that have failed. Range: 0 to (264-1) |
7 |
Total successful SUBTRACT commands |
— |
— |
Provides a count of the total number of SUBTRACT commands that were successful. Range: 0 to (264-1) |
8 |
Total failed MOVE commands |
— |
— |
Provides a count of the total number of MOVE commands that have failed. Range: 0 to (264-1) |
9 |
Total successful MOVE commands |
— |
— |
Provides a count of the total number of MOVE commands that were successful. Range: 0 to (264-1) |
11 |
Total failed MODIFY commands |
— |
— |
Provides a count of the total number of MODIFY commands that have failed. Range: 0 to (264-1) |
12 |
Total successful MODIFY commands |
— |
— |
Provides a count of the total number of MODIFY commands that were successful. Range: 0 to (264-1) |
12 |
Total failed AUDIT VALUE commands |
— |
— |
Provides a count of the total number of AUDIT VALUE commands that have failed. Range: 0 to (264-1) |
13 |
Total successful AUDIT VALUE commands |
— |
— |
Provides a count of the total number of AUDIT VALUE commands that were successful. Range: 0 to (264-1) |
14 |
Total failed AUDIT CAPABILITY commands |
— |
— |
Provides a count of the total number of AUDIT CAPABILITY commands that have failed. Range: 0 to (264-1) |
15 |
Total successful AUDIT CAPABILITY commands |
— |
— |
Provides a count of the total number of AUDIT CAPABILITY commands that were successful. Range: 0 to (264-1) |
16 |
Total failed NOTIFY commands |
— |
— |
Provides a count of the total number of NOTIFY commands that have failed. Range: 0 to (264-1) |
17 |
Total successful NOTIFY commands |
— |
— |
Provides a count of the total number of NOTIFY commands that were successful. Range: 0 to (264-1) |
18 |
Total failed Service Change commands from the MGC |
— |
— |
Provides a count of the total number of Service Change commands from the MGC that have failed. Range: 0 to (264-1) |
19 |
Total successful Service Change commands from the MGC |
— |
— |
Provides a count of the total number of Service Change commands from the MGC that were successful. Range: 0 to (264-1) |
20 |
Total failed Service Change commands from the MGC to the MG |
— |
— |
Provides a count of the total number of Service Change commands from the MGC to the MG that failed in the MGC. Range: 0 to (264-1) |
21 |
Total successful Service Change commands from the MGC to the MG |
— |
— |
Provides a count of the total number of Service Change commands from the MGC to the MG that were successful in the MGC. Range: 0 to (264-1) |
22 |
Total allocated contexts |
— |
— |
Provides a count of the total number of contexts allocated Range: 0 to (264-1) |
23 |
Total freed contexts |
— |
— |
Provides a count of the total number of contexts that have been freed Range: 0 to (264-1) |
D.7.2 VXSM Megaco Physical Termination Protocol Statistics
This section provides information about the statistics contained in the VXSM_PROTO_MEGACO_PHY_TERM group. The VXSM Megaco Physical Termination protocol statistics are applicable to the VXSM cards on the
Cisco MGX 8880 PXM45-based nodes and the Cisco MGX 8850 PXM45-based nodes.
Table D-37 lists the attributes that are common to all of the VXSM protocol statistics.
Table D-37 Attributes Common to all VXSM Protocol Statistics
|
Object
|
Attribute
|
Front Card |
VXSM |
Back Card |
VXSM-BC-4-155 |
Object Type |
8 |
Subobject Type |
1 |
Default Peak Interval |
300 seconds |
Table D-38 includes the VXSM Megaco Physical Termination protocol statistics.
Table D-38 VXSM Megaco Physical Termination Protocol Statistics—Descriptions
|
Stat ID
|
VXSM Megaco Physical Termination Protocol Statistics
|
Subset of Other Statistics
|
Ingress/Egress Measurement Point
|
Description
|
0 |
Total physical termination ADD commands |
— |
— |
Provides a count of the total number of ADD commands that have been initiated. Range: 0 to (264-1) |
1 |
Total failed physical termination ADD commands |
— |
— |
Provides a count of the total number of ADD commands that have failed. Range: 0 to (264-1) |
2 |
Out of service from MGC |
— |
Ingress-1 |
Provides a count of the total number of.out of service messages received from the Media Gateway Controller (MGC). Range: 0 to (264-1) |
3 |
Out of service from OAM |
— |
Ingress |
Provides a count of the total number of.out of service messages triggered by the OAM process. Range: 0 to (264-1) |
D.7.3 VXSM Megaco Ephemeral Termination Protocol Statistics
This section provides information about the statistics contained in the VXSM_PROTO_MEGACO_EPHE_TERM group. The VXSM Megaco ephemeral termination protocol statistics are applicable to the VXSM cards on the Cisco MGX 8880 PXM45-based nodes and the Cisco MGX 8850 PXM45-based nodes.
Table D-39 lists the attributes that are common to all of the VXSM card statistics.
Table D-39 Attributes Common to all VXSM Card Statistics
|
Object
|
Attribute
|
Front Card |
VXSM |
Back Card |
VXSM-BC-4-155 |
Object Type |
8 |
Subobject Type |
2 |
Default Peak Interval |
300 seconds |
Table D-40 includes the VXSM Megaco ephemeral termination protocol statistics.
Table D-40 VXSM Megaco Ephemeral Termination Protocol Statistics—Descriptions
|
Stat ID
|
VXSM Megaco Ephemeral Termination Protocol Statistics
|
Subset of Other Statistics
|
Ingress/Egress Measurement Point
|
Description
|
0 |
Total ephemeral termination ADD commands |
— |
— |
Provides a count of the total number of ADD commands that have been initiated. Range: 0 to (264-1) |
1 |
Total failed ephemeral termination ADD commands |
— |
— |
Provides a count of the total number of ADD commands that have failed. Range: 0 to (264-1) |
D.7.4 VXSM LAPD Protocol Statistics
This section provides information about the statistics contained in the VXSM_PROTO_SCTP_GW group. The VXSM LAPD Protocol statistics are applicable to the VXSM cards on the
Cisco MGX 8880 PXM45-based nodes and the Cisco MGX 8850 PXM45-based nodes.
Table D-41 lists the attributes that are common to all of the VXSM card statistics.
Table D-41 Attributes Common to all VXSM Card Statistics
|
Object
|
Attribute
|
Front Card |
VXSM |
Back Card |
VXSM-BC-4-155 |
Object Type |
8 |
Subobject Type |
5 |
Default Peak Interval |
300 seconds |
Table D-42 includes the VXSM LAPD Protocol statistics.
Table D-42 VXSM LAPD Protocol Statistics—Descriptions
|
Stat ID
|
VXSM LAPD Protocol Statistics
|
Subset of Other Statistics
|
Ingress/Egress Measurement Point
|
Description
|
0 |
Total information frames received |
— |
— |
Provides a count of the total number of information frames received. Range: 0 to (264-1) |
1 |
Total information frames transmitted |
— |
— |
Provides a count of the total number of information frames transmitted. Range: 0 to (264-1) |
2 |
Total receiver ready frames received |
— |
— |
Provides a count of the total number of receiver ready frames received. Range: 0 to (264-1) |
3 |
Total receiver ready frames transmitted |
— |
— |
Provides a count of the total number of receiver ready frames transmitted. Range: 0 to (264-1) |
4 |
Total receiver not ready frames received |
— |
— |
Provides a count of the total number of receiver not ready frames received. Range: 0 to (264-1) |
5 |
Total receiver not ready frames transmitted |
— |
— |
Provides a count of the total number of receiver not ready frames transmitted. Range: 0 to (264-1) |
6 |
Total Set Asynchronous Balanced mode frames received |
— |
— |
Provides a count of the total number of Set Asynchronous Balanced mode frames received. Range: 0 to (264-1) |
7 |
Total Set Asynchronous Balanced mode frames transmitted |
— |
— |
Provides a count of the total number of Set Asynchronous Balanced mode frames transmitted. Range: 0 to (264-1) |
8 |
Total disconnect frames received |
— |
— |
Provides a count of the total number of disconnect frames received. Range: 0 to (264-1) |
9 |
Total disconnect frames transmitted |
— |
— |
Provides a count of the total number of disconnect frames transmitted. Range: 0 to (264-1) |
10 |
Total unnumbered acknowledge frames received |
— |
— |
Provides a count of the total number of unnumbered acknowledge frames received. Range: 0 to (264-1) |
11 |
Total unnumbered acknowledge frames transmitted |
— |
— |
Provides a count of the total number of unnumbered acknowledge frames transmitted. Range: 0 to (264-1) |
12 |
Total disconnect mode frames received |
— |
— |
Provides a count of the total number of disconnect mode frames received. Range: 0 to (264-1) |
13 |
Total disconnect mode frames transmitted |
— |
— |
Provides a count of the total number of disconnect mode frames transmitted. Range: 0 to (264-1) |
14 |
Total frame reject frames received |
— |
— |
Provides a count of the total number of frame reject frames received. Range: 0 to (264-1) |
15 |
Total frame reject frames transmitted |
— |
— |
Provides a count of the total number of frame reject frames transmitted. Range: 0 to (264-1) |
16 |
Total exchange ID frames received |
— |
— |
Provides a count of the total number of exchange ID frames received. Range: 0 to (264-1) |
17 |
Total exchange ID frames transmitted |
— |
— |
Provides a count of the total number of exchange ID frames transmitted. Range: 0 to (264-1) |
18 |
Total unnumbered information frames received |
— |
— |
Provides a count of the total number of unnumbered information frames received. Range: 0 to (264-1) |
19 |
Total unnumbered information frames transmitted |
— |
— |
Provides a count of the total number of unnumbered information frames transmitted. Range: 0 to (264-1) |
20 |
Total reject frames received |
— |
— |
Provides a count of the total number of reject frames received. Range: 0 to (264-1) |
21 |
Total reject frames transmitted |
— |
— |
Provides a count of the total number of reject frames transmitted. Range: 0 to (264-1) |
22 |
Total invalid frames received |
— |
— |
Provides a count of the total number of invalid frames received Range: 0 to (264-1) |
D.8 Physical Line Statistics
The following physical line statistics are supported:
•AXSM-E T1/E1 Physical Line
•AXSM-E T3/E3 Physical Line
•AXSM-E SONET Physical Line
•VXSM SONET Physical Line
•VXSM T1E1 Physical Line Statistics
D.8.1 AXSM-E T1/E1 Physical Line
This section provides information about the statistics contained in the AXSME_Phyline_T1E1 group. The AXSM-E T1/E1 physical line statistics in this group are applicable to the
Cisco MGX 8850 PXM45-based switch.
Table D-43 lists the attributes that are common to the AXSM-E T1/E1 physical line statistics.
Table D-43 Attributes Common to all AXSM-E T1/E1 Physical Line Statistics
|
Object
|
Attribute
|
Front Card |
AXSM-16-T1E1-E |
Back Cards |
RJ48-8-T1-Y, SMB-8-E1 |
Object Type |
11 |
Subobject Type |
3 |
Allowable Peak Intervals |
60 seconds, 300 seconds |
Default Peak Interval |
300 seconds |
The AXSM-E T1/E1 physical line statistics are used primarily for gathering troubleshooting and performance data.
Table D-44 includes the description of each statistic and the point during the data flow at which the statistic gathers the appropriate information. Each measurement point refers to the corresponding point in Figure 1.
Note AXSM-E statistics are only collected at measurement points 1, 2, and 13.
Table D-44 AXSM-E T1/E1 Physical Line Statistics—Descriptions
|
Stat ID
|
AXSM-E T1/E1 Physical Line Statistics
|
Subset of Other Statistics
|
Ingress/Egress Measurement Point
|
Description
|
0 |
Errored Seconds |
— |
— |
Provides a count of the line code violation errored seconds. Range: 0 to (232-1) |
1 |
Severely Errored Seconds |
— |
— |
Provides a count of the line code violation severely errored seconds (SES) that are encountered by the interface. Severely errored seconds are classified as errored seconds that are greater than the total line bits per second multiplied by 10-6. Range: 0 to (232-1) |
2 |
Severely Errored Framing Seconds |
No |
Ingress-1 |
Provides a count of the severely errored framing seconds that occur within the collection interval on the T1/E1 line. Range: 0 to (240-1) cells |
3 |
Unavailable Seconds |
No |
Ingress-1 |
Provides a count of the unavailable seconds on the T1/E1 line. Unavailable seconds are defined as 10 contiguous severely errored seconds. Range: 0 to (240-1) cells |
4 |
Path coding violations |
— |
— |
Provides a count of the path code violations that are encountered by the interface. These violations occur when more than three zeroes in a row are transmitted. Range: 0 to (232-1) |
5 |
Line Errored Seconds |
— |
— |
Provides a count of the line code violation errored seconds. Range: 0 to (232-1) |
6 |
Line Severely Errored Seconds |
— |
— |
Provides a count of the line code violation SES that are encountered by the interface. Severely errored seconds are classified as errored seconds that are greater than the total line bits per second multiplied by 10-6. Range: 0 to (232-1) |
7 |
Path SEF/AIS (PSAS) Encountered |
— |
— |
Provides a count of the severely errored frames or an alarm indication signals (AIS) detected on the T1/E1 line. Range: 0 to (232-1) |
8 |
Number of occurrences of Loss of Signal |
No |
Ingress-1 |
Provides a count of the times a loss of signal (LOS) is detected on the T1/E1 line. The count includes the number of LOS alarms. Range: 0 to (240-1) cells |
9 |
Number of occurrences of Out of Frame |
No |
Ingress-1 |
Provides a count of the times an out of frame (OOF) is detected. The count includes the number of OOF alarms. Range: 0 to (232-1) |
10 |
Number of occurrences of RAI |
No |
Ingress-1 |
Provides a count of the remote alarm indication (RAI) occurrences on the T1/E1 line. Range: 0 to (232-1) |
11 |
Far-end Errored Seconds |
No |
Ingress-1 |
Provides a count of the seconds errors are detected at the far end of the T1/E1 line. Range: 0 to (240-1) cells |
12 |
Far-end severely Errored Seconds |
— |
— |
Provides a count of the far end SES that occur within the collection interval. Severely errored seconds are classified as errored seconds that are greater than the total line bits per second multiplied by 10-6. Range: 0 to (232-1) |
13 |
Far-end severely Errored Framing Seconds |
No |
Ingress-1 |
Provides a count of the severely errored framing seconds that occur within the collection interval on the T1/E1 line. Range: 0 to (240-1) cells |
14 |
Far-end Unavailable Seconds |
No |
Ingress-1 |
Provides a count of the unavailable seconds at the far end of the T1/E1 line. Unavailable seconds are defined as 10 contiguous severely errored seconds. Range: 0 to (240-1) |
15 |
Far-end line errored seconds |
— |
— |
Provides a count of the line code violation errored seconds at the far end. Range: 0 to (232-1) |
16 |
Far-end path coding violations |
— |
— |
Provides a count of the path code violations that are encountered at the far end. These violations occur when more than three zeroes in a row are transmitted. Range: 0 to (232-1) |
17 |
Line code violations |
No |
Ingress-1 |
Provides a count of the line code violations encountered by the T1/E1 line. Range: 0 to (240-1) cells) |
D.8.2 AXSM-E T3/E3 Physical Line
This section provides information about the statistics contained in the AXSME_Phyline_T3E3 group. The AXSM-E T3/E3 physical line statistics in this group are applicable to the
Cisco MGX 8850 PXM45-based switch.
Table D-45 lists the attributes that are common to the AXSM-E T3/E3 physical line statistics.
Table D-45 Attributes Common to all AXSM-E T3/E3 Physical Line Statistics
|
Object
|
Attribute
|
Front Card |
AXSM-16-T3E3-E |
Back Cards |
SMB-8-T3, SMB-8-E3 |
Object Type |
11 |
Subobject Type |
4 |
Allowable Peak Intervals |
60 seconds, 300 seconds |
Default Peak Interval |
300 seconds |
The AXSM-E T3/E3 physical line statistics are used primarily for gathering troubleshooting and performance data.
Table D-46 includes the description of each statistic and the point during the data flow at which the statistic gathers the appropriate information. Each measurement point refers to the corresponding point in Figure 1.
Note AXSM-E statistics are only collected at measurement points 1, 2, and 13.
Table D-46 AXSM-E T3/E3 Physical Line Statistics—Descriptions
|
Stat ID
|
AXSM-E T3/E3 Physical Line Statistics
|
Subset of Other Statistics
|
Ingress/Egress Measurement Point
|
Description
|
0 |
Loss of Signal Occurrences |
No |
Ingress-1 |
Provides a count of the times a loss of signal (LOS) is detected on the T3 line. The count includes the number of LOS alarms. Range: 0 to (240-1) cells |
1 |
Loss of Frame Occurrences |
No |
Ingress-1 |
Provides a count of the loss of frames (LOFs) that are encountered by the T3 line. Range: 0 to (240-1) cells |
2 |
Alarm Indication Signal Occurrences |
No |
Ingress-1 |
Provides a count of the alarm indication signal (AIS) instances on the T3 line. Range: 0 to (240-1) cells |
3 |
Yellow Alarm Occurrences |
No |
Ingress-1 |
Provides a count of the times yellow alarms are detected on the T3 line. Range: 0 to (240-1) cells |
4 |
Number of line code violations |
No |
Ingress-1 |
Provides a count of the line code violations encountered by the T3 line. Range: 0 to (240-1) cells |
5 |
Number of p-bit parity code violations |
No |
Ingress-1 |
Provides a count of the P-bit parity codes that do not match the locally calculated parity code on the T3 line. Range: 0 to (240-1) cells |
6 |
Number of c-bit parity code violations |
No |
Ingress-1 |
Provides a count of the C-bit parity code violations that do not match the locally calculated parity code on the T3 line. Range: 0 to (240-1) cells |
7 |
Far end blocked errors |
No |
Ingress-1 |
Provides a count of the far end block errors that occur within the collection interval on the T3 line. Range: 0 to (240-1) cells |
8 |
Seconds with at least one LCV + number of LOS |
No |
Ingress-1 |
Provides a count of the seconds with at least one line code violation (LCV) and one LOS on the T3 line. Range: 0 to (240-1) cells |
9 |
Seconds with at least one PCV + number of LOF |
No |
Ingress-1 |
Provides a count of the seconds with at least one parity code violation (PCV) and one LOF on the T3 line. Range: 0 to (240-1) cells |
10 |
Seconds with at least one CCV + number of LOF |
No |
Ingress-1 |
Provides a count of seconds with at least one C-bit code violation and one LOF on the T3 line. Range: 0 to (240-1) cells |
11 |
Seconds with 45/34(T3)LCV + number of LOS |
No |
Ingress-1 |
Provides a count of seconds with 45/34 LCVs and LOSs on the T3 line. Range: 0 to (240-1) cells |
12 |
Seconds with 44(T3)PCV + number of LOF |
No |
Ingress-1 |
Provides a count of the seconds with 44 PCVs and LOFs on the T3 line. Range: 0 to (240-1) cells |
13 |
Seconds with 44(T3)CCV + number of LOF |
No |
Ingress-1 |
Provides a count of the seconds with 44 CCVs and LOFs on the T3 line. Range: 0 to (240-1) cells |
14 |
Seconds with severely errored framing |
No |
Ingress-1 |
Provides a count of the severely errored framing seconds that occur within the collection interval on the T3 line. Range: 0 to (240-1) cells |
15 |
Unavailable seconds |
No |
Ingress-1 |
Provides a count of the unavailable seconds on the T3 line. Unavailable seconds are defined as 10 contiguous severely errored seconds. Range: 0 to (240-1) cells |
16 |
PLCP Loss of Frames |
No |
Ingress-1 |
Provides a count of the loss of frames detected by the physical layer convergence protocol (PLCP) interface on the T3 line. Range: 0 to (240-1) cells |
17 |
PLCP YEL-LOW |
No |
Ingress-1 |
Provides a count of the number of times PLCP yellow defects are detected on the T3 line. Range: 0 to (240-1) cells |
18 |
PLCP bip 8-errors |
No |
Ingress-1 |
Provides a count of the PLCP BIP-8 errors on the T3 line. Range: 0 to (240-1) cells |
19 |
PLCP far end blocked errors |
No |
Ingress-1 |
Provides a count of the far end block errors that are encountered by the PLCP interface on the T3 line. Range: 0 to (240-1) cells |
20 |
Seconds with at least one PLCP bip-8 error |
No |
Ingress-1 |
Provides a count of the seconds with at least one PLCP BIP-8 error detected on the T3 line. Range: 0 to (240-1) cells |
21 |
Seconds with 5 PLCP bip-8 errors n |
No |
Ingress-1 |
Provides a count of the seconds with at least five PLCP BIP-8 errors that are detected on the T3 line. Range: 0 to (240-1) cells |
22 |
Seconds with T3 PLCP far end blocked errors |
No |
Ingress-1 |
Provides a count of the seconds with PLCP far end block errors that are detected on the T3 line. Range: 0 to (240-1) cells |
23 |
Seconds with 5 PLCP FEBE errors + PLCP YEL |
No |
Ingress-1 |
Provides a count of the seconds with at least five PLCP far end block errors (FEBE) and yellow defects detected on the T3 line. Range: 0 to (240-1) cells |
24 |
Seconds with T3 severely errored framing |
No |
Ingress-1 |
Provides a count of the severely errored framing seconds that occur within the collection interval on the T3 line. Range: 0 to (240-1) cells |
25 |
T3 PLCP unavailable seconds |
No |
Ingress-1 |
Provides a count of the unavailable seconds on the T3 line. Unavailable seconds are defined as 10 contiguous severely errored seconds. Range: 0 to (240-1) cells |
26 |
PLCP Framing Errors |
No |
Ingress-1 |
Provides a count of the framing errors that are detected by the PLCP interface on the T3 line. Range: 0 to (240-1) cells |
27 |
PLCP Framing Error Seconds |
No |
Ingress-1 |
Provides a count of seconds that framing errors are detected by PLCP interface on the T3 line. Range: 0 to (240-1) cells |
28 |
PLCP Severely Errored Framing Seconds |
No |
Ingress-1 |
Provides a count of the severely errored seconds based on PLCP framing errors detected on the T3 line. Range: 0 to (240-1) cells |
29 |
Occurrences of loss of cell delineation |
No |
Ingress-1 |
Provides a count of the loss of cell delineation defect states on the T3 line. Range: 0 to (240-1) cells |
30 |
T3 far end errored seconds |
No |
Ingress-1 |
Provides a count of the seconds errors are detected at the far end of the T3 line. Range: 0 to (240-1) cells |
31 |
T3 far end severely errored seconds |
T3 far end errored seconds |
Ingress-1 |
Provides a count of the severely errored seconds (SES) that occur at the far end of the T3 line. Severely errored seconds are classified as errored seconds that are greater than the total line bits per second multiplied by 10-6. Range: 0 to (240-1) cells |
32 |
T3 far end unavailable seconds |
No |
Ingress-1 |
Provides a count of the unavailable seconds at the far end of the T3 line. Unavailable seconds are defined as 10 contiguous severely errored seconds. Range: 0 to (240-1) cells |
50 |
loss of signal occurrences |
No |
Ingress-1 |
Provides a count of the times a loss of signal (LOS) is detected on the E3 line. The count includes the number of LOS alarms. Range: 0 to (240-1) cells |
51 |
loss of frame occurrences |
No |
Ingress-1 |
Provides a count of the loss of frames (LOFs) that are encountered by the E3 line. Range: 0 to (240-1) cells |
52 |
alarm indication signal occurrences |
No |
Ingress-1 |
Provides a count of the alarm indication signal (AIS) instances on the E3 line. Range: 0 to (240-1) cells |
53 |
yellow alarms occurrences |
No |
Ingress-1 |
Provides a count of the times yellow alarms are detected on the E3 line. Range: 0 to (240-1) cells |
54 |
loss of cell delineation occurrences |
No |
Ingress-1 |
Provides a count of the loss of cell delineation defect states on the E3 line. Range: 0 to (240-1) cells |
55 |
trail trace byte mismatch |
No |
Ingress-1 |
Provides a count of the trail trace byte (TTB) mismatch occurrences on the E3 line. Range: 0 to (240-1) cells |
56 |
line code violations |
No |
Ingress-1 |
Provides a count of the line code violations encountered by the E3 line. Range: 0 to (240-1) cells |
57 |
Seconds with at least one LCV + number of LOS |
No |
Ingress-1 |
Provides a count of the seconds with at least one line code violation (LCV) and one loss of signal (LOS) on the E3 line. Range: 0 to (240-1) cells |
58 |
Seconds with 45/34 (E3) LCV+ number of LOS |
No |
Ingress-1 |
Provides a count of seconds with 45/34 LCVs and LOSs on the E3 line. Range: 0 to (240-1) cells |
59 |
Number of p-bit parity code violations |
No |
Ingress-1 |
Provides a count of the P-bit parity codes that do not match the locally calculated parity code on the E3 line. Range: 0 to (240-1) cells |
60 |
Seconds with at least one PCV + number of LOF |
No |
Ingress-1 |
Provides a count of the seconds with at least one parity code violation (PCV) and one loss of frame (LOF) on the E3 line. Range: 0 to (240-1) cells |
61 |
Seconds with at least one CCV + number of LOF |
No |
Ingress-1 |
Provides a count of seconds with at least one C-bit code violation and one LOF on the E3 line. Range: 0 to (240-1) cells |
62 |
Seconds with severely errored framing |
No |
Ingress-1 |
Provides a count of the severely errored framing seconds that occur within the collection interval on the E3 line. Range: 0 to (240-1) cells |
63 |
Unavailable Seconds |
No |
Ingress-1 |
Provides a count of the unavailable seconds on the E3 line. Unavailable seconds are defined as 10 contiguous severely errored seconds. Range: 0 to (240-1) cells |
64 |
Far end blocked errors |
No |
Ingress-1 |
Provides a count of the far end block errors that occur within the collection interval on the E3 line. Range: 0 to (240-1) cells |
65 |
Far end errored seconds |
No |
Ingress-1 |
Provides a count of the seconds errors are detected at the far end of the E3 line. Range: 0 to (240-1) cells |
66 |
Far end severely errored seconds |
Far end errored seconds |
Ingress-1 |
Provides a count of the severely errored seconds (SES) that occur at the far end of the E3 line. Severely errored seconds are classified as errored seconds that are greater than the total line bits per second multiplied by 10-6. Range: 0 to (240-1) cells |
67 |
Far end unavailable seconds |
No |
Ingress-1 |
Provides a count of the unavailable seconds at the far end of the E3 line. Unavailable seconds are defined as 10 contiguous severely errored seconds. Range: 0 to (240-1) |
D.8.3 AXSM-E SONET Physical Line
This section provides information about the statistics contained in the AXSME_Phyline_SONET group. The AXSM-E SONET physical line statistics in this group are applicable to the
Cisco MGX 8850 PXM45-based switch.
Table D-47 lists the attributes that are common to the AXSM-E SONET physical line statistics.
Table D-47 Attributes Common to all AXSM-E SONET Physical Line Statistics
|
Object
|
Attribute
|
Front Cards |
AXSM-8-155-E, AXSM-2-622-E |
Back Cards |
SMB-4-155, SMFLR-4-155, SMFIR-4-155, MMF-4-155, SMFLR-1-622, SMFIR-1-622 |
Object Type |
11 |
Subobject Type |
5 |
Allowable Peak Intervals |
60 seconds, 300 seconds |
Default Peak Interval |
300 seconds |
The AXSM-E SONET physical line statistics are used primarily for gathering troubleshooting and performance data.
Table D-48 includes the description of each statistic and the point during the data flow at which the statistic gathers the appropriate information. Each measurement point refers to the corresponding point in Figure 1.
Note AXSM-E statistics are only collected at measurement points 1, 2, and 13.
Table D-48 AXSM-E SONET Physical Line Statistics—Descriptions
|
Stat ID
|
AXSM-E SONET Physical Line Statistics
|
Subset of Other Statistics
|
Ingress/Egress Measurement Point
|
Description
|
0 |
LOS defect state occurrences |
No |
Ingress-1 |
Provides a count of the times a loss of signal (LOS) is detected on the SONET line. The count includes the number of LOS alarms. Range: 0 to (240-1) cells |
1 |
LOF defect state occurrences |
No |
Ingress-1 |
Provides a count of the loss of frames (LOFs) that are encountered by the SONET line. Range: 0 to (240-1) cells |
2 |
AIS defect state occurrences |
No |
Ingress-1 |
Provides a count of the alarm indication signal (AIS) instances on the SONET line. Range: 0 to (240-1) cells |
3 |
Yellow Alarm defect state occurrences |
No |
Ingress-1 |
Provides a count of the times yellow alarms are detected on the SONET line. Range: 0 to (240-1) cells |
4 |
Loss of Cell delineation defect occurrences |
No |
Ingress-1 |
Provides a count of the loss of cell delineation defect states on the SONET line. Range: 0 to (240-1) cells |
5 |
Number of instances of Loss of Pointer |
No |
Ingress-1 |
Provides a count of the loss of pointer defect states on the SONET line. Range: 0 to (240-1) cells |
6 |
Number of instances of Path AIS |
No |
Ingress-1 |
Provides a count of the AIS instances on the path. Range: 0 to (240-1) cells |
7 |
Number of instances of Path Yellow |
No |
Ingress-1 |
Provides a count of the times yellow alarms are detected on the path. Range: 0 to (240-1) cells |
8 |
Trace section |
No |
Ingress-1 |
Provides a count of the section traces. Range: 0 to (240-1) cells |
9 |
Trace path |
No |
Ingress-1 |
Provides a count of the path traces. Range: 0 to (240-1) cells |
10 |
Aps_mis |
No |
Ingress-1 |
Provides a count of the total automatic protection system (APS) mismatches. Range: 0 to (240-1) cells |
11 |
Aps_psbf |
No |
Ingress-1 |
Provides a count of the protection switching byte failures (PSBFs) that are detected on the SONET line. Range: 0 to (240-1) cells |
12 |
Aps_chan_mis |
No |
Ingress-1 |
Provides a count of the APS channel mismatches that are detected on the SONET line. Range: 0 to (240-1) cells |
13 |
Aps_mode_mis |
No |
Ingress-1 |
Provides a count of the APS mode mismatches that are detected on the SONET line. Range: 0 to (240-1) cells |
14 |
Aps_fe_prot |
No |
Ingress-1 |
Provides a count of the switches to fast Ethernet protocol. Range: 0 to (240-1) cells |
15 |
Code violations for section |
No |
Ingress-1 |
Provides a count of the section code violations. Range: 0 to (240-1) cells |
16 |
Errored seconds for section |
No |
Ingress-1 |
Provides a count of the section errored seconds that occur within the collection interval. Range: 0 to (240-1) cells |
17 |
Severely Errored seconds for section |
No |
Ingress-1 |
Provides a count of the section severely errored seconds that occur within the collection interval. Severely errored seconds are classified as errored seconds that are greater than the total line bits per second multiplied by 10-6. Range: 0 to (240-1) cells |
18 |
Unavailable seconds for section |
No |
Ingress-1 |
Provides a count of the section unavailable seconds. Unavailable seconds are defined as 10 contiguous severely errored seconds. Range: 0 to (240-1) cells |
19 |
Code violations for line |
No |
Ingress-1 |
Provides a count of the code violations encountered by the SONET line. Range: 0 to (240-1) cells |
20 |
Errored seconds for line |
No |
Ingress-1 |
Provides a count of the errored seconds that occur within the collection interval on the SONET line. Range: 0 to (240-1) cells |
21 |
Severely errored seconds for line |
No |
Ingress-1 |
Provides a count of the severely errored seconds that occur within the collection interval on the SONET line. Severely errored seconds are classified as errored seconds that are greater than the total line bits per second multiplied by 10-6. Range: 0 to (240-1) cells |
22 |
Unavailable seconds for line |
No |
Ingress-1 |
Provides a count of the unavailable seconds on the SONET line. Unavailable seconds are defined as 10 contiguous severely errored seconds. Range: 0 to (240-1) cells |
23 |
Code violations for line at far end |
No |
Ingress-1 |
Provides a count of the code violations at the far end of the line. Range: 0 to (240-1) cells |
24 |
Errored seconds for line at far end |
No |
Ingress-1 |
Provides a count of the errored seconds that occur at the far end of the line. Range: 0 to (240-1) cells |
25 |
Severely Errored seconds for line at far end |
No |
Ingress-1 |
Provides a count of the severely errored seconds at the far end of the line. Severely errored seconds are classified as errored seconds that are greater than the total line bits per second multiplied by 10-6. Range: 0 to (240-1) cells |
26 |
Unavailable seconds for line at far end |
No |
Ingress-1 |
Provides a count of the section unavailable seconds for the line. Unavailable seconds are defined as 10 contiguous severely errored seconds. Range: 0 to (240-1) cells |
27 |
Code violations for path |
No |
Ingress-1 |
Provides a count of the path code violations. Range: 0 to (240-1) cells |
28 |
Errored seconds for path |
No |
Ingress-1 |
Provides a count of the path errored seconds. Range: 0 to (240-1) cells |
29 |
Severely errored seconds for path |
No |
Ingress-1 |
Provides a count of the path severely errored seconds. Severely errored seconds are classified as errored seconds that are greater than the total line bits per second multiplied by 10-6. Range: 0 to (240-1) cells |
30 |
Unavailable seconds for path |
No |
Ingress-1 |
Provides a count of the path unavailable seconds for the line. Unavailable seconds are defined as 10 contiguous severely errored seconds. Range: 0 to (240-1) cells |
31 |
Code violations for path at far end |
No |
Ingress-1 |
Provides a count of the path code violations at the far end of the line. Range: 0 to (240-1) cells |
32 |
Errored seconds for path at far end |
No |
Ingress-1 |
Provides a count of the path errored seconds that occur at the far end of the line. Range: 0 to (240-1) cells |
33 |
Severely errored seconds for path at far end |
No |
Ingress-1 |
Provides a count of the path severely errored seconds at the far end of the line. Severely errored seconds are classified as errored seconds that are greater than the total line bits per second multiplied by 10-6. Range: 0 to (240-1) cells |
34 |
Unavailable seconds for path at far end |
No |
Ingress-1 |
Provides a count of the path unavailable seconds for the line. Unavailable seconds are defined as 10 contiguous severely errored seconds. Range: 0 to (240-1) |
D.8.4 VXSM SONET Physical Line
This section provides information about the statistics contained in the VXSM_Phyline_SONET group. The VXSM SONET physical line statistics are applicable to the VXSM cards on the Cisco MGX 8880 PXM45-based nodes and the Cisco MGX 8850 PXM45-based nodes.
Table D-49 lists the attributes that are common to all of the VXSM SONET physical line statistics.
Table D-49 Attributes Common to all VXSM SONET Physical Line Statistics
|
Object
|
Attribute
|
Front Card |
VXSM |
Back Card |
VXSM-BC-4-155 |
Object Type |
11 |
Subobject Type |
13 |
Default Peak Interval |
300 seconds |
Table D-50 includes the VXSM SONET physical line statistics.
Table D-50 VXSM SONET Physical Line Statistics—Descriptions
|
Stat ID
|
VXSM SONET Physical Line Statistics
|
Subset of Other Statistics
|
Ingress/Egress Measurement Point
|
Description
|
0 |
LOS defect state occurrences |
— |
— |
Provides a count of the times a loss of signal (LOS) is detected. Range: 0 to (264-1) |
1 |
LOF defect state occurrences |
— |
— |
Provides a count of the loss of frames (LOFs) that are encountered by a SONET line. Range: 0 to (264-1) |
2 |
AIS defect state occurrences |
— |
— |
Provides a count of the alarm indication signal (AIS) instances on the line. Range: 0 to (264-1) |
3 |
Yellow Alarm defect state occurrences |
— |
— |
Provides a count of the remote defect indications (RDIs)/yellow alarms that occur. Range: 0 to (264-1) |
4 |
Trace Section |
— |
— |
Provides a count of the trace section. Range: 0 to (264-1) |
5 |
Aps_mis |
— |
— |
Provides a count for K1 and K2 changing. Range: 0 to (264-1) |
6 |
Aps_psbf |
— |
— |
Provides a count of the APS protected switch byte failures. Range: 0 to (264-1) |
7 |
Aps_chan_mis |
— |
— |
Provides a count of the APS channel mismatches. Range: 0 to (264-1) |
8 |
Aps_mode_mis |
— |
— |
Provides a count of the APS mode mismatches (different APS mode from the far-end). Range: 0 to (264-1) |
9 |
Aps_fe_prot |
— |
— |
Provides a count of the LOS on the protected far-end. Range: 0 to (264-1) |
10 |
Code violations for section |
— |
— |
Provides a count of the code violations (CVs) for the section. Range: 0 to (264-1) |
11 |
Errored seconds for section |
— |
— |
Provides a count of the errored seconds (ES) for the section. Range: 0 to (264-1) |
12 |
Severely Errored seconds for section |
— |
— |
Provides a count of the severely errored seconds (SES) for the section. Range: 0 to (264-1) |
13 |
Unavailable seconds for section |
— |
— |
Provides a count of the unavailable seconds for the section. Range: 0 to (264-1) |
14 |
Code violations for line |
— |
— |
Provides a count of the code violations (CVs) for the line. Range: 0 to (264-1) |
15 |
Errored seconds for line |
— |
— |
Provides a count of the errored seconds (ES) for the line. Range: 0 to (264-1) |
16 |
Severely errored seconds for line |
— |
— |
Provides a count of the severely errored seconds (SES) for the line. Range: 0 to (264-1) |
17 |
Unavailable seconds for line |
— |
— |
Provides a count of the unavailable seconds for the line. Range: 0 to (264-1) |
D.8.5 VXSM T1E1 Physical Line Statistics
This section provides information about the statistics contained in the VXSM T1E1 physical line statistics. The VXSM T1/E1 statistics are applicable to the VXSM cards on the Cisco MGX 8880 PXM45-based nodes and the Cisco MGX 8850 PXM45-based nodes.
Table D-51 lists the attributes that are common to the VXSM T1/E1 statistics.
Table D-51 Attributes Common to all VXSM T1/E1 Statistics
|
Object
|
Attribute
|
Front Cards |
VXSM-48T1E1 |
Back Cards |
48 Port T1E1 RJ48, 48 Port E1 MCC |
Object Type |
11 |
Subobject Type |
14 |
Default Peak Interval |
300 seconds |
The VXSM T1/E1 statistics are used primarily for gathering performance data.
Table D-52 includes the description of each statistic and the point during the data flow at which the statistic gathers the appropriate information. Each measurement point refers to the corresponding point in Figure 1.
Table D-52 VXSM T1/E1 Physical Line Statistics—Descriptions
|
Stat ID
|
VXSM T1/E1 Physical Line Statistics
|
Subset of Other Statistics
|
Ingress/Egress Measurement Point
|
Description
|
0 |
Errored Seconds |
— |
— |
Provides a count of the line code violation errored seconds. Range: 0 to (232-1) |
1 |
Severely Errored Seconds |
— |
— |
Provides a count of the near end severely errored seconds (SES) that occur within the collection interval. Severely errored seconds are classified as errored seconds that are greater than the total line bits per second multiplied by 10-6. Range: 0 to (232-1) |
2 |
Severely Errored Framing Seconds |
No |
Ingress-1 |
Provides a count of the severely errored framing seconds that occur within the collection interval on the T1/E1 line. Range: 0 to (240-1) cells |
3 |
Unavailable Seconds |
No |
Ingress-1 |
Provides a count of the unavailable seconds on the T1/E1 line. Unavailable seconds are defined as 10 contiguous severely errored seconds. Range: 0 to (240-1) cells |
4 |
Path coding violations |
— |
— |
Provides a count of the path code violations that are encountered by the interface. These violations occur when more than three zeroes in a row are transmitted. Range: 0 to (232-1) |
5 |
No. of occurrences of Out of Frame |
No |
Ingress-1 |
Provides a count of the times an out of frame (OOF) is detected. The count includes the number of OOF alarms. Range: 0 to (232-1) |
6 |
No. of occurrences of RAI |
No |
Ingress-1 |
Provides a count of the remote alarm indication (RAI) occurrences on the T1/E1 line. Range: 0 to (232-1) |
7 |
Far-end Errored Seconds |
No |
Ingress-1 |
Provides a count of the seconds errors are detected at the far end of the T1/E1 line. Range: 0 to (240-1) cells |
8 |
Far-end severely Errored Seconds |
— |
— |
Provides a count of the far end SES that occur within the collection interval. Severely errored seconds are classified as errored seconds that are greater than the total line bits per second multiplied by 10-6. Range: 0 to (232-1) |
9 |
Far-end severely Errored Framing Secs |
No |
Ingress-1 |
Provides a count of the severely errored framing seconds that occur within the collection interval on the T1/E1 line. Range: 0 to (240-1) cells |
10 |
Far-end Unavailable Seconds |
No |
Ingress-1 |
Provides a count of the unavailable seconds at the far end of the T1/E1 line. Unavailable seconds are defined as 10 contiguous severely errored seconds. Range: 0 to (240-1) |
11 |
Far-end line errored Seconds |
— |
— |
Provides a count of the line code violation errored seconds at the far end. Range: 0 to (232-1) |
12 |
Far-end path coding violations |
— |
— |
Provides a count of the path code violations that are encountered at the far end. These violations occur when more than three zeroes in a row are transmitted. Range: 0 to (232-1) |
13 |
LOF count |
— |
— |
Provides a count of the loss of frames (LOFs). Range: 0 to (264-1) |
14 |
Remote AIS Count |
— |
— |
Provides a count of the remote alarm indication signal (AIS) instances on the DS1 path. Range: 0 to (264-1) |
15 |
Bursty Errored Seconds |
— |
— |
Provides a count of the bursty errored seconds (BES). Range: 0 to (264-1) |
16 |
Controlled Slip Seconds |
— |
— |
Provides a count of the controlled slip seconds (CSS). A Controlled Slip is the replication or deletion of the payload bits of a DS1 frame. A Controlled Slip may be performed when there is a difference between the timing of a synchronous receiving terminal and the received signal. A Controlled Slip does not cause an Out of Frame defect. Range: 0 to (264-1) |

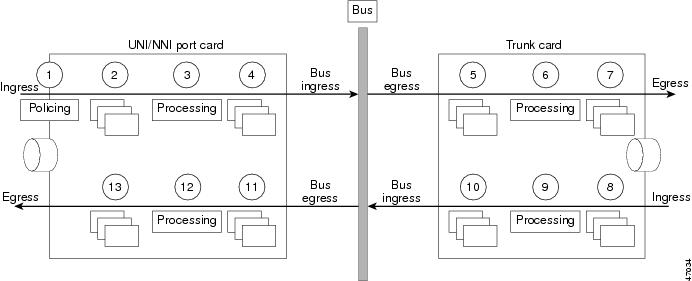
 Feedback