The Circuit/VC 360
view provides at-a-glance information about a specific circuit/VC. From the
Circuit/VC 360 view, you can access detailed information about the circuit/VC
and perform the actions described in
Actions You Can Perform from the Circuit/VC 360 View.
The Circuit/VC 360
view displays the circuit name, state, and general circuit/VC and performance
information at the top of the view. More detailed information is provided in
tabs in the lower part of the view.
|
Information Provided in
Circuit/VC 360 View
|
Description
|
|
General
information
|
Type of
circuit/VC, its various states (discovery, serviceability, provisioning), the
customer associated with the circuit/VC, and some audit information (when it
was created, when it was last changed). For an explanation of circuit/VC
states, see
Circuit or VC States.
| Note
|
If the Provisioning state is Create Failed, click the associated i (information) icon to see the reason for the failure.
|
|
|
Performance data
|
Graphs
reflecting various aspects of the circuit/VC performance.
| Note
|
For data to be shown in the graphs, the required monitoring policy must be activated for the relevant devices. For example,
to view graphs that chart the number of Explicit Pointer Adjustment Relay counters (such L-bits and P-bits) that have been
generated and received, both the CEM and Pseudowire Emulation Edge to Edge monitoring policies must be enabled. See Monitoring Policies Reference.
|
|
|
Alarms
|
Current
alarms for the circuit/VC, including their severity, status, and the time they
were generated.
|
|
Endpoints
|
Devices
and interfaces that serve as endpoints for this circuit/VC.
|
|
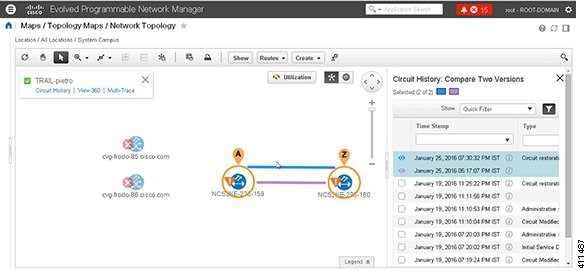
History
|
The History tab lists all versions of the circuit, allowing you to view the changes that have occurred since the circuit/VC was discovered
or first deployed. You can open the Circuit 360 view for any of the versions listed to see its endpoints, alarms, and so forth.
| Note
|
If you are looking at the Circuit 360 view for a historical circuit/VC, the History tab is not displayed.
|
You can also view the configuration details for the circuit/VC's endpoints by doing the following:
-
Locate the appropriate circuit/VC version and click its i (information) icon in the Provisioning State column.
The Device Configuration Details pop-up window opens.
-
Click the radio button for the endpoint whose configuration details you want to view.
If the endpoint was successfully provisioned, its configuration is listed at the bottom of the pop-up window. If provisioning
of the endpoint failed, a description of why provisioning failed is listed instead.
|
|
Related
Circuits/VCs
|
Additional circuits within the selected circuit.
|
For EVCs, the
following information is shown:
For optical
circuits, the performance data is shown based on the following circuit types:
- OCHCC WSON—The total
number of octets received on the interface, including frames, number of inbound
packets with errors that prevented them from being delivered to a higher layer
protocol, and number of severely errored seconds per line and multiplex
sections.
- OCHNC WSON—The average,
minimum, and maximum optical signal to noise ratio (OSNR) for this circuit
type.
- OCH-TRAIL WSON—The total
number of uncorrectable words and the total number of errors corrected, in bits
per second (bps), for this circuit type.
- OCH-Trail UNI—The total
number of uncorrectable words and the total number of errors corrected, in bits
per second (bps), and the minimum, average, and maximum output power received
and transmitted, in decibel referenced to 1 watt (dBW) by this circuit type.
- ODU UNI—The total number of
background block errors, total number of severely errored seconds, and errored
seconds ratio for path monitoring.
- ODU Tunnel—The total number
of background block errors, total number of severely errored seconds, and
errored seconds ratio for section monitoring.
In addition, the
average, minimum, and maximum amount of output power received and transmitted
from the circuit is shown for all optical circuit types.
For Circuit
Emulation services, the following information is shown:
- The total number of jitter buffer overruns for each circuit endpoint.
- The total number of Explicit Pointer Adjustment Relay counters (such as L-bits and R-bits) that were generated and received
for each circuit endpoint.
For services on a Cisco ME 1200 device, information such as incoming and outgoing traffic, jitter, and availability is displayed.
For MPLS
bidirectional TE tunnels, ensure that you activate the Interface Health
monitoring policy so that the performance data is shown. See
Monitoring Policies Reference
for more information. The following performance data is shown:
- Traffic—The sum of traffic
in both directions of the tunnel, in bits per second (bps).
- Availability—Average
availability of the endpoints in the tunnel.
- Bandwidth Utilization—The
percentage of bandwidth configured on the tunnel against the sum of the
percentage of bandwidth configured on all the pseudowires associated with the
tunnel.
- Actual Bandwidth
Utilization—The percentage of bandwidth configured on the tunnel against the
sum of the percentage of bandwidth utilized for the incoming and outgoing
traffic in all the pseudowires associated with the tunnel.
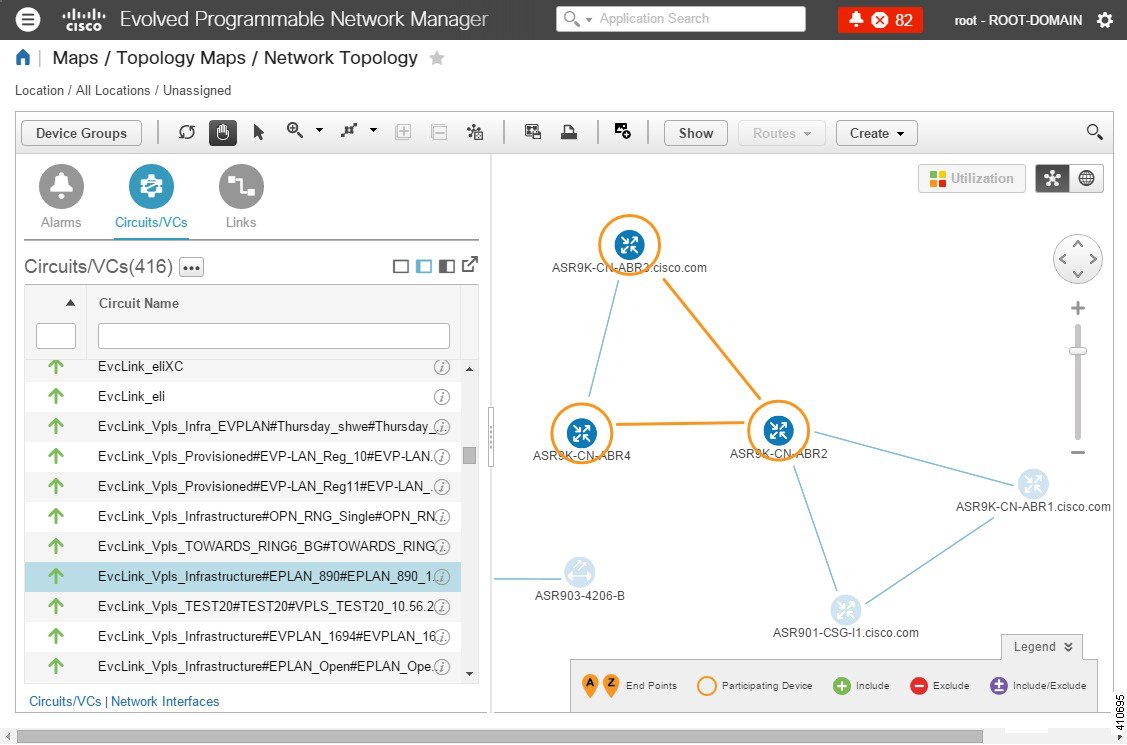
To open the Circuit/VC 360 view for a particular circuit or VC:


 Feedback