Monitoring Service Quality Alerts
Available Languages
Table Of Contents
Monitoring Service Quality Alerts
How to Use the Service Quality Alerts Display
Starting the Service Quality Alerts Display
Understanding the Layout of the Service Quality Alerts Display
Using the Service Quality Alerts Display
Customizing the Service Quality Alerts Display
Selecting Views for Service Quality Alerts
Filtering Service Quality Alerts
Viewing Events Associated with a Service Quality Alert
Starting the Service Quality Alert Details Display
Event Processing for Service Quality Events During High CPU Utilization
Using the Service Quality Alert Details Display
Acknowledging a Service Quality Alert
Clearing a Service Quality Alert
Sending E-Mail in Response to a Service Quality Alert
Monitoring Service Quality Alerts

Note
Use the Service Quality Alerts display to view alerts that Operations Manager generates based on SNMP traps sent by IP Communications Service Monitor (Service Monitor). To use the Service Quality alerts display, you must have a licensed copy of Service Monitor configured to send traps to Operations Manager. You must also add Service Monitor to Operations Manager; see Adding and Deleting Service Monitors, page 19-7.
These topics describe monitoring service quality alerts:
•
•
How to Use the Service Quality Alerts Display
The Service Quality Alerts display provides real-time information about IP phone service quality. Service Quality Alerts displays are designed so that you can set them up and leave them running, providing an ongoing monitoring tool that signals you when something needs attention.
When Operations Manager receives traps from Service Monitor, Operations Manager generates an event or events that are rolled up into an alert. The alert is shown on your Service Quality Alerts display. From a Service Quality Alerts display you can launch other windows to obtain more information, including:
•
•
Note
Starting the Service Quality Alerts Display
To start the Service Quality Alerts display, select Monitoring Dashboards > Service Quality Alerts. Service Quality Alerts appears in a new window.

Tip
Understanding the Layout of the Service Quality Alerts Display
These topics provide details about the information in the Service Quality Alerts display.
View Pane
The view pane lists the currently available views, or user-defined device groups, available for Service Quality Alerts. By default, two views—All Alerts and Suspended Devices—are always shown, and cannot be deleted from your Service Quality Alerts display.
The current view is highlighted in the view pane. Alerts for the devices in the current view are shown in the tabular display pane. To select another view, simply click the view name in the view pane.
Icons next to the views indicate the severity of the alerts received from devices in those views, signaling you that the devices may need attention.
For the current view, All Alerts, severity icons also appear next to the alerts in the tabular display to help you quickly locate a specific alert.
The view pane is updated every two minutes. You can have up to 18 views in the view pane in a single Service Quality Alerts display.
Launch Information and View Status Bar Area
The launch information area shows the time on the server when the Service Quality Alerts display was started. The view status bar lists the selected view and the number of alerts in that view.
Tabular Display Pane
The tabular display pane is the core of the Service Quality Alerts display. It contains a list of all alerts that are occurring on the devices in your current view. This pane is refreshed every 60 seconds. For an explanation for all of the items in the tabular display, see Using the Service Quality Alerts Display.
Icons alert you to what needs attention; for example, the severity icons indicate which views and alerts require attention.The tabular display pane is scrollable and can store up to 1,000 records.
Window Tools Area
The top-right corner of the Service Quality Alerts display contains available tools buttons. All buttons are described in Table 4-1.
Using the Service Quality Alerts Display
The Service Quality Alerts display shows the alerts that are occurring in your current view. Alerts are grouped by their severity: critical, warning, or informational. Within these severity groupings, alerts with the latest change are listed first.
When an alert is generated, it remains in the Service Quality Alerts display until it is cleared. Alerts are cleared based upon the frequency you set; see Configuring Service Quality Event Settings, page 19-9. While the alert is in the display, if any of its events recur, the alert is updated. If an expired alert recurs, a new alert with a new ID is shown. This display is refreshed every 60 seconds.
Tip
Table 4-2 Service Quality Alerts Display—Contents
Number of alerts—Alerts numbered from 1
Severity of alert

Critical

Warning

Informational Unidentified Trap alert
(no icon)
Informational (for all other alerts)
Alert identifier number. Click this link to open a Service Quality Alert Details display.
Call destination: one of the following:
•
•
Extension number if the destination type is IP phone.
IP address if the destination type is endpoint.
Date and time alert last occurred or was changed. Alerts are grouped by severity, and within severities, alerts with the latest change are listed first.
Customizing the Service Quality Alerts Display
After adding your devices to a view, you can customize your Service Quality Alerts display by selecting specific views and using filters:
•
•
Selecting Views for Service Quality Alerts
When you select Monitoring Dashboards > Service Quality Alerts to open the Service Quality Alerts display, all available views are listed in the view pane on the left side of the display. If the views shown do not meet your needs, you can create a new view.
To create a new view, first create a user-defined group; see Creating and Editing Groups. Then, use the Views page (see Managing Views) to select the new user-defined group and apply it to Service Quality Alerts. The user-defined group will then be displayed in the view pane. To remove a view from the view pane, deselect it from Service Quality Alerts on the Views page and apply your change.
The view pane is updated every two minutes. You can have up to 18 views in the view pane in a single Service Quality Alerts display. For information on how to manage your views, see Managing Views.
Filtering Service Quality Alerts
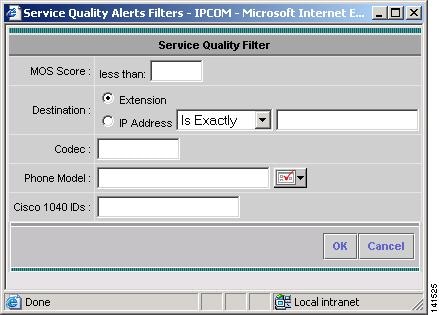
Filters allow you to manipulate the Service Quality Alerts display to show alerts based on their severity, status, and originating device.
Note
Step 1
Step 2
Figure 4-1 Service Quality Filter Dialog Box
Step 3
•
•
–
–
•
•
•
Step 4
Viewing Events Associated with a Service Quality Alert
Use the Service Quality Alert Details display to see the events that are associated with an alert.
Starting the Service Quality Alert Details Display
The Service Quality Alert Details display provides information about all of the events that were rolled up into a specific alert.
Step 1
Step 2
Event Processing for Service Quality Events During High CPU Utilization
During periods of high CPU utilization, Operations Manager limits the number of Service Quality events that it processes. You will know when this is occurring by the message that appears in the view status bar of the Service Quality Alerts display. The message states that not every alert is being displayed. The excess Service Quality Alerts display Events are written to the NMSROOT\logs\itemlogs\SQTraps\Traps.log file, and these events:
•
•
Note
Operations Manager checks CPU utilization on its server every 60 seconds. When CPU utilization reaches and remains at 50% or greater for two minutes, Operations Manager limits the number of Service Quality events processed until utilization drops below 50%. Table 4-3 lists the number of events that Operations Manager processes.
Table 4-3 Service Quality Event Processing Rates During High CPU Utilization
Operations Manager CPU Utilization
Number of Service Quality Events Processed Per Minute
50%
40
60%
20
Using the Service Quality Alert Details Display
The Service Quality Alert Details display shows all of the events associated with a specific alert. The events are displayed in a table and events with the latest change are listed first. Events remain in the Service Quality Alert Details display until the parent alert expires. The Service Quality Alert Details table is refreshed every 60 seconds.
The alert name, destination, destination type, and description of the alert are displayed above the Service Quality Alert Details table. Table 4-4 describes the columns in the Service Quality Alert Details table. Table 4-5 describes the command buttons on the Service Quality Alert Details display.
Table 4-4 Service Quality Alert Details Display—Contents
Number of events—Events numbered from 1
Severity of alert
Critical
Warning
Informational Unidentified Trap alert
(no icon)
Informational (for all other events)
.05 through 5.0
One of the following:
•
•
Date and time at which the event occurred.
One of the following:
•
•
•
•
One of the following:
•
•
IP address or DNS name or phone extension.
Event identifier number. Click this link to open the event properties page (see Viewing Event Properties).
Links to tools that provide more information on the event.
Note
Table 4-5 Service Quality Alert Detail s Display—Command Buttons
Refresh
Refreshes the data in the display.
Acknowledge
Changes the event status to Acknowledged. See Acknowledging a Service Quality Alert.
Clear
Clears the service quality alert. See Clearing a Service Quality Alert.
Notify
Sends e-mail notification of the alert. See Sending E-Mail in Response to a Service Quality Alert.
Close
Closes the Service Quality Alert Details display.
Viewing Event Properties
The event properties page provides additional detail about the event, such as the values of MIB attributes at the time of the event.
Step 1
Step 2
Step 3
Acknowledging a Service Quality Alert
Acknowledging an active alert signals other users that you are aware of the alert. When you click the Acknowledge button in the Service Quality Alert Details display, this status change is populated to all Service Quality Alerts displays.
If an event on the alert recurs, the status reverts to Active.
Step 1
Step 2
Clearing a Service Quality Alert
You can clear a service quality alert by clicking the Clear button on the Service Quality Alert Details display.
Step 1
Step 2
Sending E-Mail in Response to a Service Quality Alert
When you click the Notify button on the Service Quality Alert Details display, Operations Manager opens a dialog box that you can complete to manually send an e-mail notification to one or more recipients. The e-mail notification will contain only the text you add; it will not append any alert or event information. (If you want to send automatic e-mail notifications when alerts or events occur on certain devices, use Notifications to set up an e-mail notification subscription. See Understanding Notifications.)
Step 1
Step 2
a.
b.
c.
d.
e.
f.


 Feedback