Using History Reports
Available Languages
Table Of Contents
Getting Started with History Reports
Reports with More than 2,000 Records
Getting Started with Alert and Event History
24-Hour Context-Based Alert and Event History Reports
Customized Alert History and Event History Reports
Generating Customized Alert and Event History Reports
Getting All Stored Information on an Alert
Getting All Stored Information on an Event
Understanding the Alert History Report
Viewing User Annotations from an Alert History Report
Launching Event History from an Alert History Report
Understanding the Event History Report
Viewing Event Properties from an Event History Report
Getting Started with Service Quality Event History Reports
Exporting 24-Hour and 7-Day Service Quality Event History Reports
Getting All Stored Information on a Service Quality Event
Understanding the Service Quality Event History Report
Viewing Service Quality Event Properties
Using History Reports
These topics explain how to use IP Communications Operations Manager (Operations Manager) Alert and Event History and Service Quality Event History reports:
•
Getting Started with History Reports
•
•
•
•
•
•
Getting Started with History Reports
Alert and Event History reports and Service Quality History reports enable you to view alerts and events that occurred during the past 31 days. The available information includes alert status and date, related device and device components, annotations (informational text you entered), and event details. Operations Manager purges the Alert History database daily to retain only 31 days of history; see Viewing Purge Scheduler Status, page 19-13.

Note
For more information, see the following topics:
•
•
History Report Tool Buttons
Table 11-1 explains the tool buttons that appear in the upper-right corner of history reports.
Reports with More than 2,000 Records
The Alert History and Event History reports display up to 2,000 records that you can scroll or page through. If your report exceeds 2,000 records and you want to view all of them, use the Export tool button to save all of the information to a CSV or PDF file.
Getting Started with Alert and Event History
You can generate 24-hour context-based reports from various Operations Manager pages, such as the Topology display. You can also generate customized history reports for which you supply the search criteria and set the date range. You can generate Event History reports for devices and device components.
24-Hour Context-Based Alert and Event History Reports
On various Operations Manager pages, such as the Alerts and Events display, you can select Alert History or Event History links or menu items. When you click an Alert History or Event History link, you generate a context-based report that displays relevant history records:
•
•
You can also generate customized Alert History and Event History reports for a time period that you select and include records based on search criteria that you specify. Alert History and Event History reports include the same type of information whether you generate context-based or customized reports.
You can generate 24-hour context-based history reports from various Operations Manager pages. For example, from:
•
•
Note
Customized Alert History and Event History Reports
You might want to generate an Alert History report or an Event History report when:
•
•
•
You can generate an Event History report to gather information on:
•
•
•
Generating Customized Alert and Event History Reports
To gather historical information on alerts and events in the past 31 days, start Alert and Event History from the Operations Manager home page by selecting Reports > Alert and Event History. The following topics explain how you can apply filters and generate reports based on all information stored in the Alert History database:
•
•
•
Note
Getting All Stored Information on an Alert
You can search the Alert History database for alerts using one of the following methods:
•
•
•
Note
Searching for Alerts by Alert ID
To determine how often a specific alert has occurred, search for the alert by its alert ID. The alert ID is displayed in the Alerts and Events display.
Step 1
Step 2
a.
b.
c.
•
•
•
Step 3
The Alert History report opens. For an explanation of the report contents, see Understanding the Alert History Report.
Searching for Alerts by Device
Use this procedure to determine what types of alerts are occurring on a specific device.
Step 1
Step 2
a.
b.
c.
•
•
•
Step 3
The Alert History report opens. For an explanation of the report contents, see Understanding the Alert History Report.
Searching for Alerts by Device Group
To determine what type of alerts are occurring in a specific device group, use this procedure.
Step 1
Step 2
a.
b.
c.
•
•
•
Step 3
The Alert History report opens. For an explanation of the report contents, see Understanding the Alert History Report.
For more information, see the following topics:
Searching for Alerts by Date
To determine what type of alerts are occurring during a specific day, week, month, or range of dates, use this procedure.
Step 1
Step 2
•
•
•
•
Step 3
For more information, see the following topics:
Getting All Stored Information on an Event
Note
You can search the Alert History database for events using one of the following methods:
•
•
•
•
Note
Searching for Events by Event ID
To determine how often a specific event has occurred, search for the event by its event ID. The event ID is displayed on the Alert Details display.
Step 1
Step 2
a.
b.
•
•
•
Step 3
The Event History report opens. For an explanation of the report contents, see Understanding the Event History Report.
Searching for Events by Device
Use this procedure to determine what types of events are occurring on a specific device.
Step 1
Step 2
a.
b.
c.
•
•
•
Step 3
The Event History report opens. For an explanation of the report contents, see Understanding the Event History Report.
Selecting Event Descriptions for an Event History Report
By default all events are selected on the Event Descriptions dialog box.
Step 1
Step 2
•
•
Searching for Events by Alert
To view the events that correspond to a specific alert, use this procedure.
Step 1
Step 2
a.
b.
c.
•
•
•
Step 3
The Event History report opens. For an explanation of the report contents, see Understanding the Event History Report.
Searching for Events by Device Group
To determine what types of events are occurring in a specific device group, use this procedure.
Step 1
Step 2
a.
b.
c.
d.
•
•
•
Step 3
The Event History report opens. For an explanation of the report contents, see Understanding the Event History Report.
For more information, see the following topics:
Searching for Events by Date
To determine what type of alerts are occurring during a specific day, week, month, or range of dates, use this procedure.
Step 1
Step 2
•
•
•
•
Step 3
The Event History report opens. For an explanation of the report contents, see Understanding the Event History Report.
For more information, see the following topics:
Understanding the Alert History Report
The Alert History report (shown in Figure 11-1) is a scrollable table that lists up to 2,000 records, based on your search criteria. To view database contents beyond the 2,000 records, click the Export tool button in the upper-right corner of the window.
Figure 11-1 Alert History Report

The Alert History report window provides tools, as shown in Table 11-1.
Table 11-2 describes the contents of the Alert History report.
Table 11-2 Alert History Report—Contents
Alert ID
Alert identifier number. Clicking this link opens the Event History report (see Figure 11-4), which contains details about the events associated with the alert.
Device Name
Device name or IP address.
Device
Device type. Inventory Collection in Progress indicates that Operations Manager was discovering the device at the time of the alert. The actual device type is reflected when new events occur. For more information, see "Using Device Management."
Description
Alert category, one of the following: Application, Connectivity, Environment, Interface, Other, Reachability, System Hardware, Utilization. For alerts containing multiple events, the report shows the category of the event with the most recent change.
For alerts containing multiple events, the report shows the category of the event with the most recent change.
Severity
Critical, Warning, or Informational.
Time
Date and time when the alert was generated.
Status
Alert status, based on last polling.
Active
Cleared
Acknowledged
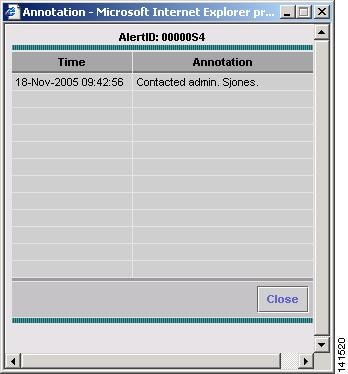
Viewing User Annotations from an Alert History Report
From an Alert History report, click a link in the Status column to open the alert annotation page.
Figure 11-2 shows an alert annotation page, which lists any notes that users have entered using the Alert Details page. (For more information, see Responding to Alerts.)
Figure 11-2 Alert Annotation Page
Launching Event History from an Alert History Report
To launch an Event History report from an Alert History report, click the alert ID link that interests you. The Event History report opens in a new window and lists the events that caused the alert to be generated.
Understanding the Event History Report
Note
The Event History report lists events. For each event, the Event History report includes:
•
•
•
•
•
Figure 11-3 provides an example of an Event History report.
Figure 11-3 Event History Report

The Event History report window provides tool buttons in the upper-right corner of the window; these are described in Table 11-1.
Table 11-3 describes the contents of the Event History report in more detail.
Table 11-3 Event History Report—Contents
Event ID
Event identifier number. Clicking this link opens the event properties page (see Figure 11-4), which describes the value of MIB attributes currently and at the time of the event.
Device Name
Device name or IP address.
Component
Device element on which the event occurred.
Description
Operations Manager event name (as described in "Events Processed"). You can also customize the names of events displayed by Event History (and the Alerts and Events display) using the Event Customization feature in Notifications. For more information, see Customizing Events.
Time
Date and time when the event was generated.
Status
Event status, based on last polling.
Active
Event is live.
Cleared
Event is no longer live. Also, when a device is suspended, all alerts are cleared. When Operations Manager polling determines that an alarm has been in the Cleared state for 30 minutes or more (from the time of polling), the alarm expires and is removed from the Alerts and Events display.
Suspended
Device is suspended.
Resumed
Device is being resumed.
Deleted
Device has been deleted.
Alert ID
Alert identifier number associated with this event.
Viewing Event Properties from an Event History Report
From an Event History report, click an event in the Event ID column to open the Event Properties page. The page lists more information about an event, such as the value of MIB attributes, polling and threshold information, and utilization information. Values at the time of the event are listed alongside current values.
Figure 11-4 shows an example of the event properties page.
Figure 11-4 Event Properties Page

Getting Started with Service Quality Event History Reports
This section contains the following topics:
•
•
Exporting 24-Hour and 7-Day Service Quality Event History Reports
Use this procedure to automatically generate 24-hour Service Quality History reports daily at midnight and 7-day Service Quality History reports weekly at midnight on Monday. You can generate these reports in comma separated value (CSV) and PDF format, save them on disk, and e-mail them.
Step 1
Step 2
•
–
–
Note
•
–
–
Note
Step 3
•
•
Step 4
Getting All Stored Information on a Service Quality Event
Note
You can search the Alert History database for Service Quality events using one of the following methods:
•
•
•
•
•
•
Searching for Service Quality Events by MOS
To view the Service Quality events for MOS less than a value that you supply, use this procedure.
Step 1
Step 2
a.
b.
•
•
•
Step 3
The Service Quality Event History report opens. For an explanation of the report contents, see Understanding the Service Quality Event History Report.
Searching for Service Quality Events by Destination
To view the Service Quality events that correspond to call endpoints, use this procedure.
Step 1
Step 2
a.
•
•
•
b.
c.
•
•
•
Step 3
The Service Quality Event History report opens. For an explanation of the report contents, see Understanding the Service Quality Event History Report.
Searching for Service Quality Events by Codec
To view the Service Quality events for a particular codec, use this procedure.
Step 1
Step 2
a.
b.
•
•
•
Step 3
The Service Quality Event History report opens. For an explanation of the report contents, see Understanding the Service Quality Event History Report.
Searching for Service Quality Events by Phone Model
To view the Service Quality events that correspond to specific phone models, use this procedure.
Step 1
Step 2
a.
b.
•
•
•
Step 3
The Service Quality Event History report opens. For an explanation of the report contents, see Understanding the Service Quality Event History Report.
Searching for Service Quality Events by Cisco 1040
To view the Service Quality events that correspond to specific Cisco 1040, use this procedure.
Step 1
Step 2
a.
Note
b.
•
•
•
Step 3
The Service Quality Event History report opens. For an explanation of the report contents, see Understanding the Service Quality Event History Report.
Searching for Service Quality Events by Date
To view the Service Quality events for specific dates, use this procedure.
Step 1
Step 2
•
•
•
•
Step 3
The Service Quality Event History report opens. For an explanation of the report contents, see Understanding the Service Quality Event History Report.
For more information, see the following topics:
Understanding the Service Quality Event History Report
Note
The Service Quality Event History report is a scrollable table that lists up to 2,000 records, based on your search criteria. To view database contents beyond the 2,000 records, click the Export tool button in the upper-right corner of the window.
The Service Quality Event History report window provides tools, as shown in Table 11-1.
Table 11-4 describes the contents of the Service Quality Event History report.
Table 11-4 Service Quality Event History Report—Contents
Severity
Event severity:
•
•
Event ID
Click this link to open the event properties window. See Viewing Service Quality Event Properties.
Destination Type
One of the following:
•
•
Destination
IP address or phone extension.
IP Address
Destination IP address.
MOS
Mean Opinion Score that triggered the event.
Cause
One of the following:
•
•
Time
Date and time that the event occurred.
Codec
One of the following:
•
•
•
•
•
Source Type
One of the following:
•
•
Source
IP address or phone extension.
IP Address
Source IP address.
Viewing Service Quality Event Properties
Step 1
Table 11-5 describes the contents of the service quality Event Properties window.
Table 11-5 Service Quality Event Properties Window—Contents
Destination
Extension number or N/A
Destination IP Address
IP address
Destination Type
One of the following:
•
•
Destination Model
Phone model or N/A
Switch for Destination
IP address or N/A
Destination Port
Port type and slot; for example Gi1/0/23
Source
Extension number or IP address
Source IP Address
IP address or N/A
Source Type
One of the following:
•
•
Source Model
Phone model or N/A
Switch for Source
IP address or N/A
Source Port
Port type and slot or N/A
Detection Algorithm
Algorithm
MOS
MOS value during event
Critical MOS Threshold
MOS threshold configured on Operations Manager (see Configuring Service Quality Event Settings, page 19-9)
Cause
One of the following:
•
•
•
Codec
Codec in use on the destination; one of the following:
•
•
•
•
•
Jitter
Msec
Packet loss
Number of packets.
Cisco 1040 ID
ID consists of a letter and 3 digits; for example, A101.


 Feedback