- Preface
- Overview
- Preinstallation
- Installing Cisco Video Assurance Management Solution 3.0
- Uninstalling Cisco Video Assurance Management Solution 3.0
- Configuring the Components of the Cisco Video Assurance Management Solution 3.0
- Troubleshooting with Cisco Video Assurance Management Solution 3.0
- Trap Definitions
- End User License Agreement Supplement
- Glossary
- Index
User Guide for Cisco Video Assurance Management Solution, 3.0
Bias-Free Language
The documentation set for this product strives to use bias-free language. For the purposes of this documentation set, bias-free is defined as language that does not imply discrimination based on age, disability, gender, racial identity, ethnic identity, sexual orientation, socioeconomic status, and intersectionality. Exceptions may be present in the documentation due to language that is hardcoded in the user interfaces of the product software, language used based on RFP documentation, or language that is used by a referenced third-party product. Learn more about how Cisco is using Inclusive Language.
- Updated:
- June 11, 2010
Chapter: Troubleshooting with Cisco Video Assurance Management Solution 3.0
- Using the VAMS Dashboards
- Monitoring VAMS Events with the VAMS Service Dashboard
- Monitoring with the VAMS Event Views
- Monitoring ROSA NMS Events
- Monitoring CMM Events
- Monitoring VidMon Events
- Monitoring Video Events
- Viewing Network Fault Events
- Troubleshooting with Cisco ANA
Troubleshooting with Cisco Video Assurance Management Solution 3.0
This chapter contains the following sections:
•![]() Monitoring VAMS Events with the VAMS Service Dashboard
Monitoring VAMS Events with the VAMS Service Dashboard
•![]() Monitoring with the VAMS Event Views
Monitoring with the VAMS Event Views
•![]() Troubleshooting with Cisco ANA
Troubleshooting with Cisco ANA
Using the VAMS Dashboards
The VAMS components provide operational dashboards that give you a top-down view of video network events. Cisco VAMS 3.0 provides:
•![]() The TIP/TBSM Dashboard
The TIP/TBSM Dashboard
•![]() The Video Assurance Management Dashboard
The Video Assurance Management Dashboard
•![]() Cisco Multicast Manager
Cisco Multicast Manager
•![]() The ROSA NMS
The ROSA NMS
•![]() Cisco ANA
Cisco ANA
TIP/TBSM Dashboard
The high-level interface for Cisco Video Assurance Management Solution 3.0 is the Tivoli Integrated Portal (TIP) and the Tivoli Business Service Manager (TBSM). TIP allows you to launch TBSM and customized event views for events in the video headend and video transport network.
From the TIP dashboard, you can view all of the tasks provided with TIP/TBSM, or select specific tasks provided for the VAMS application. You can select:
•![]() Tivoli Netcool/OMNIbus Web GUI—A web-based application that processes network events from one or more data sources and presents event data to TIP/TBSM users in various graphical formats.
Tivoli Netcool/OMNIbus Web GUI—A web-based application that processes network events from one or more data sources and presents event data to TIP/TBSM users in various graphical formats.
•![]() Tivoli Business Service Manager—Provides real-time service dashboards for the Cisco Info Center applications.
Tivoli Business Service Manager—Provides real-time service dashboards for the Cisco Info Center applications.
•![]() Video Assurance Management Dashboard—A customized dashboard for the Cisco VAMS product.
Video Assurance Management Dashboard—A customized dashboard for the Cisco VAMS product.
These tasks are selectable from the drop-down list in the View menu at the top of the TIP dashboard.
Video Assurance Management Dashboard
The TIP/TBSM dashboard provides a menu for the Video Assurance Dashboard. The Video Assurance Dashboard provides a view of all of the video services in your network that includes:
•![]() A Service Availability directory that lists video services and associated devices.
A Service Availability directory that lists video services and associated devices.
•![]() A Service Dashboard that includes:
A Service Dashboard that includes:
–![]() A Service Tree that shows a directory map of the devices in your video network.
A Service Tree that shows a directory map of the devices in your video network.
–![]() A Service Viewer that shows a topology map of the devices providing the service.
A Service Viewer that shows a topology map of the devices providing the service.
–![]() A Service Details window that provides an event list showing the events for the selected service.
A Service Details window that provides an event list showing the events for the selected service.
•![]() Custom event views that show Video Fault event views and Network Fault event:
Custom event views that show Video Fault event views and Network Fault event:
–![]() The Video Fault event views include ROSA events, CMM events, Video Events, and VidMon events.
The Video Fault event views include ROSA events, CMM events, Video Events, and VidMon events.
–![]() The Network Fault event views include ANA events and a view that shows all events.
The Network Fault event views include ANA events and a view that shows all events.
The TIP/TBSM event lists show Cisco Info Center events that combine alerts received from all of the components of VAMS 3.0 and present them in a consolidated event based on processing rules specified in Cisco Info Center rules files.
You can launch the CMM home page from any CMM event with a right-click. You can also launch a CMM flow trace with a right-click from any event that includes a Multicast Group Address and a Source IP address. Currently, Digital Content Manager (DCM) events do not contain a Source IP address, so only CMM cross-launch is available for DCM events.
Figure 6-4 on page 6-7 shows the VAMS Service Dashboard. Figure 6-7 shows the custom events menu.
For information on how to use the VAMS Service Dashboard and the custom event views to manage video events, see:
•![]() Monitoring ROSA NMS Events, page 6-12
Monitoring ROSA NMS Events, page 6-12
•![]() Monitoring CMM Events, page 6-22
Monitoring CMM Events, page 6-22
•![]() Monitoring VidMon Events, page 6-35
Monitoring VidMon Events, page 6-35
•![]() Monitoring Video Events, page 6-37
Monitoring Video Events, page 6-37
•![]() Viewing Network Fault Events, page 6-35
Viewing Network Fault Events, page 6-35
For information on using ANA to troubleshoot video events, see Troubleshooting with Cisco ANA, page 6-43
Cisco Multicast Manager
Cisco Multicast Manager provides a monitoring interface that allows you to monitor and manage video devices, including VidMon devices and monitoring for video probes. For information on the Cisco Multicast Manager interface, see the User Guide for Cisco Multicast Manager 3.1, viewable online at:
http://www.cisco.com/en/US/products/ps6337/products_user_guide_list.html
ROSA NMS
The ROSA NMS provides a user interface for monitoring and configuring the Digital Content Manager (DCM) and associated video headend devices. For information on using the ROSA NMS, see the ROSA Network Management System User's Guide, Version 3.0 Build 18. This document is provided in PDF format on CD 1 of the ROSA NMS installation media.
Cisco ANA
Cisco Active Network Abstraction provides several applications for viewing network topology and events. For information on the Cisco ANA components, see the user guides for Cisco ANA, viewable online at:
http://www.cisco.com/en/US/products/ps6776/products_user_guide_list.html
Monitoring VAMS Events with the VAMS Service Dashboard
To monitor VAMS events for video services:
Step 1 ![]() Log in to IBM Tivoli Integrated Portal (TIP).
Log in to IBM Tivoli Integrated Portal (TIP).
The TIP start page appears, as shown in Figure 6-1.
Figure 6-1 TBSM Main Window

Step 2 ![]() Click the plus sign (+) next to Video Assurance Management.
Click the plus sign (+) next to Video Assurance Management.
The Video Assurance Management menu appears.
Step 3 ![]() Click the plus sign (+) next to Video Fault.
Click the plus sign (+) next to Video Fault.
Step 4 ![]() Click the plus sign (+) next to Network Fault.
Click the plus sign (+) next to Network Fault.
The TIP display now shows all of the Video Assurance Management menu items, as shown in Figure 6-2.
Figure 6-2 Video Assurance Management Menu

Step 5 ![]() Click Service Dashboard.
Click Service Dashboard.
The Service Dashboard appears:
•![]() The Service Tree shows a list of the configured video services in your network.
The Service Tree shows a list of the configured video services in your network.
Step 6 ![]() Left-click on a a service on the Service Tree directory browser at the left of the page
Left-click on a a service on the Service Tree directory browser at the left of the page
•![]() The Service Viewer shows a network topology map of the currently selected service
The Service Viewer shows a network topology map of the currently selected service
•![]() The Service Details window shows an event list for the events associated with the currently selected service.
The Service Details window shows an event list for the events associated with the currently selected service.
Figure 6-3 shows a Service Map for a service called BBC3, VIRGIN1, BBC2, BBC1, BXB-NEWS, EURONEWS. This service transmits a Multipoint Transmission Stream (MPTS) consisting of several video channels.
Figure 6-3 Service Tree and Service Map


Note ![]() Until you select a service, the Service Viewer and the Service Details window are empty.
Until you select a service, the Service Viewer and the Service Details window are empty.
Note ![]() You can sort the service tree by clicking on either the State or Events column head.
You can sort the service tree by clicking on either the State or Events column head.
Step 7 ![]() To view an event in the Service Details area, expand the Service Details area.
To view an event in the Service Details area, expand the Service Details area.
Step 8 ![]() To view details on an event, select the event and right-click.
To view details on an event, select the event and right-click.
Step 9 ![]() To expand the Service Tree for a service, click the plus sign (+) next to the service.
To expand the Service Tree for a service, click the plus sign (+) next to the service.
Step 10 ![]() To show a service view for a specific device providing the service, slick on the device in the service tree.
To show a service view for a specific device providing the service, slick on the device in the service tree.
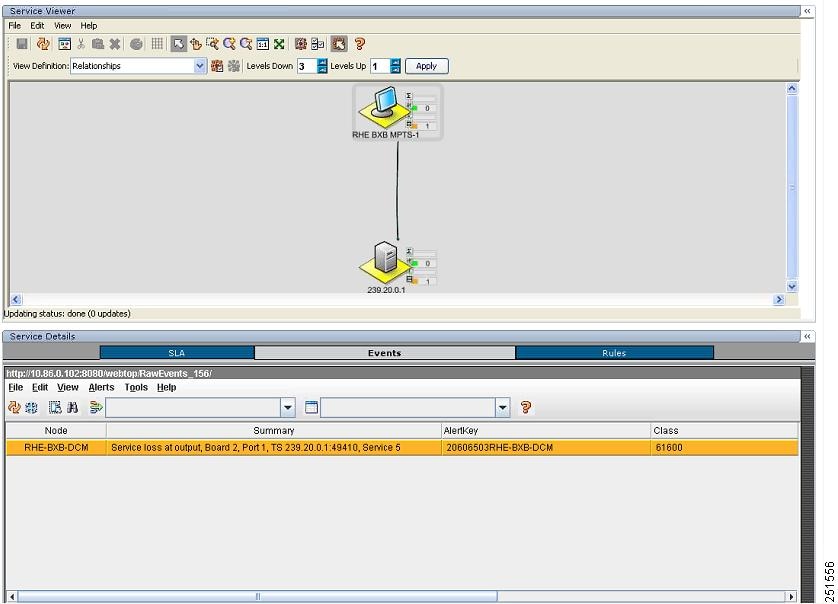
Figure 6-4 shows the service map for the RHE-BXB-MPTS-1 Primary device in the BBC3, VIRGIN1, BBC2, BBC1, BXB-NEWS, EURONEW service.
Figure 6-4 Service Viewer and Service Details Window

In the Service Viewer:
•![]() Green indicates that there is no alarm or a cleared alarm for the service.
Green indicates that there is no alarm or a cleared alarm for the service.
•![]() All other colors are service alarms for the service:
All other colors are service alarms for the service:
–![]() Red indicates the existence of critical alarms.
Red indicates the existence of critical alarms.
–![]() Yellow indicates the existence of minor alarms.
Yellow indicates the existence of minor alarms.
Step 11 ![]() To sort the events in the Service Tree by Severity, click State in the Service Tree area.
To sort the events in the Service Tree by Severity, click State in the Service Tree area.
Clicking State changes the sort order between ascending order by severity and descending order. To see the highest severity events, and any fault events, sort the list to show the highest severity events first.
Step 12 ![]() To view the details of an event:
To view the details of an event:
a. ![]() Expand the Service Details area for the device.
Expand the Service Details area for the device.
b. ![]() Double-click on the row for the event.
Double-click on the row for the event.
A table giving detailed field information for the event appears.
Step 13 ![]() For a CMM event, to launch the CMM application, first left-click on a CMM event to select it, then right-click the event, and from the Alerts Menu, choose VAMS Tools > Region Name > Launch CMM.
For a CMM event, to launch the CMM application, first left-click on a CMM event to select it, then right-click the event, and from the Alerts Menu, choose VAMS Tools > Region Name > Launch CMM.
Note ![]() The Region Name value is configurable from TBSM. For general information on configuring the Region Name, see the IBM Tivoli TBSM documentation at the following URL:
The Region Name value is configurable from TBSM. For general information on configuring the Region Name, see the IBM Tivoli TBSM documentation at the following URL:
http://publib.boulder.ibm.com/infocenter/tivihelp/v3r1/topic/com.ibm.tivoli.itbsm.doc/tbsm42custom.pdf
Note ![]() For a CMM event, you can launch a real-time CMM flow trace or launch the CMM Latest Events page for further troubleshooting. It is possible to have one or more CMM servers available to launch to. The example in Figure 6-5 shows two regional CMM servers reporting events to a single Cisco Info Center server.
For a CMM event, you can launch a real-time CMM flow trace or launch the CMM Latest Events page for further troubleshooting. It is possible to have one or more CMM servers available to launch to. The example in Figure 6-5 shows two regional CMM servers reporting events to a single Cisco Info Center server.
Figure 6-5 shows the menu selections for starting CMM.
Figure 6-5 Launching CMM from a TBSM Event List

The CMM application starts.
For additional information on the Tivoli TBSM application, and information on how to adjust and customize the TBSM window, see the IBM Tivoli TBSM documentation at the following URL:
Monitoring with the VAMS Event Views
The Video Assurance Management Dashboard provides custom event views that you can use to view events related to the specific VAMS components.
The following event views are provided:
•![]() Video Fault—Provides event views for video services, including:
Video Fault—Provides event views for video services, including:
–![]() ROSA Events—Shows events from the Cisco ROSA application
ROSA Events—Shows events from the Cisco ROSA application
See Viewing Events in the ROSA Event Views, page 6-21.
–![]() CMM Events—Shows events from CMM.
CMM Events—Shows events from CMM.
See Viewing Events in the CMM Event View, page 6-34.
–![]() Video Events—Shows events from video probes.
Video Events—Shows events from video probes.
See Viewing Events in the Video Events View, page 6-38.
–![]() VidMon Events—Shows IOS video monitoring events from VidMon devices.
VidMon Events—Shows IOS video monitoring events from VidMon devices.
See Viewing Events in the VidMon Event Views, page 6-36.
•![]() Network Fault—Includes events from Cisco ANA and from all network devices, including:
Network Fault—Includes events from Cisco ANA and from all network devices, including:
–![]() ANA Events—Shows events from Cisco ANA.
ANA Events—Shows events from Cisco ANA.
–![]() All Events—Shows all network fault events.
All Events—Shows all network fault events.
See Viewing Events in the ANA Event Views, page 6-40 and Viewing All Events, page 6-41.
To access the VAMS event views:
Step 1 ![]() Log in to IBM TIP/TBSM.
Log in to IBM TIP/TBSM.
The main TBSM window appears.
Step 2 ![]() Click the plus sign (+) next to Video Assurance Management.
Click the plus sign (+) next to Video Assurance Management.
The Video Assurance Management menu appears.
Step 3 ![]() Click the plus sign (+) next to Video Fault.
Click the plus sign (+) next to Video Fault.
Step 4 ![]() Click the plus sign (+) next to Network Fault.
Click the plus sign (+) next to Network Fault.
The TIP display now shows all of the Video Assurance Management menu items, as shown in Figure 6-6.
Figure 6-6 Video Assurance Management Menu
Step 5 ![]() To View a specific category of events, click the event selection. For example, click Video Events.
To View a specific category of events, click the event selection. For example, click Video Events.
The Events Views page for the selected event category appears. Figure 6-7 shows the event views for Video Events.
Figure 6-7 Video Events Views

The left part of the display shows monitor boxes for the selected event type. Each monitor box shows a bar graph indicating the number events in each severity level for the event category.
The Video Events views include:
•![]() Cross Launch Events—Shows events indicating a video probe has been started.
Cross Launch Events—Shows events indicating a video probe has been started.
•![]() Probe Events—Shows events from video probes.
Probe Events—Shows events from video probes.
Step 6 ![]() To view the details of an event, double-click on the row for the event.
To view the details of an event, double-click on the row for the event.
A table giving detailed field information for the event appears.
Step 7 ![]() To launch the CMM application, first left-click an event to select it, then right-click the event, and from the Alerts Menu, choose VAMS Tools > Launch CMM. or choose VAMS Tools > Launch Flowtrace.
To launch the CMM application, first left-click an event to select it, then right-click the event, and from the Alerts Menu, choose VAMS Tools > Launch CMM. or choose VAMS Tools > Launch Flowtrace.
You can launch a real-time CMM flow trace or you can launch the CMM Latest Events page for further troubleshooting.
Note ![]() It is possible to have one or more CMM servers available to launch to. The example in Figure 6-8 shows two regional CMM servers reporting events to a single Cisco Info Center server.
It is possible to have one or more CMM servers available to launch to. The example in Figure 6-8 shows two regional CMM servers reporting events to a single Cisco Info Center server.
Figure 6-8 shows the menu selections for starting CMM.
Figure 6-8 Launching CMM from an Event Item
Monitoring ROSA NMS Events
This section describes:
•![]() Summary of ROSA NMS Events, page 6-12
Summary of ROSA NMS Events, page 6-12
•![]() Viewing ROSA Alerts in the Service Dashboard
Viewing ROSA Alerts in the Service Dashboard
•![]() Viewing Events in the ROSA Event Views, page 6-21
Viewing Events in the ROSA Event Views, page 6-21
Summary of ROSA NMS Events
VAMS 3.0 allows you to monitor a variety of events from components in the video headend. These events are collected by the ROSA NMS and forwarded to Cisco Info Center. Cisco Info Center correlates the events with additional alerts received from the video network and consolidates the information into one alert.
You can view the following categories of alerts in TBSM:
•![]() Service Alerts—Indicate that a service loss has occurred, a service backup has occurred, or a transport stream has been lost. For a complete list, see Viewing ROSA Alerts in the Service Dashboard, page 6-13.
Service Alerts—Indicate that a service loss has occurred, a service backup has occurred, or a transport stream has been lost. For a complete list, see Viewing ROSA Alerts in the Service Dashboard, page 6-13.
•![]() ETR-290 First Priority Alarms—Indicate various fault conditions, such as TS Sync Loss, CC Error, Sync Byte Error, PAT Error, PMT Error, or PID Error. For a complete list, see ETR-290 First Priority Alarms, page 1-17.
ETR-290 First Priority Alarms—Indicate various fault conditions, such as TS Sync Loss, CC Error, Sync Byte Error, PAT Error, PMT Error, or PID Error. For a complete list, see ETR-290 First Priority Alarms, page 1-17.
•![]() Video Transport Events—Indicate errors in video transport, such as UDP Stream Loss, Bandwidth Exceeded, or Destination IP Unresolved. For a complete list, see Video Transport Events, page 1-18.
Video Transport Events—Indicate errors in video transport, such as UDP Stream Loss, Bandwidth Exceeded, or Destination IP Unresolved. For a complete list, see Video Transport Events, page 1-18.
•![]() Additional Video Quality Measurements—Includes additional events that measure video quality, such as Unreferenced PID Error, PMT Section Exceeds 1K, Missing FEC Stream, or Payload Bit Rate Too Low. For a complete list, see Additional Video Quality Measurements, page 1-18.
Additional Video Quality Measurements—Includes additional events that measure video quality, such as Unreferenced PID Error, PMT Section Exceeds 1K, Missing FEC Stream, or Payload Bit Rate Too Low. For a complete list, see Additional Video Quality Measurements, page 1-18.
Viewing ROSA Alerts in the Service Dashboard
By using the VAMS Service Dashboard you can view service alerts. Service alerts indicate the loss of a video service. Cisco VAMS reports four types of service alert:
•![]() Service Loss—For each incoming service, one or more alarms can be defined to trigger a Service Loss alarm. A Transport Stream Loss alarm is triggered when a Service Loss alarm occurs.
Service Loss—For each incoming service, one or more alarms can be defined to trigger a Service Loss alarm. A Transport Stream Loss alarm is triggered when a Service Loss alarm occurs.
•![]() Service in Backup (Service Loss)—This alarm is generated when a service is in backup state triggered by a Service Loss alarm.
Service in Backup (Service Loss)—This alarm is generated when a service is in backup state triggered by a Service Loss alarm.
•![]() Service Loss at Output—This alarm is generated for an outgoing service for which the corresponding incoming service and incoming backup services are in Service Loss state.
Service Loss at Output—This alarm is generated for an outgoing service for which the corresponding incoming service and incoming backup services are in Service Loss state.
•![]() Service in Backup (TS Loss)—This alarm is generated when a service is in backup state triggered by a TS Loss alarm.
Service in Backup (TS Loss)—This alarm is generated when a service is in backup state triggered by a TS Loss alarm.
Viewing a Service Loss Event
To monitor Service Loss events with Cisco Info Center, bring up an event list using Cisco Info Center/TBSM:
Step 1 ![]() Log in to TIP/TBSM.
Log in to TIP/TBSM.
Step 2 ![]() On the Video Assurance Management menu, click Service Dashboard.
On the Video Assurance Management menu, click Service Dashboard.
The Service Dashboard appears.
The Service Tree shows a list of the configured video services in your network.
Step 3 ![]() Left-click on a a service on the Service Tree directory browser at the left of the page
Left-click on a a service on the Service Tree directory browser at the left of the page
•![]() The Service Viewer shows a service map for the elected service.
The Service Viewer shows a service map for the elected service.
•![]() The Service Details window shows an event list for the service.
The Service Details window shows an event list for the service.
Step 4 ![]() To see the devices associated with the selected video service, click on the plus sign (+) next to the service name.
To see the devices associated with the selected video service, click on the plus sign (+) next to the service name.
The devices in the service topology are listed in the Service Tree directory.
Step 5 ![]() Click on a device to see the service map for the device.
Click on a device to see the service map for the device.
The Service Viewer shows a service map for the service. If there are faults, such as service loss alarms, the device is highlighted in red. In the event list in the Service Details area, fault events are highlighted in red.
The Service Viewer displays the network topology and the Service Details window shows an event list for the service.
Figure 6-9 shows a Cisco Info Center/TBSM display that includes a Service Loss event and associated events.
Figure 6-9 Viewing a Service Loss Event

The Service Loss Event summary indicates:
•![]() Board Number—The board on which the service loss occurred on the indicated device.
Board Number—The board on which the service loss occurred on the indicated device.
•![]() Port Number—The port number on which the video stream was transmitted.
Port Number—The port number on which the video stream was transmitted.
•![]() TS—A number identifying the Transport Stream affected by the service loss.
TS—A number identifying the Transport Stream affected by the service loss.
•![]() IP Address—The IP address of the port.
IP Address—The IP address of the port.
Additional Events Related to the Service Loss
The TBSM event list shown in Figure 6-9 indicates several additional events related to the service loss.
•![]() PAT Error—Occurs when the PMT reference in the Program Association Table (PAT) for the service is missing. A Service Loss alarm is also triggered.
PAT Error—Occurs when the PMT reference in the Program Association Table (PAT) for the service is missing. A Service Loss alarm is also triggered.
•![]() PMT Error—Occurs when the Program Map Table (PM) for the service is not available within a particular time interval or contains errors. A Service Loss alarm is also triggered.
PMT Error—Occurs when the Program Map Table (PM) for the service is not available within a particular time interval or contains errors. A Service Loss alarm is also triggered.
•![]() No TS Sync—Indicates a ROSA NMS event that identifies a Transport Stream (TS) from the DCM.
No TS Sync—Indicates a ROSA NMS event that identifies a Transport Stream (TS) from the DCM.
When a service loss occurs, you might see additional ETR-290 First Priority events related to the service loss; for example, you might see a CC error event indicating a discontinuity error in the MPEG TS structure for a program transmitted in the TS.
Step 6 ![]() To launch Cisco Multicast Manager to view additional monitoring information related to the service loss event:
To launch Cisco Multicast Manager to view additional monitoring information related to the service loss event:
a. ![]() Right-click on the event in the event list.
Right-click on the event in the event list.
b. ![]() From the pull-down menu, choose VAMS Tools > Region_Name > Launch CMM, where Region_Name is the name of a region or entity that you have set up in your network.
From the pull-down menu, choose VAMS Tools > Region_Name > Launch CMM, where Region_Name is the name of a region or entity that you have set up in your network.
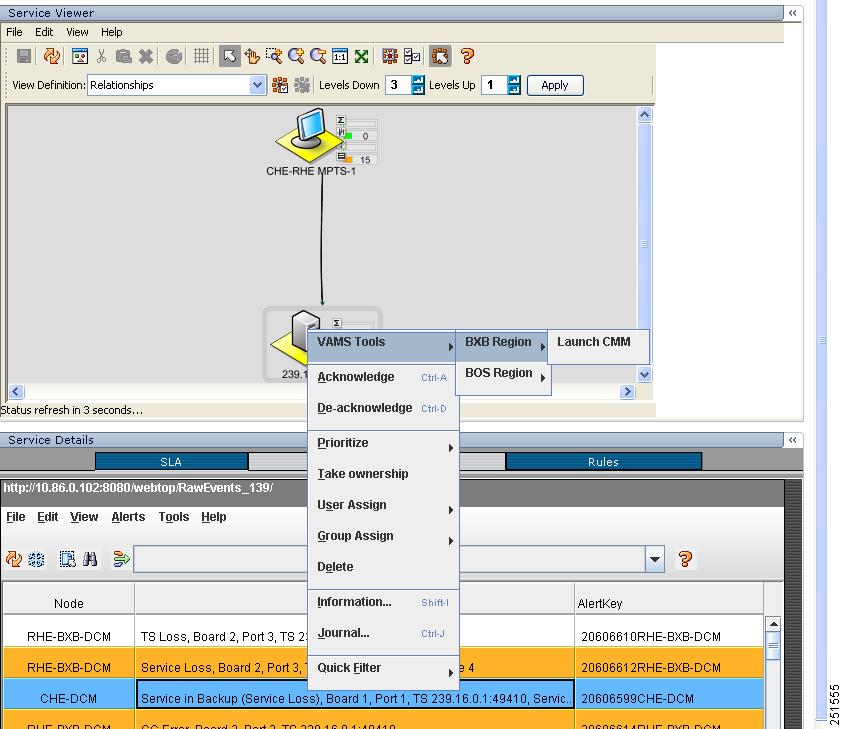
Figure 6-10 shows how to launch CMM to view additional monitoring information for service events.
Figure 6-10 Launching CMM to View Service Loss Information
Note ![]() In this example, the event highlighted in grey has been right-clicked to bring up the cross-launch menu. The cross-launch is based on the information in the event that has been selected above, which is highlighted in white.
In this example, the event highlighted in grey has been right-clicked to bring up the cross-launch menu. The cross-launch is based on the information in the event that has been selected above, which is highlighted in white.
Viewing Service Loss on Backup Events
Typically, video content is sourced from the central headend (CHE) to regional headends (RHEs), where local ads are inserted into the video stream. Regional and local content is also inserted into the video stream the resulting streams are sent out to divisions in the multicast network. Each content stream designated for a division is transmitted in a different multicast group.
Using the ROSA NMS, you can set up the DCM to fail over from the primary video source to a backup video source. For example, if the video transmission from a terrestrial antenna is interrupted, you can program the DCM to automatically switch to a secondary video source, for example, a satellite receiver dish.
When a service backup occurs, the ROSA NMS receives alerts from the DCM at the CHE and generates a Service Loss event, a Service Loss on Backup, and additional events, such as a TS Loss event.
Downstream, the RHE DCM detects ETR-290 alerts on the CHE and also reports a temporary Service Loss on Output event due to the CHE service cutover.
To view Service Loss on Backup Events.
Step 1 ![]() From the Service Tree in the Service Dashboard, click on a service that has a high priority (red) alert.
From the Service Tree in the Service Dashboard, click on a service that has a high priority (red) alert.
TBSM displays the service tree for the event and the associated Cisco Info Center event list. Figure 6-11 shows a service tree and event list for the BBC Three service:
Figure 6-11 Viewing a Service Loss Event Resulting from a Service Backup

The service tree shown in Figure 6-11 shows that the primary video signal has been lost by highlighting it in red and indicates that the secondary video signal is active by highlighting it in green.
The event list in Figure 6-11 shows the following events:
•![]() Below Low Threshold Event—This is received from CMM, indicating that the Layer 3 Multicast Rate is under the configured threshold value.
Below Low Threshold Event—This is received from CMM, indicating that the Layer 3 Multicast Rate is under the configured threshold value.
•![]() Failed to Receive IP Multicast Router Heartbeat—This event is received from the router connected the DCM at the CHE, indicating that the multicast heartbeat is no longer detected.
Failed to Receive IP Multicast Router Heartbeat—This event is received from the router connected the DCM at the CHE, indicating that the multicast heartbeat is no longer detected.
•![]() UDP Stream Loss—Indicates that the UDP port on the router communicating with the DCM no longer detects a TS from the DCM.
UDP Stream Loss—Indicates that the UDP port on the router communicating with the DCM no longer detects a TS from the DCM.
Step 2 ![]() To view the Service Loss in Backup event and associated events, in the service directory at the left of the TBSM display, click on the service that shows an alert.
To view the Service Loss in Backup event and associated events, in the service directory at the left of the TBSM display, click on the service that shows an alert.
TBSM displays a service tree and event list for the selected device, as shown in Figure 6-12
Figure 6-12 Viewing a Service Loss in Backup Event

The event list in Figure 6-12 correlates the events on the CHE DCM that was receiving the TS from the primary video source to the events indicating the error conditions on the Multiple Program Transport Stream (MPTS) generated at the CHE. The event list includes:
•![]() Service Loss—A service loss event from the DCM at the RHE indicates the loss of the primary video stream from the CHE.
Service Loss—A service loss event from the DCM at the RHE indicates the loss of the primary video stream from the CHE.
•![]() Service in Backup (Service Loss)—A service in backup event from the DCM at the CHE indicates that a service backup has occurred: the primary video source has been replaced by the secondary video source.
Service in Backup (Service Loss)—A service in backup event from the DCM at the CHE indicates that a service backup has occurred: the primary video source has been replaced by the secondary video source.
•![]() ETR-290 Alerts—The DCM at the RHE reports:
ETR-290 Alerts—The DCM at the RHE reports:
–![]() PID Error—Occurs when components referenced in the Program Map Table (PMT) are not found within a specified time interval.
PID Error—Occurs when components referenced in the Program Map Table (PMT) are not found within a specified time interval.
–![]() CC Error—Indicates a discontinuity error in the MPEG TS structure for a program transmitted in the TS.
CC Error—Indicates a discontinuity error in the MPEG TS structure for a program transmitted in the TS.
–![]() Video Probe Media Loss Rate Error—A video probe in the core transport network reports a Media Delivery Index/Media Loss Rate (MDI/MDR) event from CMM that indicates a MLR above the configured threshold.
Video Probe Media Loss Rate Error—A video probe in the core transport network reports a Media Delivery Index/Media Loss Rate (MDI/MDR) event from CMM that indicates a MLR above the configured threshold.
You can also view Service Loss at Output events at the CHE and at the RHE downstream from the CHE that is affected by the video service loss and backup.
Step 3 ![]() To view the Service Loss at Output and Related events at the CHE, in the service directory at the left of the TBSM display, click the icon for the CHE service that has a moderate (yellow) alert condition.
To view the Service Loss at Output and Related events at the CHE, in the service directory at the left of the TBSM display, click the icon for the CHE service that has a moderate (yellow) alert condition.
TBSM displays the service tree and event list for the CHE device, as shown in Figure 6-13:
Figure 6-13 Viewing a Service Loss at Output Event and Related Events at the CHE

Figure 6-13 shows the following CHE and related events:
•![]() Service Loss at Output—Indicates the Service Loss at Output condition at the CHE DCM.
Service Loss at Output—Indicates the Service Loss at Output condition at the CHE DCM.
•![]() Service Loss—Indicates the service loss event at the RHE affected by the service loss.
Service Loss—Indicates the service loss event at the RHE affected by the service loss.
•![]() ETR-290 Alerts—The DCM at the RHE reports:
ETR-290 Alerts—The DCM at the RHE reports:
–![]() PID Error—Occurs when components referenced in the Program Map Table (PMT) are not found within a specified time interval.
PID Error—Occurs when components referenced in the Program Map Table (PMT) are not found within a specified time interval.
–![]() TS Loss—The first byte of a Transport Stream packet header is the synchronization byte (0x47). A TS Loss error occurs when the synchronization byte in a sequence of at least two Transport Stream packets are not detected.
TS Loss—The first byte of a Transport Stream packet header is the synchronization byte (0x47). A TS Loss error occurs when the synchronization byte in a sequence of at least two Transport Stream packets are not detected.
Step 4 ![]() To view the Service Loss at Output event and related events at the RHE downstream from the CHE, in the service directory, click the icon for the RHE service that has a moderate (yellow) alert condition.
To view the Service Loss at Output event and related events at the RHE downstream from the CHE, in the service directory, click the icon for the RHE service that has a moderate (yellow) alert condition.
TBSM displays the service tree and event list for the selected RHE device, as shown in Figure 6-14:
Figure 6-14 Viewing a Service Loss at Output Event at the RHE
The event list in Figure 6-14 shows the Service Loss at Output event reported by the DCM at the RHE.
Step 5 ![]() To launch Cisco Multicast Manager to view additional monitoring information related to the service loss event:
To launch Cisco Multicast Manager to view additional monitoring information related to the service loss event:
a. ![]() Left-click on the event in the event list and then right-click to bring up the cross-launch menu.
Left-click on the event in the event list and then right-click to bring up the cross-launch menu.
b. ![]() From the pull-down menu, choose VAMS Tools > Region_Name > Launch CMM, where Region_Name is the name of a region or entity that you have set up in your network.
From the pull-down menu, choose VAMS Tools > Region_Name > Launch CMM, where Region_Name is the name of a region or entity that you have set up in your network.
Figure 6-15 shows how to launch CMM to view additional monitoring information for service events.
Figure 6-15 Launching CMM to View Service Loss Information
Note ![]() In this example, the event highlighted in blue has been right-clicked to bring up the cross-launch menu. This cross-launch is based on the information in the selected event above, which is highlighted in white.
In this example, the event highlighted in blue has been right-clicked to bring up the cross-launch menu. This cross-launch is based on the information in the selected event above, which is highlighted in white.
Viewing ETR-290 First Priority Alarms and Additional Events Related to a Service Loss
By selecting the services and devices associated with service loss events, you can view Video Transport Events and Additional Video Quality Measurement Events associated with the service loss events.
For examples of the TS Loss, PID Error, CC Error, and UDP Stream loss events, see Viewing a Service Loss Event, page 6-13 and Viewing Service Loss on Backup Events, page 6-15.
Viewing Events in the ROSA Event Views
To view the custom event views for ROSA events:
Step 1 ![]() Log in to IBM TIP/TBSM.
Log in to IBM TIP/TBSM.
The main TBSM window appears.
Step 2 ![]() Click the plus sign (+) next to Video Assurance Management.
Click the plus sign (+) next to Video Assurance Management.
The Video Assurance Management menu appears.
Step 3 ![]() Click the plus sign (+) next to Video Fault.
Click the plus sign (+) next to Video Fault.
Step 4 ![]() Click ROSA Events.
Click ROSA Events.
The Events Views page for ROSA events appears. Figure 6-16 shows the event views for ROSA Events.
Figure 6-16 ROSA Events Views
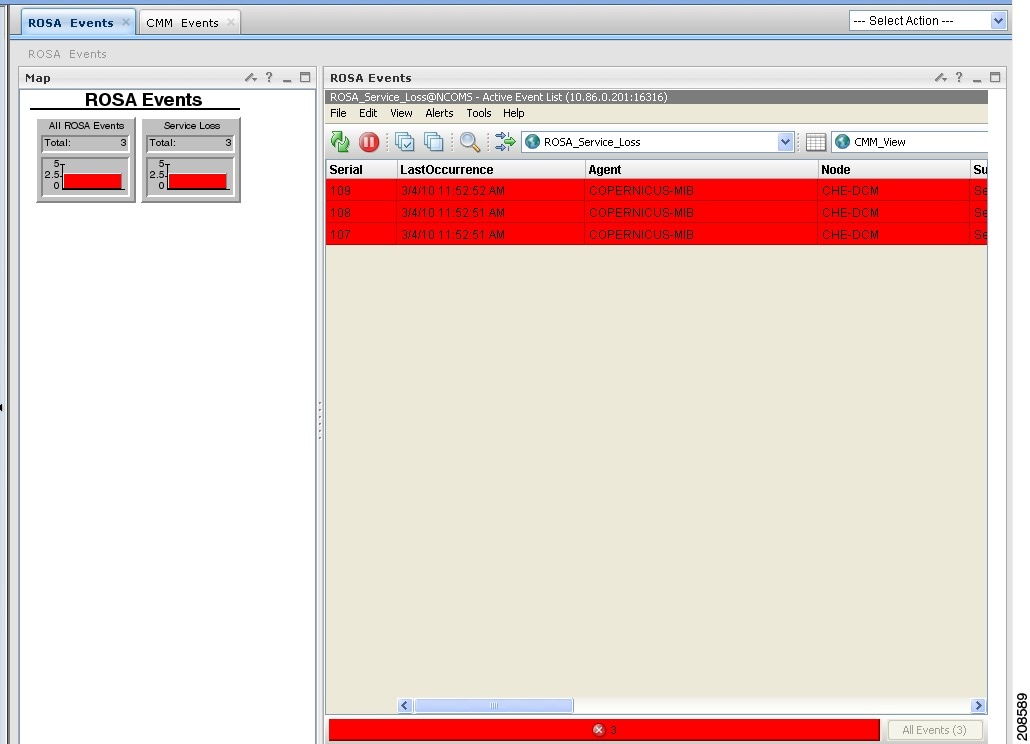
The left part of the display shows monitor boxes for the selected event type. Each monitor box shows a bar graph indicating the number events in each severity level for the event category.
The ROSA Events views include:
•![]() All ROSA Events—Includes events with a severity level of critical
All ROSA Events—Includes events with a severity level of critical
•![]() Service Loss—Shows service loss events.
Service Loss—Shows service loss events.
Step 5 ![]() To view the details of an event, double-click on the row for the event.
To view the details of an event, double-click on the row for the event.
A table giving detailed field information for the event appears
Monitoring CMM Events
This section describes:
•![]() Advanced Troubleshooting with the Service Dashboard and CMM, page 6-22
Advanced Troubleshooting with the Service Dashboard and CMM, page 6-22
•![]() Viewing Events in the CMM Event View, page 6-34
Viewing Events in the CMM Event View, page 6-34
Advanced Troubleshooting with the Service Dashboard and CMM
CMM provides a diagnostics tool that gives you a multicast global view and a router-specific view of your network. CIC events that you can view using TBSM allow you to see additional details about the network.
Table 6-1 lists important areas of the CMM that you can use to troubleshoot a multicast video distribution network using Cisco VAMS:
|
|
|
|---|---|
Viewing network status |
View the status of all devices in the current multicast domain. See "The Devices Tab" in the User Guide for Cisco Multicast Manager, 3.1 at: |
Viewing RP status |
View all routers in the database, their RPs, and the active groups. See "RP Summary" in the User Guide for Cisco Multicast Manager, 3.1 at: http://www.cisco.com/en/US/docs/net_mgmt/cisco_multicast_manager/3.1/user/guide/cmm_diag.html#wp1054769 |
IGMP diagnostics |
View the interfaces that have joined a particular group. See "IGMP Diagnostics" in the User Guide for Cisco Multicast Manager, 3.1 at: http://www.cisco.com/en/US/docs/net_mgmt/cisco_multicast_manager/3.1/user/guide/cmm_diag.html#wp1054775 |
Layer 2 switches |
View Layer 2 multicast information and host IPs. The table shows, from a Layer 2 perspective, which multicast groups are being forwarded out which interfaces. See "L2 Diagnostics" in the User Guide for Cisco Multicast Manager, 3.1 at: |
Cisco 6500/7600 troubleshooting |
Gather accurate packet-forwarding statistics and other information. See "6500/7600 Troubleshooting" in the User Guide for Cisco Multicast Manager, 3.1 at: |
Top-20 video flows |
View the top-20 video flows. The top-20 video flows are dynamically updated at every polling interval. See "Cisco Multicast Manager Dashboard" in the User Guide for Cisco Multicast Manager, 3.1 at: |
Video probe status |
View diagnostic information about video probes and the flows that they are monitoring. See Monitoring Video Probe Status with CMM. |
VidMon flow status |
View VidMon flows, VidMon reports view historical graphs of VidMon performance, and view real-time graphs showing VidMon performance. See Monitoring VidMon Status with CMM. |
Video Flow Tracing |
Video flows can be traced through the network. All routers participating in the transport of the multicast flow are listed. A graphical representation of the flow path is provided which includes IneoQuest probes and their status for a given flow. See Monitoring Video Probe Status with CMM. |
PPS/BPS Threshold Monitoring |
PPS/BPS threshold monitoring allows you to set and monitor thresholds on Cisco routers and switches for high or low BPS or PPS rates on a per flow basis. See Monitoring Multicast Tree Changes (Tree Polling), page 6-23 for details on PPS/BPS threshold monitoring. |
Monitoring Multicast Tree Changes (Tree Polling) |
View changes to multicast trees, which might affect video quality immediately, or at some time in the future. Tree polling allows you to monitor the multicast distribution tree of a video service and receive an alert when changes to the distribution tree occur. See: • • |
Health Checks |
You can perform health checks to check and report on the critical components of your network. For example, you can check on the status of Rendezvous Points (RPs), Multicast Source Discovery Protocol (MSDP) peering, the presence of sources and groups, and the status of multicast trees. See: • • |
Monitoring IP Multicast Heartbeat |
You can configure IP multicast heartbeat monitoring on Cisco routers and switches to verify that data is flowing on the monitored multicast flow(s). See Monitoring IP Multicast Heartbeat, page 6-27. |
Monitoring Multicast Tree Changes (Tree Polling)
You can monitor multicast tree changes with Cisco Multicast Manager and receive the alert in Cisco Info Center. From Cisco Info Center you can then launch CMM for advanced troubleshooting of the tree changes.
Monitoring Multicast Tree Changes with Cisco Info Center
To monitor multicast tree changes with Cisco Info Center, bring up an event list using Cisco Info Center/TBSM:
Step 1 ![]() From the service tree directory browser at the left of the Cisco Info Center/TBSM display, click on a service.
From the service tree directory browser at the left of the Cisco Info Center/TBSM display, click on a service.
The service tree for the selected service appears.
Step 2 ![]() Click on a specific device address.
Click on a specific device address.
The Service Viewer displays the network topology an the Service Details window shows an event list for the service.
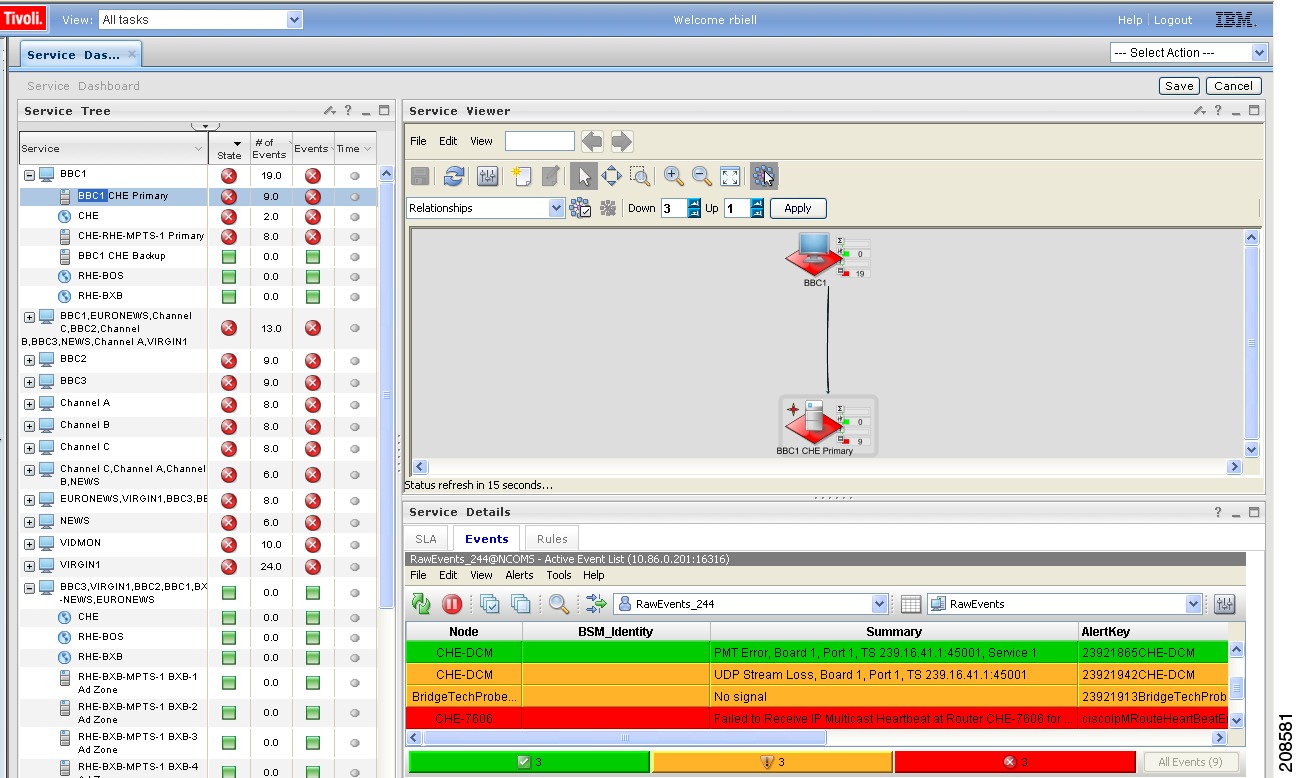
Figure 6-17 shows a Cisco Info Center/TBSM display and an event indicating that a Multicast Forwarding Tree has changed from its baseline.
Figure 6-17 Viewing a Tree Change Event in TBSM
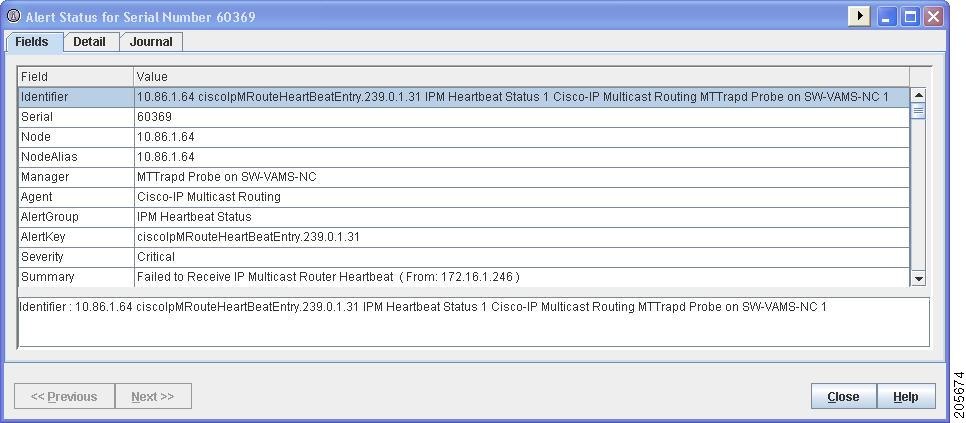
Step 3 ![]() To view the details of an event, double-click on the row for the event.
To view the details of an event, double-click on the row for the event.
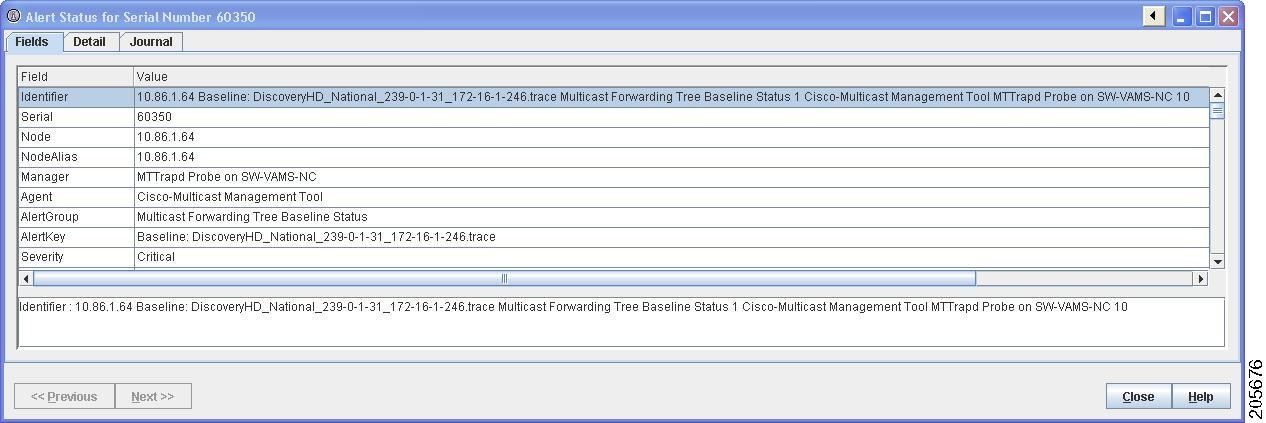
A table giving detailed field information for the tree change event appears. Figure 6-18 shows a sample Alerts Status page with tree change event details.
Figure 6-18 Detailed Tree Change Event Information
Step 4 ![]() To launch the CMM application and monitor additional information about the tree change event, highlight an event, and then from the Alerts Menu, choose VAMS Tools > Launch CMM.
To launch the CMM application and monitor additional information about the tree change event, highlight an event, and then from the Alerts Menu, choose VAMS Tools > Launch CMM.
Step 5 ![]() Go to the Monitoring Multicast Tree Changes with CMM, page 6-25 for information on monitoring tree change events with CMM.
Go to the Monitoring Multicast Tree Changes with CMM, page 6-25 for information on monitoring tree change events with CMM.
Monitoring Multicast Tree Changes with CMM
Using CMM, you can:
•![]() View the latest tree change events.
View the latest tree change events.
•![]() View a Tree Changed Report that shows details about the changes in the tree
View a Tree Changed Report that shows details about the changes in the tree
When you launch CMM from TBSM/Cisco Info Center, the CMM Latest Events list appears.
To view Tree Change events, click the Tree Events tab. Figure 6-19 shows a Latest Events list from CMM that includes tree change events.
Figure 6-19 CMM Tree Change Events
The event list in the figure shows two events:
•![]() The first event to come in is a Tree Changed event indicating that a tree has been changed.
The first event to come in is a Tree Changed event indicating that a tree has been changed.
The Tree Changed event indicates the name of the trace file that was used as the baseline to compare the current distribution tree against. The format of the trace filename shown in the event is the same format that you use to specify the trace filename when during Tree Polling configuration for the domain.
The trace filename has this format:
<channel name>_<ad zone>_<Mcast-Group>_<source-IP>
where channel_name is the name of the channel, ad_zone is the name of the Ad zone, Mcast-Group is the address of the multicast group, and source-IP is the IP address of the source. For example:
PBS_National_232-0-1-32_12-101-2-18
•![]() The second event to come in is a Tree Reverted event that indicates that the tree reverted back to its previous state. This trap has the same format as the Tree Changed event (indicates the filename of the trace file was used as the baseline to compare against).
The second event to come in is a Tree Reverted event that indicates that the tree reverted back to its previous state. This trap has the same format as the Tree Changed event (indicates the filename of the trace file was used as the baseline to compare against).
Viewing a Tree Changed Report
To view a Tree Changed Report:
Step 1 ![]() If you are in the TBSM/Cisco Info Center interface, highlight an event, and then from the Alerts Menu, choose VAMS Tools > Launch CMM.
If you are in the TBSM/Cisco Info Center interface, highlight an event, and then from the Alerts Menu, choose VAMS Tools > Launch CMM.
The CMM Latest Events page appears.
Step 2 ![]() Click the Switch to Main button.
Click the Switch to Main button.
Step 3 ![]() From the CMM Main Menu, select Polling Configuration & Reports > Tree Polling & Reports> Tree.
From the CMM Main Menu, select Polling Configuration & Reports > Tree Polling & Reports> Tree.
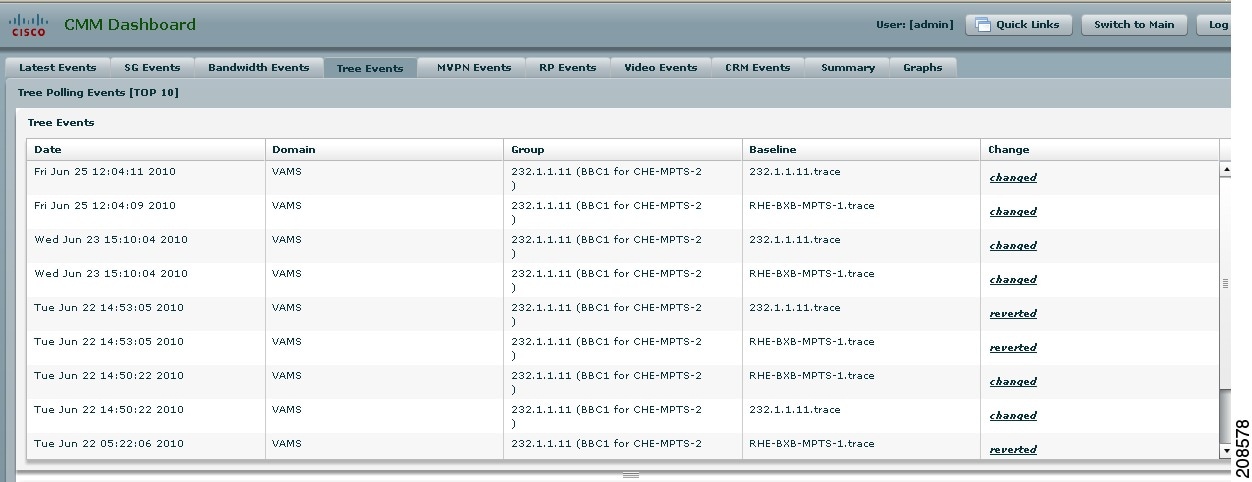
The Multicast Tree Report page appears, as shown in Figure 6-20.
Figure 6-20 Selecting a Tree Change Report

The Tree Change Report page shows a list of Multicast Tree Change reports.
Step 4 ![]() Click a changed link to view a Tree Changed Report.
Click a changed link to view a Tree Changed Report.
The selected Tree Changed Report appears, as shown in Figure 6-21.
Figure 6-21 Multicast Tree Change Report
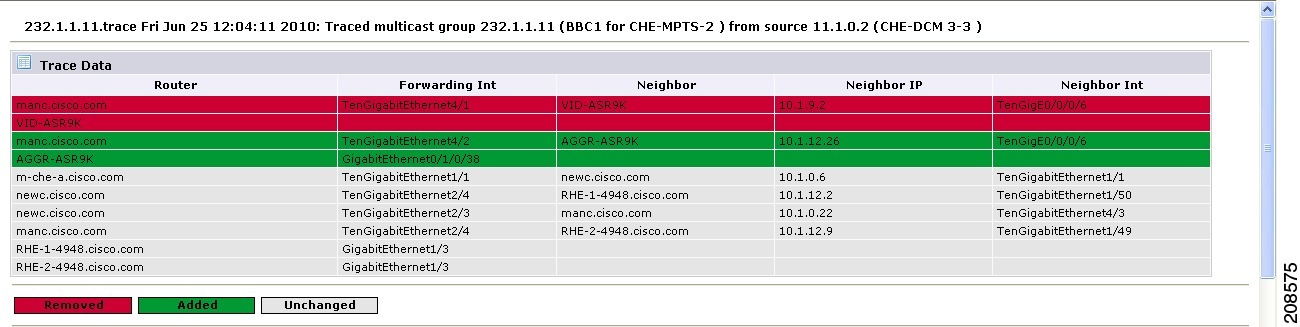
The report shows:
•![]() A table containing detailed information about the routers and interfaces in the tree
A table containing detailed information about the routers and interfaces in the tree
•![]() The baseline tree.
The baseline tree.
•![]() The current tree (changed tree).
The current tree (changed tree).
Routers and interfaces that are no longer part of the multicast tree are highlighted in red. Routers and interfaces that have been added to the distribution tree are highlighted in green.
Step 5 ![]() If you want to view a Tree Reverted report, click the reverted link next to a report name.
If you want to view a Tree Reverted report, click the reverted link next to a report name.
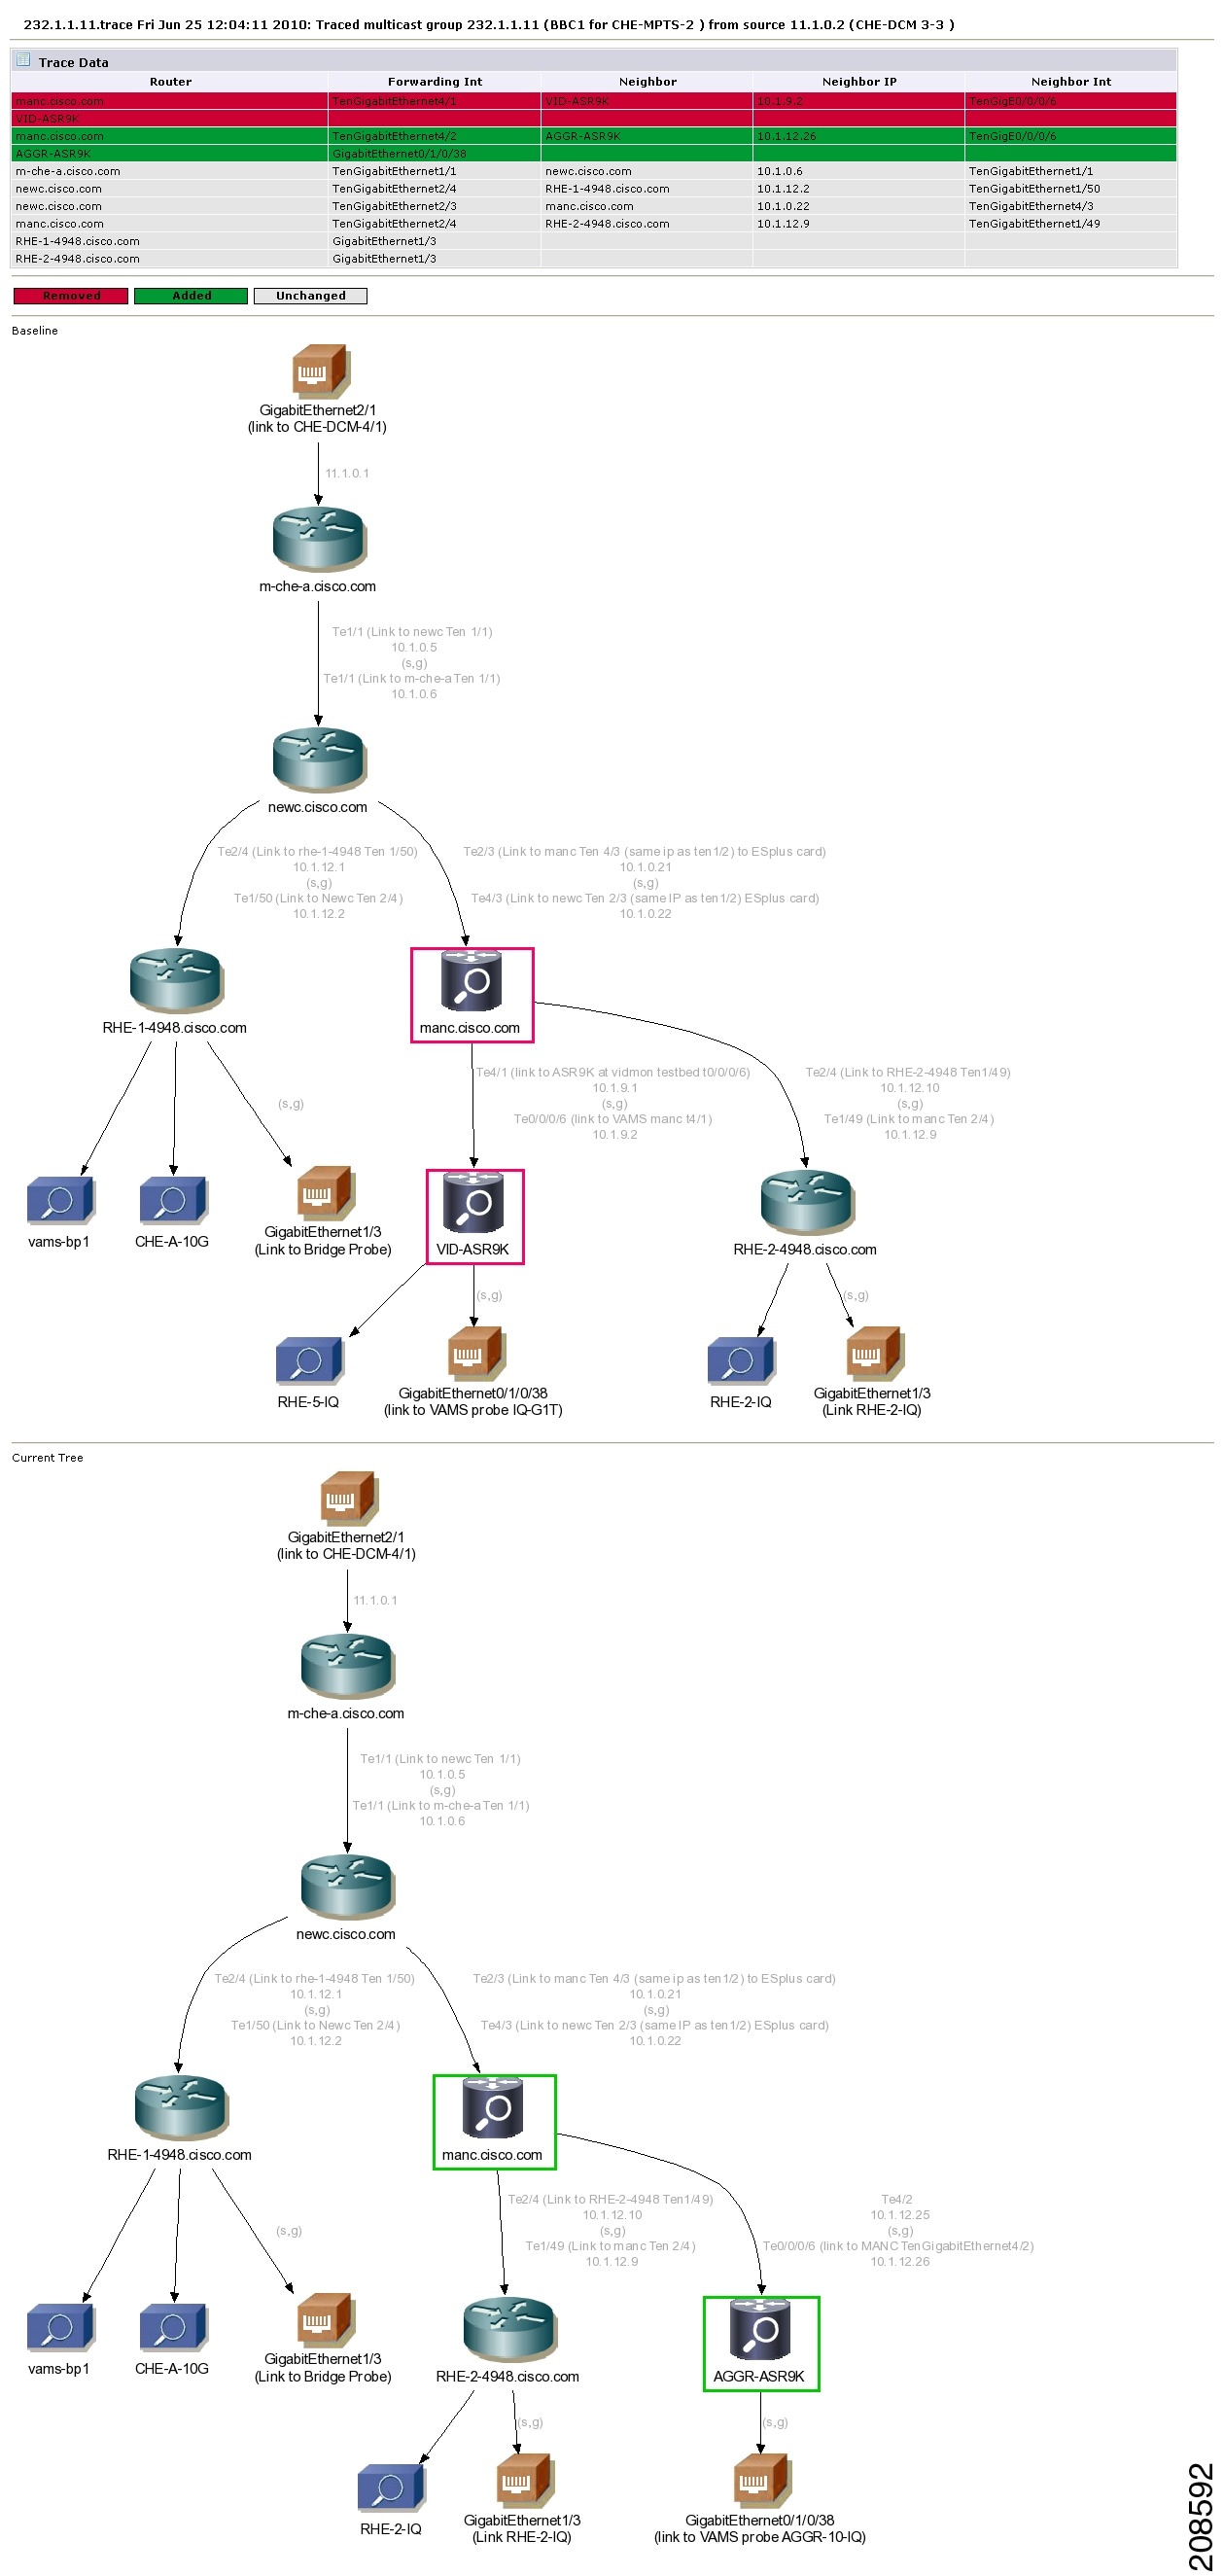
A Tree Reverted report shows the baseline distribution tree in tabular and in graphical format. Figure 6-22 shows a sample Tree Changed Report.
Figure 6-22 Tree Changed Report
Monitoring IP Multicast Heartbeat
You can monitor the multicast data plane of multicast video flows on Cisco routers and switches that utilize the IP Multicast Heartbeat feature to confirm that the routers and switches are receiving the monitored multicast video flows. You can view heartbeat events with Cisco Info Center, and from Cisco Info Center, launch CMM for advanced troubleshooting of the heartbeat events.
Monitoring Heartbeat Events with Cisco Info Center/TBSM
To view heartbeat events in TIP/TBSM:
Step 1 ![]() From the service tree directory browser at the left of the TBSM display, click on a service.
From the service tree directory browser at the left of the TBSM display, click on a service.
The service tree for the selected service appears.
Step 2 ![]() Click on a specific device address.
Click on a specific device address.
The Service Viewer displays the network topology and the Service Details window shows an event list for the service.
Figure 6-23 shows a TBSM display with a heartbeat event (Failed to Receive IP Multicast Heartbeat event) from a Cisco 7606 router.
Figure 6-23 Viewing a Heartbeat Event in TBSM
Step 3 ![]() To view additional details about the event, double click on the event in the event list display.
To view additional details about the event, double click on the event in the event list display.
Figure 6-24 shows a sample Alerts Status page with heartbeat event details.
Figure 6-24 TBSM: Viewing Heartbeat Event Details
The event summary for the service details includes the baseline trace filename, which includes the Service Name, Ad Zone, Multicast Group, and Source Address.
Step 4 ![]() To launch the CMM application and monitor additional information about the heartbeat event, left-click an event to select it, then right-click the event, and from the Alerts Menu, choose VAMS Tools Launch CMM.
To launch the CMM application and monitor additional information about the heartbeat event, left-click an event to select it, then right-click the event, and from the Alerts Menu, choose VAMS Tools Launch CMM.
Step 5 ![]() Go to Monitoring Heartbeat Events with CMM, page 6-29 for information on monitoring heartbeat events with CMM.
Go to Monitoring Heartbeat Events with CMM, page 6-29 for information on monitoring heartbeat events with CMM.
Monitoring Heartbeat Events with CMM
To view IP Multicast heartbeat events with CMM:
Step 1 ![]() If you are in the TBSM/Cisco Info Center interface, highlight an event, and then from the Alerts Menu, choose VAMS Tools > Launch CMM.
If you are in the TBSM/Cisco Info Center interface, highlight an event, and then from the Alerts Menu, choose VAMS Tools > Launch CMM.
The CMM home page shows the Latest Events list, which includes any heartbeat events that have come in.
Figure 6-25 shows a Latest Events list with a heartbeat event.
Figure 6-25 Viewing a Heartbeat Event in CMM
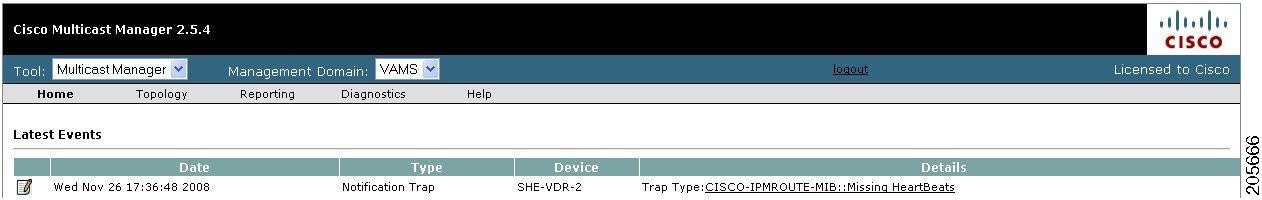
The heartbeat event includes the name of the SNMP MIB used to forward the event and the name of the event; however, CMM 3.1 does not indicate the name of the Multicast Group or the Channel Name on the Latest Events page for heartbeat events.
Step 2 ![]() To view additional information about the heartbeat event click the URL link in the Details column.
To view additional information about the heartbeat event click the URL link in the Details column.
A Trap Details list appears for the heartbeat event, as shown in Figure 6-26.
Figure 6-26 Trap Details List for a Heartbeat Event
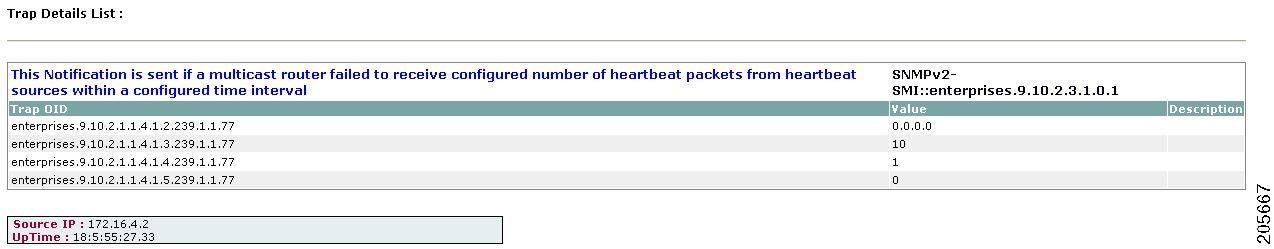
The Trap Details list displays the full description of the heartbeat event, the SNMP version used to generate the event, and the OIDs from the reporting router.
The last four octets of the OID indicate the Multicast Group. The Source IP address at the bottom of the Trap Details page is the IP address of the reporting router.
Step 3 ![]() To determine the video service affected by the event, select Diagnostics > Show All Groups and find the corresponding Multicast Group in the list that matches the heartbeat event. Note that Cisco Info Center/TBSM parses the heartbeat event to and matches the Multicast Group to the corresponding video service directly.
To determine the video service affected by the event, select Diagnostics > Show All Groups and find the corresponding Multicast Group in the list that matches the heartbeat event. Note that Cisco Info Center/TBSM parses the heartbeat event to and matches the Multicast Group to the corresponding video service directly.
Performing Health Checks
Using the Health Check page, you can run a health check on a multicast domain.
To run a health check:
Step 1 ![]() On the Multicast Manager tool, select Diagnostics > Health Check.
On the Multicast Manager tool, select Diagnostics > Health Check.
The Select Health Check page appears.
Step 2 ![]() Select a health check from the list of health checks and click Run.
Select a health check from the list of health checks and click Run.
Figure 6-27 shows a sample health check display.
Figure 6-27 Health Check
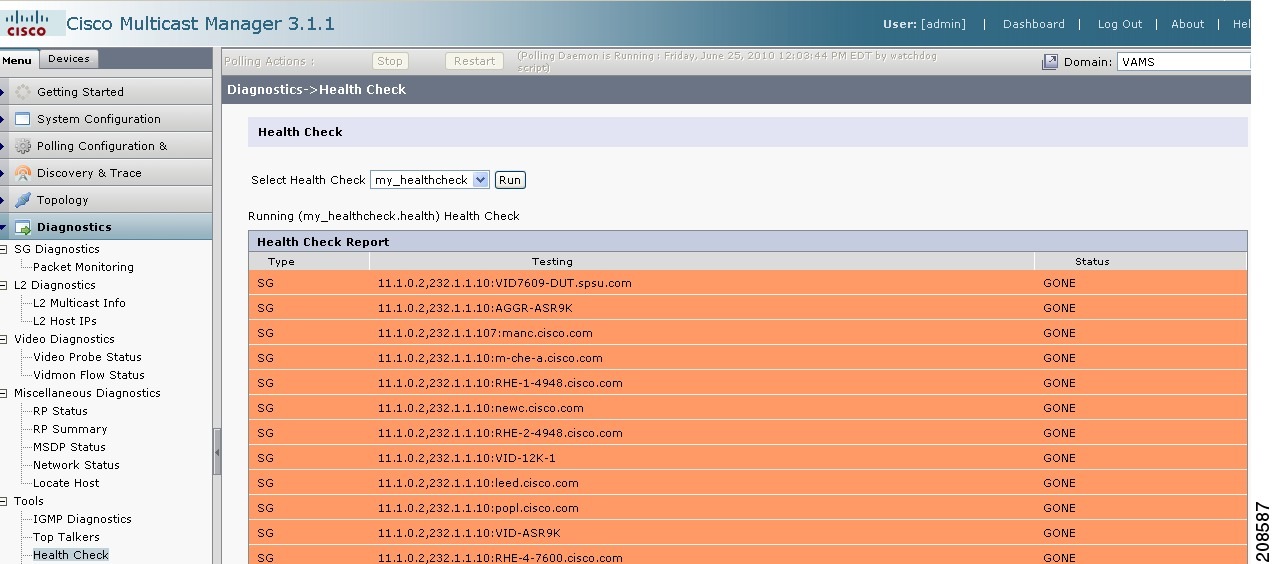
The color of the displayed text on the Health Check display indicates the status of the monitored condition:
•![]() White = normal
White = normal
•![]() Red = error condition
Red = error condition
Monitoring PPS/BPS Thresholds
When a PPS/BPS threshold is exceeded or fails to reach a minimum value, an event is generated and the event is displayed in Cisco Info Center event lists. From the event list, you can launch CMM to view enhanced monitoring information about the threshold event.
Monitoring PPS/BPS Thresholds in the Service Dashboard
To view PPS/BPS threshold events in the TBSM Service Dashboard:
Step 1 ![]() From the service tree directory browser at the left of the TBSM display, click on a service.
From the service tree directory browser at the left of the TBSM display, click on a service.
The service tree for the selected service appears.
Step 2 ![]() Click on a specific device address.
Click on a specific device address.
The Service Viewer displays the network topology and the Service Details window shows an event list for the service.
Figure 6-28 shows a Service Dashboard with threshold events indicating that a Layer 3 multicast PPS rate is below the configured threshold level.
Related VidMon events show that VidMon delay thresholds in the service tree for the VidMon TS have been exceeded.
Figure 6-28 Viewing a Threshold Event in TBSM

The event summary for threshold events includes the measured value and the configured threshold.
Step 3 ![]() To view additional details about the event, double-click on the event in the event list.
To view additional details about the event, double-click on the event in the event list.
Step 4 ![]() To launch the CMM application and monitor additional information about the threshold events, highlight an event, and then from the Alerts Menu, choose VAMS Tools > Launch CMM.
To launch the CMM application and monitor additional information about the threshold events, highlight an event, and then from the Alerts Menu, choose VAMS Tools > Launch CMM.
Step 5 ![]() Go to the Monitoring Threshold Events with CMM, page 6-32 for information on monitoring threshold events with CMM.
Go to the Monitoring Threshold Events with CMM, page 6-32 for information on monitoring threshold events with CMM.
Monitoring Threshold Events with CMM
To view threshold events with CMM:
Step 1 ![]() If you are in the TBSM/Cisco Info Center interface, highlight an event, and then from the Alerts Menu, choose VAMS Tools > Launch CMM.
If you are in the TBSM/Cisco Info Center interface, highlight an event, and then from the Alerts Menu, choose VAMS Tools > Launch CMM.
The CMM home page shows the Latest Events list.
Step 2 ![]() Click SG Events.
Click SG Events.
Step 3 ![]() The SG Events page appears, which includes any BPS/PPS threshold events that have come in.
The SG Events page appears, which includes any BPS/PPS threshold events that have come in.
Figure 6-29 shows a SG Events page with BPS/PPS threshold events.
Figure 6-29 Viewing BPS/PPS Threshold Events in CMM
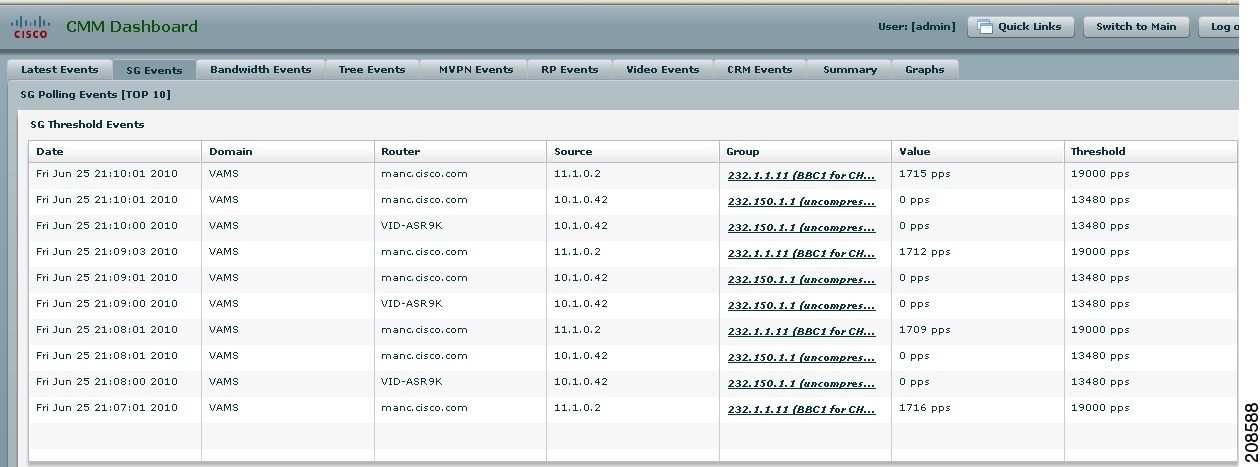
The Value column for BPS/PPS threshold events includes the measured value and the Threshold field indicates the configured threshold.
Note ![]() CMM 3.1 does not reflect the BPS/PPS flow status on CMM flow traces, as it does for video probe status. Therefore, you will have to manually correlate the devices reporting BPS/PPS events from either Cisco Info Center/TBSM or the CMM Latest Events page, to the CMM flow trace, to isolate where in the distribution tree the problem is occurring.
CMM 3.1 does not reflect the BPS/PPS flow status on CMM flow traces, as it does for video probe status. Therefore, you will have to manually correlate the devices reporting BPS/PPS events from either Cisco Info Center/TBSM or the CMM Latest Events page, to the CMM flow trace, to isolate where in the distribution tree the problem is occurring.
Running Threshold Reports
CMM provides two threshold reports that you can use to monitor threshold events:
•![]() S, G Threshold Report—Shows threshold events for a specified source and group.
S, G Threshold Report—Shows threshold events for a specified source and group.
•![]() Layer 2 PPS Threshold Report—Shows threshold events for a specified port on a specified switch.
Layer 2 PPS Threshold Report—Shows threshold events for a specified port on a specified switch.
To run an S, G Threshold report:
Step 1 ![]() In the CMM Multicast Manager tool, click Reporting.
In the CMM Multicast Manager tool, click Reporting.
Step 2 ![]() Select S, G Threshold Report.
Select S, G Threshold Report.
A list of groups appears.
Step 3 ![]() Select a group from the list and then click Report.
Select a group from the list and then click Report.
CMM displays an S,G Threshold Report listing any events that have occurred in the last 24 hours.
To run a Layer 2 PPS Threshold report:
Step 1 ![]() In the CMM Multicast Manager tool, click Reporting.
In the CMM Multicast Manager tool, click Reporting.
Step 2 ![]() Select Layer 2 PPS Threshold Report.
Select Layer 2 PPS Threshold Report.
A list of groups appears.
Step 3 ![]() Select a group from the list and then click Report.
Select a group from the list and then click Report.
CMM displays a Layer 2 PPS Threshold Report listing any events that have occurred in the last 24 hours.
Monitoring Video Probe Status with CMM
Using CMM, you can:
•![]() View video probe flows.
View video probe flows.
See Viewing Video Probe Flows.
•![]() View Video Probe Reports
View Video Probe Reports
See Viewing Video Probe Reports.
•![]() View a historical graph of video probe performance
View a historical graph of video probe performance
See Viewing a Historical Graph of Video Probe Performance.
•![]() View a graph of video probe performance
View a graph of video probe performance
See Viewing Video Probe Performance Graphs.
Viewing Video Probe Flows
To view video probe status:
Step 1 ![]() Right-click on a CMM event and from the Alerts Menu, choose VAMS Tools > Launch CMM.
Right-click on a CMM event and from the Alerts Menu, choose VAMS Tools > Launch CMM.
Step 2 ![]() From the Cisco Multicast Manager menu, select Diagnostics.
From the Cisco Multicast Manager menu, select Diagnostics.
Step 3 ![]() Select Video Diagnostics.
Select Video Diagnostics.
Step 4 ![]() Select Video Probe Status.
Select Video Probe Status.
The Video Probe Status page opens. The Video Probe Status page shows the currently monitored video probes, the number of flows monitored by each probe, and a status indicator for the probe.
For detailed information, see the User Guide for Cisco Multicast Manager, 3.1 at this location:
Viewing Video Probe Reports
To view video probe reports in CMM:
Step 1 ![]() Right-click on a CMM event and from the Alerts Menu, choose VAMS Tools > Launch CMM.
Right-click on a CMM event and from the Alerts Menu, choose VAMS Tools > Launch CMM.
Step 2 ![]() From the Multicast Manager menu, select Polling Configuration & Reports.
From the Multicast Manager menu, select Polling Configuration & Reports.
Step 3 ![]() Select Miscellaneous Polling & Reports.
Select Miscellaneous Polling & Reports.
Step 4 ![]() Select Video Probe.
Select Video Probe.
For additional information, see "Video Probe Report" in the User Guide for Cisco Multicast Manager, 3.1 at this location:
Viewing a Historical Graph of Video Probe Performance
Cisco Multicast Manager 3.1 allows you to view a historical graph showing performance of a specified video probe over time.
To view a historical graph of video probe performance:
Step 1 ![]() Right-click on a CMM event and from the Alerts Menu, choose VAMS Tools > Launch CMM.
Right-click on a CMM event and from the Alerts Menu, choose VAMS Tools > Launch CMM.
Step 2 ![]() From the Multicast Manager menu, select Polling Configuration & Reports.
From the Multicast Manager menu, select Polling Configuration & Reports.
Step 3 ![]() Select Miscellaneous Polling & Reports.
Select Miscellaneous Polling & Reports.
Step 4 ![]() Select Video Probe.
Select Video Probe.
Step 5 ![]() Select Historical Report. The Historical Graphs page for video probe reports appears, as shown in Figure 6-30.
Select Historical Report. The Historical Graphs page for video probe reports appears, as shown in Figure 6-30.
Figure 6-30 Historical Graphs Page for Video Probes
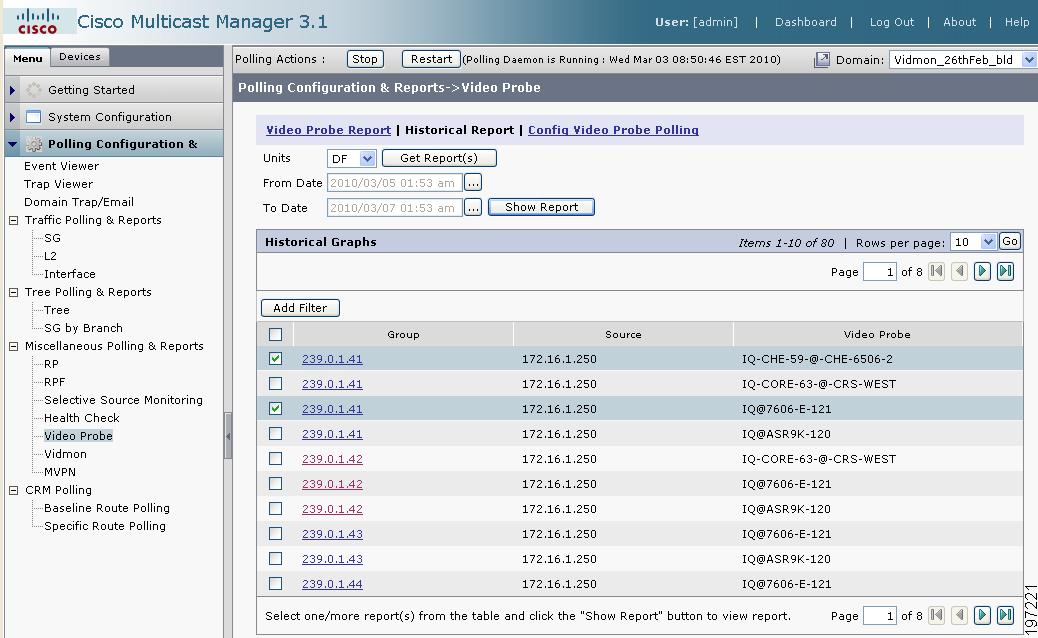
Step 6 ![]() From the drop-down list in the Units field, select the units for the report:
From the drop-down list in the Units field, select the units for the report:
DF |
Display delay factor data. |
MLR |
Display Media Loss Rate data. |
Step 7 ![]() Click the calendar item (...) for From Date and from the calendar that appears, select the From Date.
Click the calendar item (...) for From Date and from the calendar that appears, select the From Date.
Step 8 ![]() Click the calendar item (...) for To Date and from the calendar that appears, select the To Date,
Click the calendar item (...) for To Date and from the calendar that appears, select the To Date,
Step 9 ![]() On the list of Video Probes, check the check boxes for up to three video probes.
On the list of Video Probes, check the check boxes for up to three video probes.
Step 10 ![]() Click the Show Report button.
Click the Show Report button.
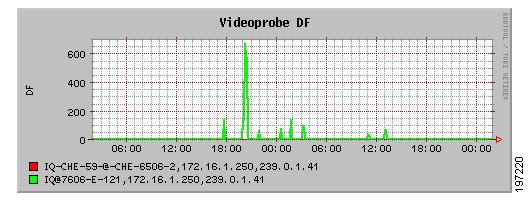
A graph showing the statistics for the selected video probes appears, as shown in Figure 6-31.
Figure 6-31 Historical Report Showing DF for Two Video Probes
Viewing Video Probe Performance Graphs
From the CMM Event Dashboard, you can view a graph showing real-time DF or MLR for a specified video probe.
To view a video probe performance graph:
Step 1 ![]() Right-click on a CMM event and from the Alerts Menu, choose VAMS Tools > Launch CMM.
Right-click on a CMM event and from the Alerts Menu, choose VAMS Tools > Launch CMM.
Step 2 ![]() From the CMM Dashboard, click the Graphs tab.
From the CMM Dashboard, click the Graphs tab.
For detailed information, see "Viewing Performance Graphs from the Dashboard" in the User Guide for Cisco Multicast Manager, 3.1 at this location:
Monitoring VidMon Status with CMM
Using CMM, you can:
•![]() View VidMon Flows
View VidMon Flows
See Viewing VidMon Flows.
•![]() View Vidmon reports
View Vidmon reports
•![]() View historical graphs of VidMon performance
View historical graphs of VidMon performance
See Viewing VidMon Historical Reports.
•![]() View a graph of video probe performance
View a graph of video probe performance
See Viewing VidMon Performance Graphs.
Viewing VidMon Flows
To view VidMon flows from CMM:
Step 1 ![]() Right-click on a CMM event and from the Alerts Menu, choose VAMS Tools > Launch CMM.
Right-click on a CMM event and from the Alerts Menu, choose VAMS Tools > Launch CMM.
Step 2 ![]() From the Cisco Multicast Manager menu, select Diagnostics.
From the Cisco Multicast Manager menu, select Diagnostics.
Step 3 ![]() Select Video Diagnostics.
Select Video Diagnostics.
Step 4 ![]() Select Vidmon Flow Status
Select Vidmon Flow Status
The Vidmon Flow Status page appears. The Video Flow Status page shows the status of the Vidmon devices in the CMM network topology.
Step 5 ![]() To view more detailed status for the interfaces on the Vidmon device, click a device name on the Video Flow Status page.
To view more detailed status for the interfaces on the Vidmon device, click a device name on the Video Flow Status page.
The Vidmon Flows Status page appears. The Vidmon Flows Status page shows the status of the current video flow on each interface on the device.
Step 6 ![]() To view detailed statistics on the current video flow on the interface, click on an interface name in the list.
To view detailed statistics on the current video flow on the interface, click on an interface name in the list.
The Vidmon Interface Flows page appears. The Vidmon Interface Flows page shows detailed statistics for the current flows on the interface.
To refresh monitoring data, click the Monitor Flows button.
Figure 6-32 shows the Vidmon Interface Flows page.
Figure 6-32 Vidmon Interface Flows Page
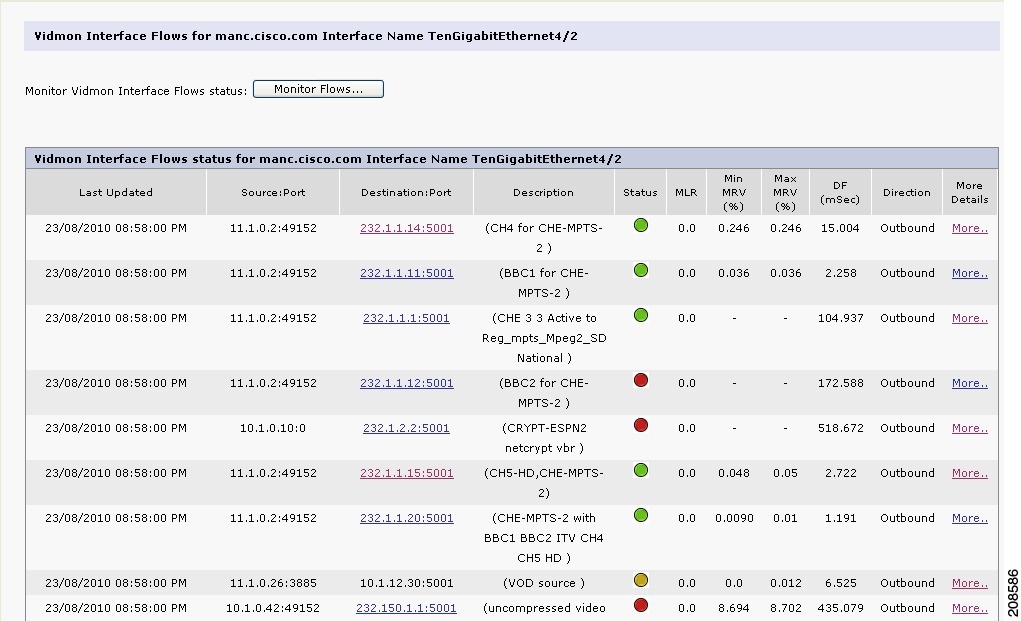
The Vidmon Interface Flows Page shows the following information for the video flows:
•![]() The IP address of the Source port.
The IP address of the Source port.
•![]() The IP address of the Destination port.
The IP address of the Destination port.
•![]() The status of the flow:
The status of the flow:
–![]() Green indicates that the flow is being transmitted with no errors.
Green indicates that the flow is being transmitted with no errors.
–![]() Yellow indicates a minor fault in the TS.
Yellow indicates a minor fault in the TS.
–![]() Red indicates a major fault in the TS.
Red indicates a major fault in the TS.
•![]() For Cisco 76xx devices, the Media Loss Rate (MLR)
For Cisco 76xx devices, the Media Loss Rate (MLR)
Note ![]() MLR is not monitored for Cisco ASR 9000 devices.
MLR is not monitored for Cisco ASR 9000 devices.
•![]() The minimum Media Rate Variation (MRV).
The minimum Media Rate Variation (MRV).
•![]() The maximum MRV.
The maximum MRV.
•![]() The direction of the flow (outbound or inbound).
The direction of the flow (outbound or inbound).
Step 7 ![]() To clear yellow indicators, click the Clear button.
To clear yellow indicators, click the Clear button.
Step 8 ![]() To perform a multicast trace for the flow, click on the IP address of the Destination Port for the flow.
To perform a multicast trace for the flow, click on the IP address of the Destination Port for the flow.
Step 9 ![]() To view additional details regarding the flow, such as the number of intervals and metrics for the flow, click on the More link in the More Details column.
To view additional details regarding the flow, such as the number of intervals and metrics for the flow, click on the More link in the More Details column.
The Vidmon Interface Flows page for the interface appears, as shown in Figure 6-33.
Figure 6-33 Vidmon Interface Flows Page for a 76xx Device
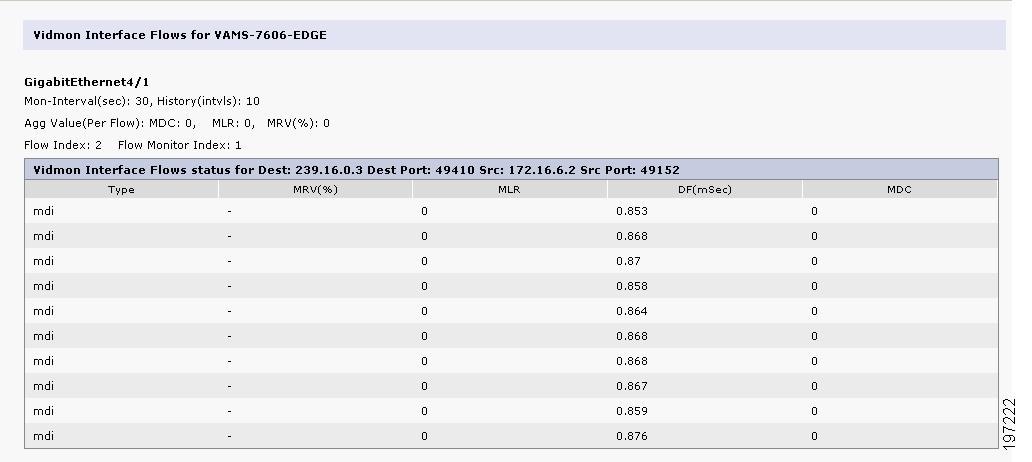
The Vidmon Interface Flows Page shown in Figure 6-33 indicates flow information for a Cisco 76xx device.
The Vidmon Interface Flow for a Cisco 76xx devices shows
•![]() Type—The flow table maintained for Cisco 76xx is an MDI table.
Type—The flow table maintained for Cisco 76xx is an MDI table.
•![]() MLR—Indicates the MLR for the flow.
MLR—Indicates the MLR for the flow.
•![]() DF—Indicates the DF for the flow.
DF—Indicates the DF for the flow.
•![]() MDC—Indicates the Medic Discontinuity Counter (MDC) value for the flow.
MDC—Indicates the Medic Discontinuity Counter (MDC) value for the flow.
Figure 6-34 shows a Vidmon Interface Flows page for an ASR 9000 device.
Figure 6-34 Vidmon Interface Flows Page for an ASR 9000 Device.
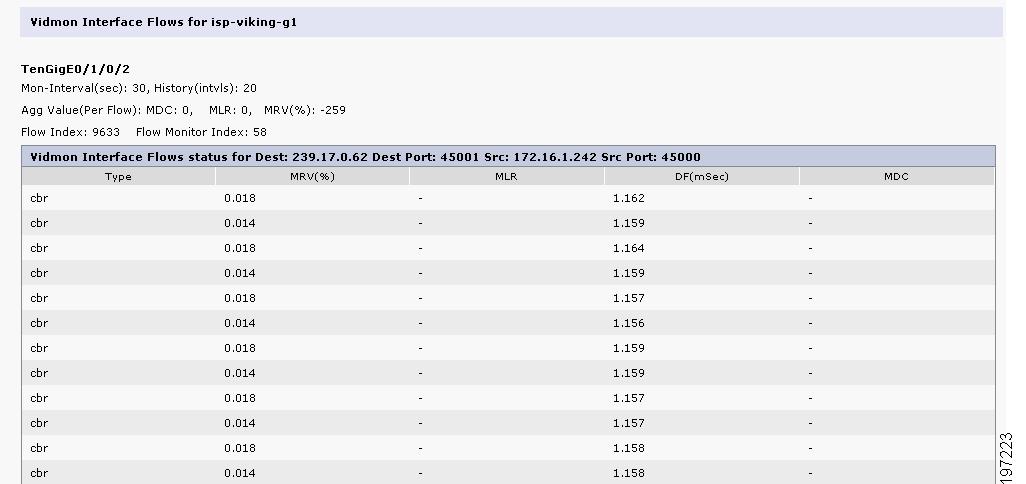
The Vidmon Interface Flows page shows the following information:
•![]() Type—The flow table maintained for Cisco ASR 9000 series devices is a CBR table.
Type—The flow table maintained for Cisco ASR 9000 series devices is a CBR table.
•![]() MRV %—The MRV value in millisecond percentage.
MRV %—The MRV value in millisecond percentage.
•![]() DF—The delay factor.
DF—The delay factor.
Viewing VidMon Reports
To view VidMon reports in CMM:
Step 1 ![]() Right-click on a CMM event and from the Alerts Menu, choose VAMS Tools > Launch CMM.
Right-click on a CMM event and from the Alerts Menu, choose VAMS Tools > Launch CMM.
Step 2 ![]() From the Multicast Manager menu, select Polling Configuration & Reports.
From the Multicast Manager menu, select Polling Configuration & Reports.
Step 3 ![]() Select Miscellaneous Polling & Reports.
Select Miscellaneous Polling & Reports.
Step 4 ![]() Select VidMon.
Select VidMon.
For additional information, see "Viewing a VidMon Report" in the User Guide for Cisco Multicast Manager, 3.1 at this location:
Viewing VidMon Historical Reports
To view a historical graph of VidMon performance in CMM:
Step 1 ![]() Right-click on a CMM event and from the Alerts Menu, choose VAMS Tools > Launch CMM.
Right-click on a CMM event and from the Alerts Menu, choose VAMS Tools > Launch CMM.
Step 2 ![]() From the Multicast Manager menu, select Polling Configuration & Reports.
From the Multicast Manager menu, select Polling Configuration & Reports.
Step 3 ![]() Select Miscellaneous Polling & Reports.
Select Miscellaneous Polling & Reports.
Step 4 ![]() Select Vidmon.
Select Vidmon.
Step 5 ![]() Select Historical Report. The Historical Graphs page for video probe reports appears.
Select Historical Report. The Historical Graphs page for video probe reports appears.
Step 6 ![]() From the drop-down list in the Units field, select the units for the report:
From the drop-down list in the Units field, select the units for the report:
DF |
Display delay factor data. |
|---|---|
MLR |
Display Media Loss Rate data. |
MRV |
Display Media Rate Variation data. |
Step 7 ![]() Click the calendar item (...) for From Date and from the calendar that appears, select the From Date.
Click the calendar item (...) for From Date and from the calendar that appears, select the From Date.
Step 8 ![]() Click the calendar item (...) for To Date and from the calendar that appears, select the To Date,
Click the calendar item (...) for To Date and from the calendar that appears, select the To Date,
Step 9 ![]() On the list of interfaces on Vidmon devices, check the check boxes for up to three interfaces.
On the list of interfaces on Vidmon devices, check the check boxes for up to three interfaces.
Step 10 ![]() Click the Show Report button.
Click the Show Report button.
A graph showing the statistics for the selected Vidmon devices appears.
Viewing VidMon Performance Graphs
From the CMM Event Dashboard, you can view a graph showing real-time DF, MLR, or MRV for a specified VidMon device.
To view a VidMon performance graph:
Step 1 ![]() Right-click on a CMM event and from the Alerts Menu, choose VAMS Tools > Launch CMM.
Right-click on a CMM event and from the Alerts Menu, choose VAMS Tools > Launch CMM.
Step 2 ![]() From the CMM Dashboard, click the Graphs tab.
From the CMM Dashboard, click the Graphs tab.
For detailed information, see "Viewing Performance Graphs from the Dashboard" in the User Guide for Cisco Multicast Manager, 3.1 at this location:
Viewing Events in the CMM Event View
To view the custom CMM event views:
Step 1 ![]() Log in to IBM TIP/TBSM.
Log in to IBM TIP/TBSM.
The main TBSM window appears.
Step 2 ![]() Click the plus sign (+) next to Video Assurance Management.
Click the plus sign (+) next to Video Assurance Management.
The Video Assurance Management menu appears.
Step 3 ![]() Click the plus sign (+) next to Video Fault.
Click the plus sign (+) next to Video Fault.
Step 4 ![]() Click CMM Events.
Click CMM Events.
The Events Views page for the CMM events appears.Figure 6-35 shows the event views for CMM Events.
Figure 6-35 CMM Events Views
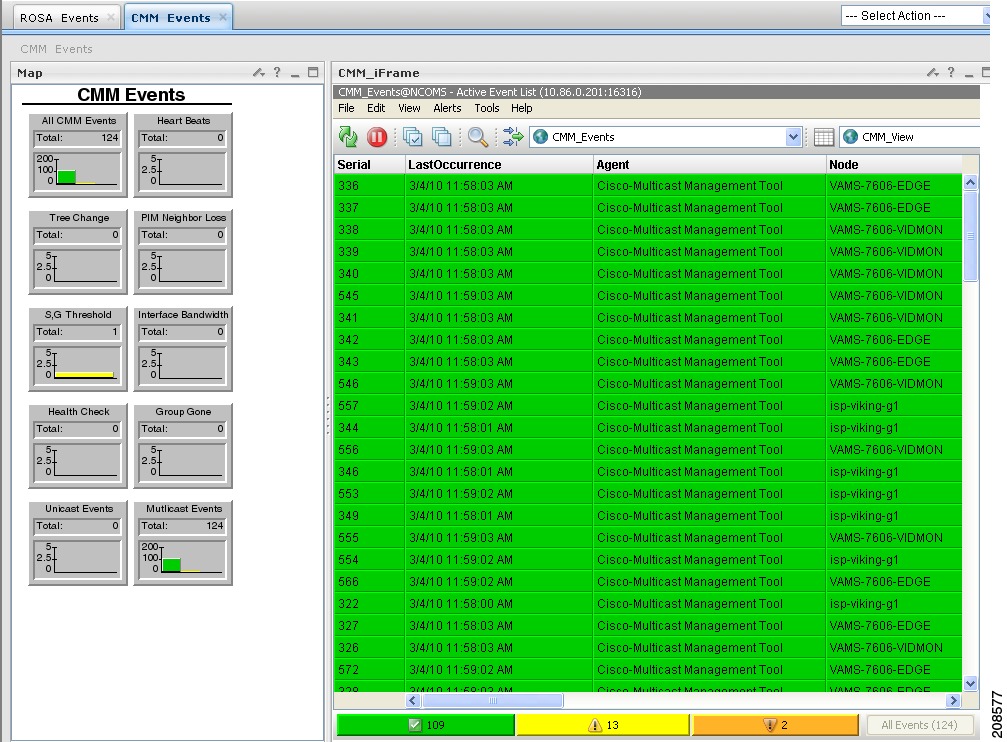
The left part of the display shows monitor boxes for the selected event type. Each monitor box shows a bar graph indicating the number events in each severity level for the event category.
The CMM Events views include:
•![]() All CMM Events—Shows all CMM events.
All CMM Events—Shows all CMM events.
•![]() Heart Beats—Shows heartbeat events from CMM.
Heart Beats—Shows heartbeat events from CMM.
•![]() Tree Change—Shows tree change events.
Tree Change—Shows tree change events.
•![]() PIM Neighbor Loss—Shows events from video probes.
PIM Neighbor Loss—Shows events from video probes.
•![]() S,G Threshold—Shows S,G threshold events (above threshold and below threshold events)
S,G Threshold—Shows S,G threshold events (above threshold and below threshold events)
•![]() Interface Bandwidth—Shows events indicating a video probe has been started.
Interface Bandwidth—Shows events indicating a video probe has been started.
•![]() Health Check—Shows events from video probes.
Health Check—Shows events from video probes.
•![]() Group Gone—Shows video events for the last 24 hours,
Group Gone—Shows video events for the last 24 hours,
•![]() Unicast Events—Shows events indicating a video probe has been started.
Unicast Events—Shows events indicating a video probe has been started.
•![]() Multicast Events—Shows events from video probes.
Multicast Events—Shows events from video probes.
Step 5 ![]() To see the events in a CMM event view, click the monitor box for the event class.
To see the events in a CMM event view, click the monitor box for the event class.
For example, click the monitor box for S,G Threshold events to see all S,G Threshold events from CMM.
Step 6 ![]() To view the details of an event, double-click on the row for the event.
To view the details of an event, double-click on the row for the event.
A table giving detailed field information for the event appears.
Step 7 ![]() To troubleshoot the event in CMM, right-click the event, and from the Alerts menu, choose VAMS Tools > Launch CMM.
To troubleshoot the event in CMM, right-click the event, and from the Alerts menu, choose VAMS Tools > Launch CMM.
Monitoring VidMon Events
This section describes:
•![]() Monitoring VidMon Events in the Service Dashboard, page 6-35
Monitoring VidMon Events in the Service Dashboard, page 6-35
•![]() Viewing Events in the VidMon Event Views, page 6-36
Viewing Events in the VidMon Event Views, page 6-36
Monitoring VidMon Events in the Service Dashboard
To monitor VidMon events in the service dashboard:
Step 1 ![]() On the Video Assurance Management menu, click Service Dashboard.
On the Video Assurance Management menu, click Service Dashboard.
The Service Dashboard appears:
The Service Tree shows a list of the configured video services in your network.
Step 2 ![]() Left-click on a a service on the Service Tree directory browser at the left of the page
Left-click on a a service on the Service Tree directory browser at the left of the page
•![]() The Service Viewer shows a service map for the elected service.
The Service Viewer shows a service map for the elected service.
•![]() The Service Details window shows an event list for the service.
The Service Details window shows an event list for the service.
Figure 6-36 shows the Service Tree, Service Viewer, and Service Details window for a service called BBC2.
Figure 6-36 Service Dashboard for a High Level Service

Step 3 ![]() To see the devices associated with the selected video service, click on the plus sign (+) next to the service name.
To see the devices associated with the selected video service, click on the plus sign (+) next to the service name.
The devices in the service topology are listed in the Service Tree directory.
Step 4 ![]() Click on a device or service component to see the service map for the device or component.
Click on a device or service component to see the service map for the device or component.
The Service Viewer shows a service map for the device. If there are faults, such as VidMon alarms, the device is highlighted in red or in yellow. In the event list in the Service Details area, fault events are highlighted in yellow or red.
Figure 6-37 shows a Service Map and fault events for a device called BBC2-c, which is associated with the BBC2 service.
Figure 6-37 Viewing VidMon Events in the Service Dashboard

The event list shown in Figure 6-36 shows several VidMon events:
•![]() Vidmon Delay Factor Exceeded Threshold—SNMP trap generated by CMM indicating that a VidMon DF threshold has been exceeded on a Cisco 7600 device (Cisco 7606).
Vidmon Delay Factor Exceeded Threshold—SNMP trap generated by CMM indicating that a VidMon DF threshold has been exceeded on a Cisco 7600 device (Cisco 7606).
•![]() Vidmon Media Loss Rate Exceeded Threshold—SNMP trap generated by CMM and forwarded by the MTTrapd probe, indicating that a configured MLR threshold has been exceeded on a Cisco 7600 device.
Vidmon Media Loss Rate Exceeded Threshold—SNMP trap generated by CMM and forwarded by the MTTrapd probe, indicating that a configured MLR threshold has been exceeded on a Cisco 7600 device.
Step 5 ![]() To view details about an event, highlight the event and right click on it.
To view details about an event, highlight the event and right click on it.
Step 6 ![]() To launch CMM to troubleshoot the event, right-click on the event and choose VAMS Tools > Launch CMM or VAMS Tools > Launch Flowtrace.
To launch CMM to troubleshoot the event, right-click on the event and choose VAMS Tools > Launch CMM or VAMS Tools > Launch Flowtrace.
Figure 6-38 shows the menu selections for launching CMM.
Figure 6-38 Launching CMM to Troubleshoot a VidMon Event

The CMM login screen appears.
Step 7 ![]() Log in to CMM.
Log in to CMM.
The CMM Dashboard appears, shown in Figure 6-39.
Figure 6-39 CMM Dashboard Showing Video Flows
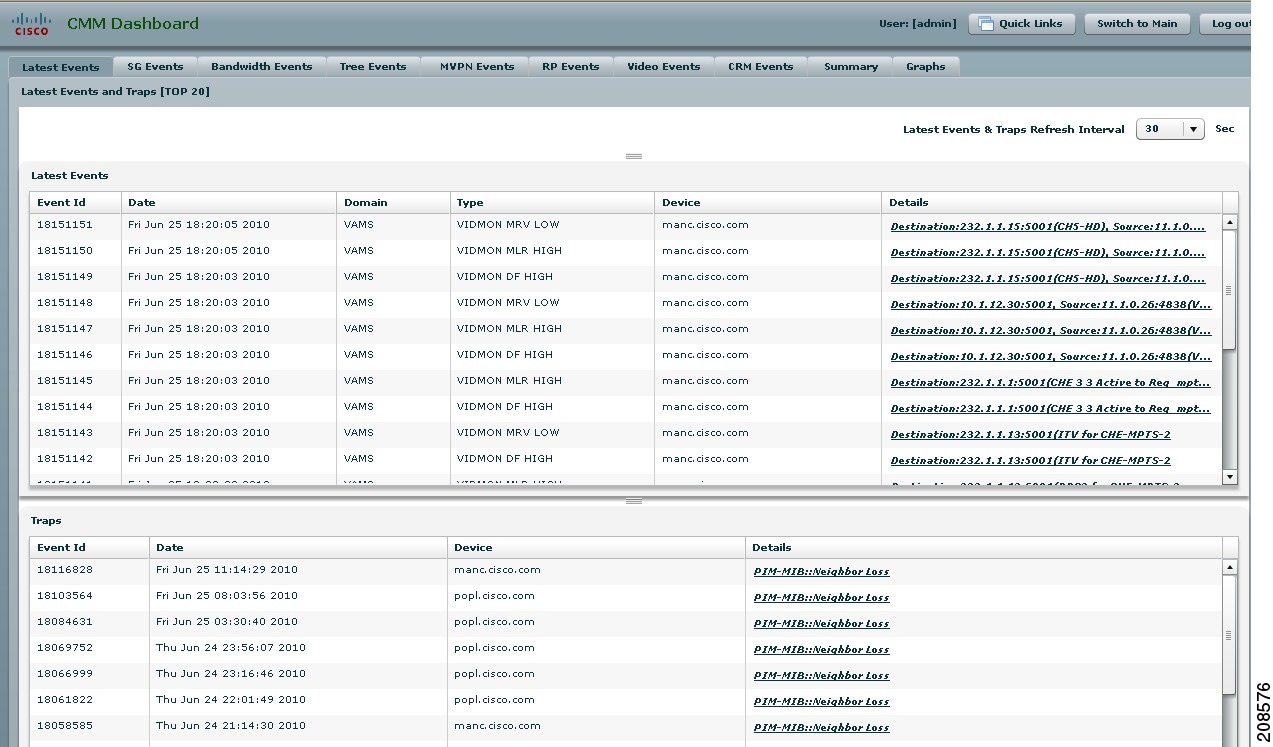
Step 8 ![]() From the CMM Dashboard:
From the CMM Dashboard:
•![]() To launch a trace for the flow, locate the entry for the fault indicated in the TIP/TBSM message, for example, the DF high event on BBC2, and then click on the underlined link for the flow.
To launch a trace for the flow, locate the entry for the fault indicated in the TIP/TBSM message, for example, the DF high event on BBC2, and then click on the underlined link for the flow.
•![]() To perform other troubleshooting tasks, click the Switch to Main button and then go to the appropriate CMM menu and task to perform a task.
To perform other troubleshooting tasks, click the Switch to Main button and then go to the appropriate CMM menu and task to perform a task.
If you click on a link to trace a flow, CMM launches a multicast trace for the flow and a multicast trace for the flow appears.
The top part of the Multicast Trace page presents a trace table, as shown in Figure 6-40. The bottom part of the page shows a topology map of the devices involved in the trace, as shown in Figure 6-40.
Figure 6-40 CMM Multicast Flow Trace: Trace Data Table
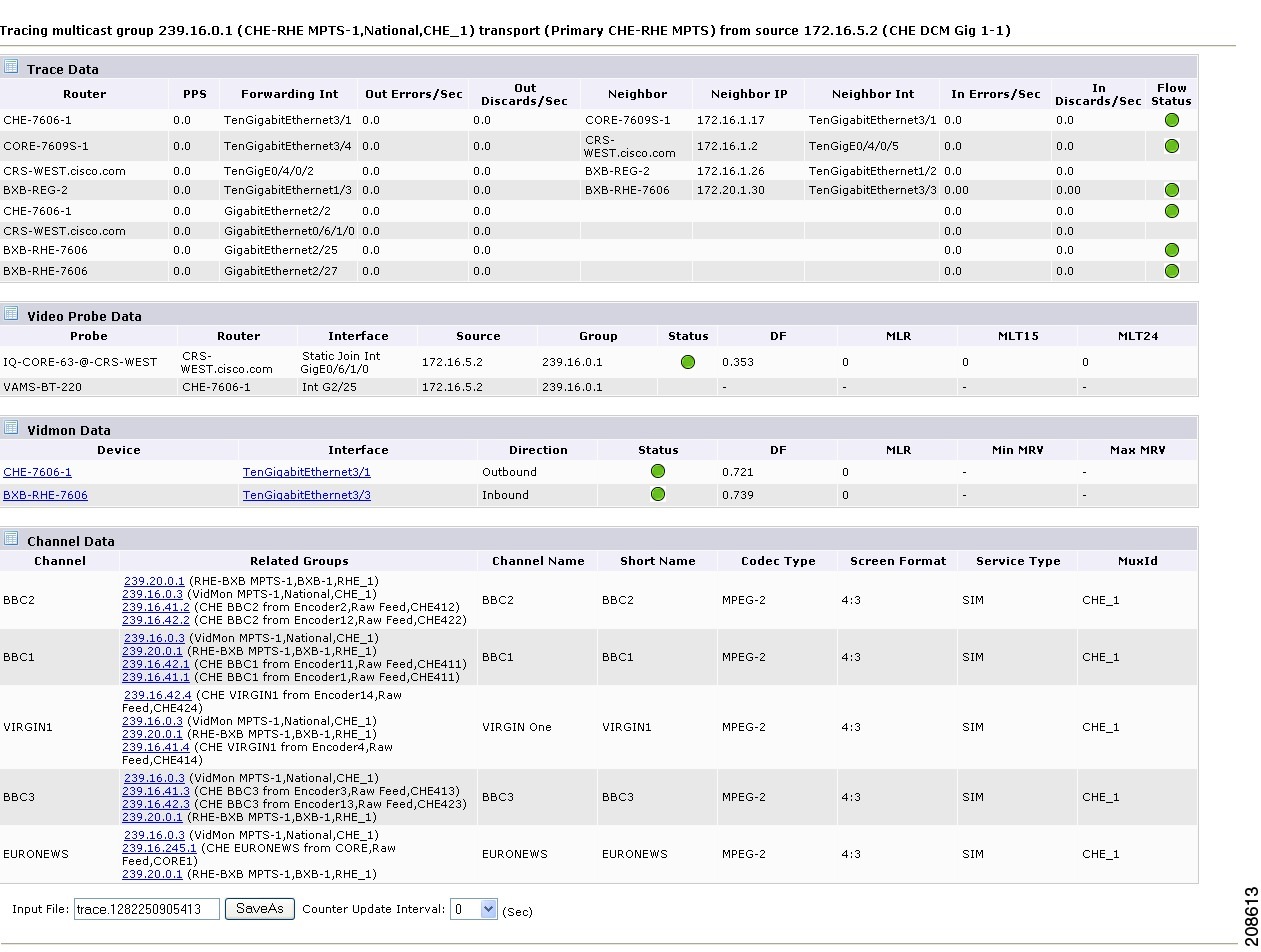
The trace data shown in Figure 6-40 shows the following information:
•![]() Flow Description—The flow description at the top of the page indicates the unicast Group, Channel Name, Transport Description, Source IP and Source description, as configured in the CMM for the flow.
Flow Description—The flow description at the top of the page indicates the unicast Group, Channel Name, Transport Description, Source IP and Source description, as configured in the CMM for the flow.
•![]() Trace Data Table—Lists the routers, interfaces, and PIM neighbors that transport the multicast flow.
Trace Data Table—Lists the routers, interfaces, and PIM neighbors that transport the multicast flow.
•![]() Video Probe Data Table—Lists all video probes known to CMM that are present on the distribution tree. This table shows the router/interface to which the probe is connected, and MDI metrics like DF and MLR.
Video Probe Data Table—Lists all video probes known to CMM that are present on the distribution tree. This table shows the router/interface to which the probe is connected, and MDI metrics like DF and MLR.
•![]() VidMon Data Table—Lists all the VidMon-enabled routers present in the distribution tree. The table includes the router, interface, direction, status, and VidMon metrics like DF, MLR, and MRV.
VidMon Data Table—Lists all the VidMon-enabled routers present in the distribution tree. The table includes the router, interface, direction, status, and VidMon metrics like DF, MLR, and MRV.
•![]() Channel Data Table—Displays the related multicast groups for each of the video channels carried in the traced multicast flow. The table shows the channels, related multicast groups for each channel, and additional video format information.
Channel Data Table—Displays the related multicast groups for each of the video channels carried in the traced multicast flow. The table shows the channels, related multicast groups for each channel, and additional video format information.
If any DF or MLR thresholds have been exceeded, The Vidmon data area indicates these with a red circle in the Status column. If the DF and MLR values are within the defined thresholds, the Status column shows green circles.
The bottom of the trace display shows a topology map of the devices involved in the flow, as shown in Figure 6-41.
Figure 6-41 CMM Multicast Flow Trace: Topology Map
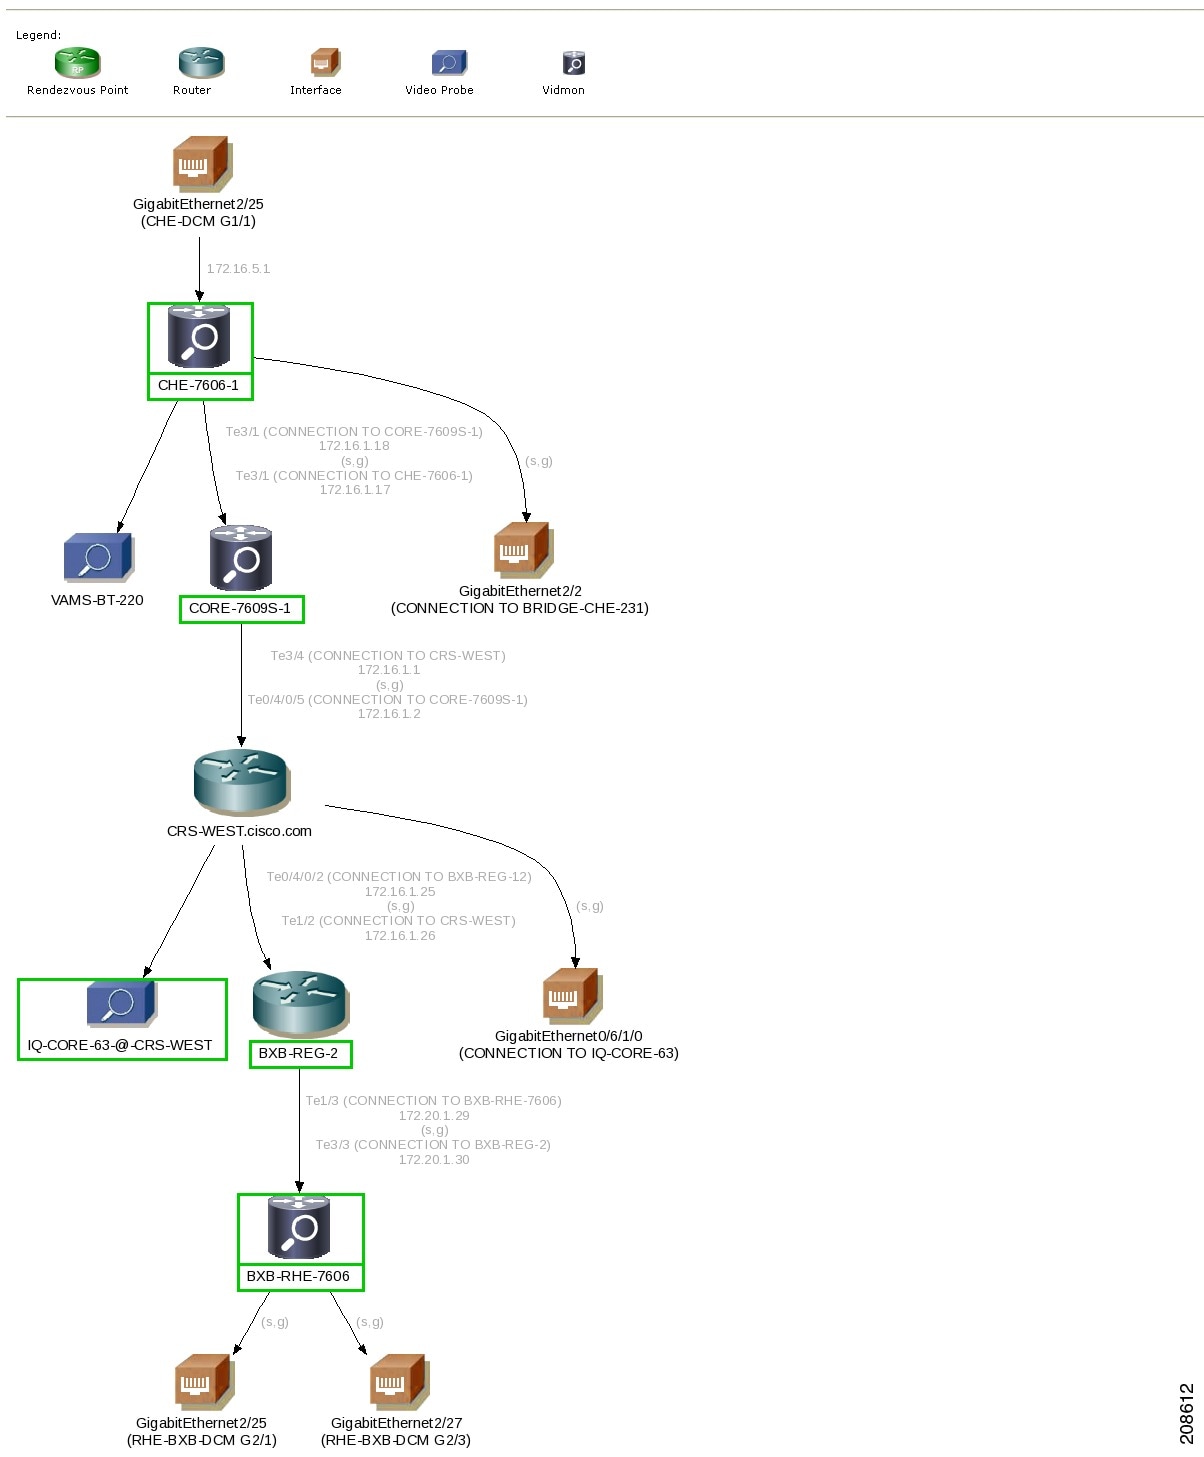
Viewing Events in the VidMon Event Views
To view custom VidMon event views:
Step 1 ![]() From the Video Assurance Management menu, click the plus sign (+) next to Video Assurance Management.
From the Video Assurance Management menu, click the plus sign (+) next to Video Assurance Management.
The Video Assurance Management menu appears.
Step 2 ![]() Click the plus sign (+) next to Video Fault.
Click the plus sign (+) next to Video Fault.
Step 3 ![]() Click VidMon Events.
Click VidMon Events.
The Events Views page for the VidMon events appears. Figure 6-42 shows the event views for Video Events.
Figure 6-42 VidMon Events Views
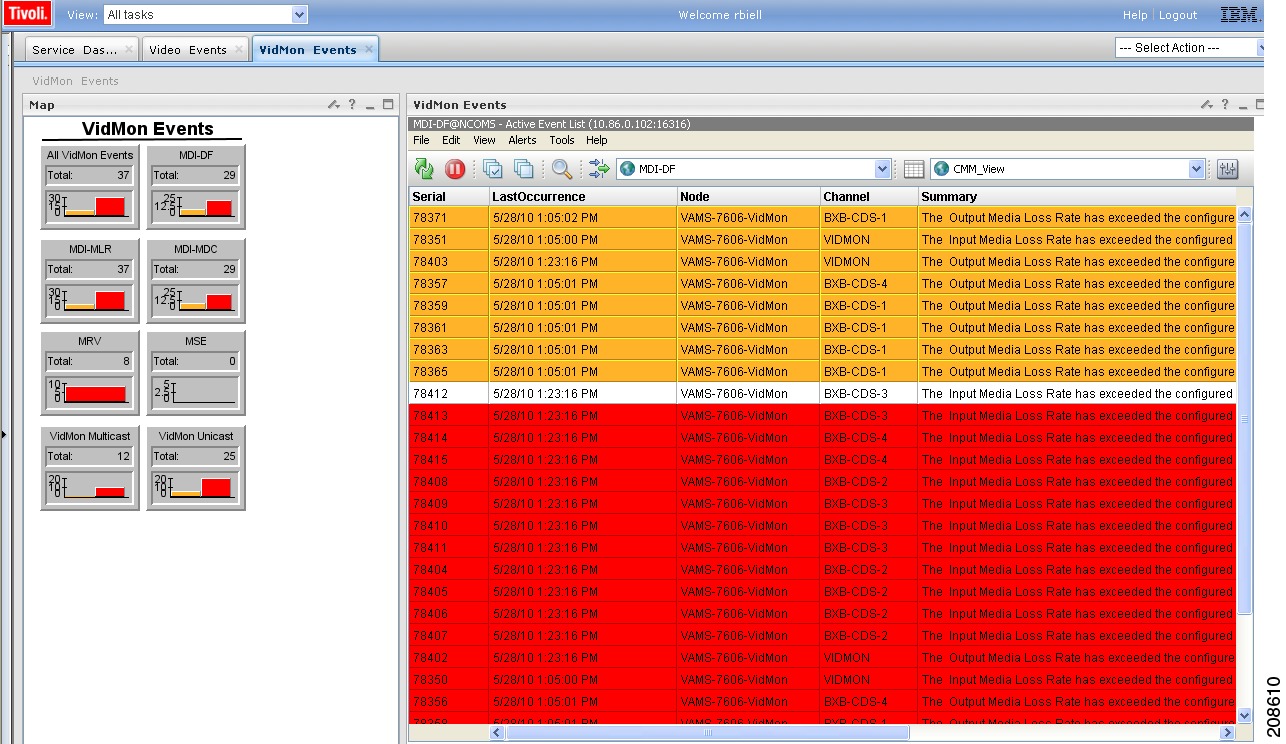
The left part of the display shows monitor boxes for the selected event type. Each monitor box shows a bar graph indicating the number events in each severity level for the event category.
The CMM Events views include:
•![]() All VidMon Events—Shows all VidMon events.
All VidMon Events—Shows all VidMon events.
•![]() MDI-DF—Shows Delay Factor (DF) events.
MDI-DF—Shows Delay Factor (DF) events.
•![]() MDI-MLR—Shows Media Loss Rate (MLR) events.
MDI-MLR—Shows Media Loss Rate (MLR) events.
•![]() MDI-MDC—Shows Media Discontinuity Counter (MDC) events.
MDI-MDC—Shows Media Discontinuity Counter (MDC) events.
•![]() MRV—Shows Media Rate Variation (MRV) events.
MRV—Shows Media Rate Variation (MRV) events.
•![]() MSE—Shows Media Stop Events (MSE).
MSE—Shows Media Stop Events (MSE).
•![]() VidMon Multicast—Shows VidMon events from multicast VidMon flows.
VidMon Multicast—Shows VidMon events from multicast VidMon flows.
•![]() VidMon Unicast—Shows VidMon events from unicast VidMon flows.
VidMon Unicast—Shows VidMon events from unicast VidMon flows.
Step 4 ![]() To see the events in a CMM event view, click the monitor box for the event class.
To see the events in a CMM event view, click the monitor box for the event class.
For example, click the monitor box for MDI-DF to see DF events.
Step 5 ![]() To view the details of an event, double-click on the row for the event.
To view the details of an event, double-click on the row for the event.
A table giving detailed field information for the event appears.
Step 6 ![]() To troubleshoot the event in CMM, right-click the event, and from the Alerts menu, choose VAMS Tools > Launch CMM or choose VAMS Tools > Launch Flowtrace.
To troubleshoot the event in CMM, right-click the event, and from the Alerts menu, choose VAMS Tools > Launch CMM or choose VAMS Tools > Launch Flowtrace.
Step 7 ![]() To view the details of an event, double-click on the row for the event.
To view the details of an event, double-click on the row for the event.
A table giving detailed field information for the event appears.
Monitoring Video Events
This section describes:
•![]() Monitoring Video Events in the Service Dashboard, page 6-38
Monitoring Video Events in the Service Dashboard, page 6-38
•![]() Viewing Events in the Video Events View, page 6-38
Viewing Events in the Video Events View, page 6-38
Monitoring Video Events in the Service Dashboard
To view video events in the service dashboard.
Step 1 ![]() On the Video Assurance Management menu, click Service Dashboard.
On the Video Assurance Management menu, click Service Dashboard.
The Service Dashboard appears:
The Service Tree shows a list of the configured video services in your network.
Step 2 ![]() Left-click on a a service on the Service Tree directory browser at the left of the page
Left-click on a a service on the Service Tree directory browser at the left of the page
•![]() The Service Viewer shows a service map for the elected service.
The Service Viewer shows a service map for the elected service.
•![]() The Service Details window shows an event list for the service.
The Service Details window shows an event list for the service.
The devices in the service topology are listed in the Service Tree directory.
Step 3 ![]() Click on a device or service component to see the service map for the device.
Click on a device or service component to see the service map for the device.
The Service Viewer shows a service map for the service. If there are faults, such as video alarms, the device is highlighted in red. In the event list in the Service Details area, fault events are highlighted in red.
Figure 6-36 shows the Service Tree, Service Viewer, and Service Details window for a service called MAX.
Figure 6-43 Service Dashboard for a High Level Service

Step 4 ![]() To see the devices associated with the selected video service, click on the plus sign (+) next to the service name.
To see the devices associated with the selected video service, click on the plus sign (+) next to the service name.
The devices in the service topology are listed in the Service Tree directory.
Step 5 ![]() Click on a device or service component, such as a channel associated with a video service, to see the service map for the device.
Click on a device or service component, such as a channel associated with a video service, to see the service map for the device.
The Service Viewer shows a service map for the device. If there are faults, such as VidMon alarms, the device is highlighted in red or in yellow. In the event list in the Service Details area, fault events are highlighted in red.
Figure 6-37 shows a Service Map and fault events for a channel called MAX-c, which is associated with the MAX service.
Figure 6-44 Viewing VidMon Events in the Service Dashboard

The event list shown in Figure 6-44 shows several video events from a BridgeTech video probe:
•![]() Video Probe Monitored Media Flow Lost—SNMP trap from video probe configured on CMM and forwarded by the MTTrapd probe, indicating that the media flow monitored by a BridgeTech video probe has been lost.
Video Probe Monitored Media Flow Lost—SNMP trap from video probe configured on CMM and forwarded by the MTTrapd probe, indicating that the media flow monitored by a BridgeTech video probe has been lost.
•![]() No Signal—SNMP event from the Copernicus MIB (ROSA NMS) indicating there is no signal on the channel.
No Signal—SNMP event from the Copernicus MIB (ROSA NMS) indicating there is no signal on the channel.
Step 6 ![]() To view details about an event, highlight the event and right click on it.
To view details about an event, highlight the event and right click on it.
Step 7 ![]() To launch CMM to troubleshoot the event, right click on the event and choose VAMS Tools > Launch CMM or VAMS Tools > Launch Flowtrace.
To launch CMM to troubleshoot the event, right click on the event and choose VAMS Tools > Launch CMM or VAMS Tools > Launch Flowtrace.
The CMM login screen appears.
Step 8 ![]() Log in to CMM and go to the appropriate menu to troubleshoot the event.
Log in to CMM and go to the appropriate menu to troubleshoot the event.
Viewing Events in the Video Events View
To view custom video event views:
Step 1 ![]() From the Video Assurance Management menu, click the plus sign (+) next to Video Assurance Management.
From the Video Assurance Management menu, click the plus sign (+) next to Video Assurance Management.
The Video Assurance Management menu appears.
Step 2 ![]() Click the plus sign (+) next to Video Fault.
Click the plus sign (+) next to Video Fault.
Step 3 ![]() Click Video Events.
Click Video Events.
The Events Views page for the VidMon events appears.Figure 6-45 shows the event views for Video Events.
Figure 6-45 Video Events Views
The left part of the display shows monitor boxes for the selected event type. Each monitor box shows a bar graph indicating the number events in each severity level for the event category.
The Video Events views include:
•![]() Critical Events—Includes events with a severity level of critical
Critical Events—Includes events with a severity level of critical
•![]() Last 24 Hours—Shows video events for the last 24 hours,
Last 24 Hours—Shows video events for the last 24 hours,
•![]() Cross Launch Events—Shows events indicating a video probe has been started.
Cross Launch Events—Shows events indicating a video probe has been started.
•![]() Probe Events—Shows events from video probes.
Probe Events—Shows events from video probes.
Step 4 ![]() To see the events in a video event view, click the monitor box for the event class.
To see the events in a video event view, click the monitor box for the event class.
For example, click the monitor box for Probe Events to see video probe events.
Step 5 ![]() To view the details of an event, double-click on the row for the event.
To view the details of an event, double-click on the row for the event.
A table giving detailed field information for the event appears.
Step 6 ![]() To troubleshoot the event in CMM, right-click the event, and from the Alerts menu, choose VAMS Tools > Launch CMM or choose VAMS Tools > Launch Flowtrace.
To troubleshoot the event in CMM, right-click the event, and from the Alerts menu, choose VAMS Tools > Launch CMM or choose VAMS Tools > Launch Flowtrace.
Step 7 ![]() To view the details of an event, double-click on the row for the event.
To view the details of an event, double-click on the row for the event.
A table giving detailed field information for the event appears.
Step 8 ![]() To view the details of an event, double-click on the row for the event.
To view the details of an event, double-click on the row for the event.
A table giving detailed field information for the event appears.
Viewing Network Fault Events
This section describes how to view network fault events.
Viewing Events in the ANA Event Views
Step 1 ![]() Log in to IBM TIP/TBSM.
Log in to IBM TIP/TBSM.
The main TBSM window appears.
Step 2 ![]() Click the plus sign (+) next to Video Assurance Management.
Click the plus sign (+) next to Video Assurance Management.
The Video Assurance Management menu appears.
Step 3 ![]() Click the plus sign (+) next to Network Fault.
Click the plus sign (+) next to Network Fault.
The Network Fault menu appears.
Step 4 ![]() Click ANA Events.
Click ANA Events.
The Events Views page for ANA events appears.
The left part of the display shows monitor boxes for the selected event type. Each monitor box shows a bar graph indicating the number events in each severity level for the event category.
The ANA Events views include:
•![]() All Events—Shows all ANA events.
All Events—Shows all ANA events.
•![]() ANA Tickets—Shows ANA tickets.
ANA Tickets—Shows ANA tickets.
•![]() Status Events—ANA status events.
Status Events—ANA status events.
Step 5 ![]() To see the events in a video event view, click the monitor box for the event class.
To see the events in a video event view, click the monitor box for the event class.
For example, click the monitor box for ANA Tickets to see ANA ticket events.
Step 6 ![]() To view the details of an event, double-click on the row for the event.
To view the details of an event, double-click on the row for the event.
A table giving detailed field information for the event appears.
Viewing All Events
Step 1 ![]() Log in to IBM TIP/TBSM.
Log in to IBM TIP/TBSM.
The main TBSM window appears.
Step 2 ![]() Click the plus sign (+) next to Video Assurance Management.
Click the plus sign (+) next to Video Assurance Management.
Step 3 ![]() Click the plus sign (+) next to Network Fault.
Click the plus sign (+) next to Network Fault.
The Network Fault menu appears.
Step 4 ![]() Click All Events.
Click All Events.
The Events Views page for all events appears. Figure 6-46 shows the event views for all events.
Figure 6-46 All Events Views
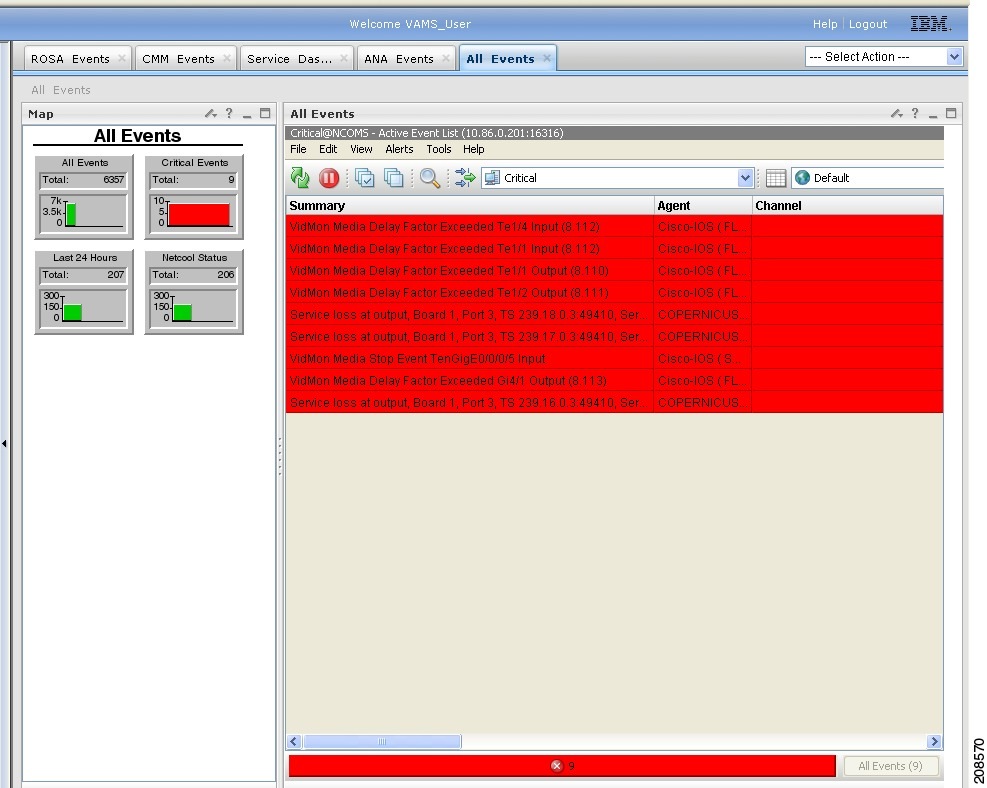
The left part of the display shows monitor boxes for the selected event type. Each monitor box shows a bar graph indicating the number events in each severity level for the event category.
The All Events views include:
•![]() All Events—Includes all network events.
All Events—Includes all network events.
•![]() Critical Events—Includes events with a severity level of critical.
Critical Events—Includes events with a severity level of critical.
•![]() Last 24 Hours—Shows network events for the last 24 hours,
Last 24 Hours—Shows network events for the last 24 hours,
•![]() Netcool Status—Shows Netcool Probewatch events, events indicating that a process has connected from a Netcool device, and so on.
Netcool Status—Shows Netcool Probewatch events, events indicating that a process has connected from a Netcool device, and so on.
Step 5 ![]() To see the events in a specific event view, click the monitor box for the event class.
To see the events in a specific event view, click the monitor box for the event class.
For example, click the monitor box for Netcool Status to see Netcool status events.
Step 6 ![]() To view the details of an event, double-click on the row for the event.
To view the details of an event, double-click on the row for the event.
A table giving detailed field information for the event appears.
Step 7 ![]() To troubleshoot the event in CMM, right-click the event, and from the Alerts menu, choose VAMS Tools > Launch CMM or choose VAMS Tools > Launch Flowtrace.
To troubleshoot the event in CMM, right-click the event, and from the Alerts menu, choose VAMS Tools > Launch CMM or choose VAMS Tools > Launch Flowtrace.
Step 8 ![]() To view the details of an event, double-click on the row for the event.
To view the details of an event, double-click on the row for the event.
A table giving detailed field information for the event appears.
Troubleshooting with Cisco ANA
Troubleshooting with Cisco ANA requires an understanding of the Cisco ANA fault-management system. You should also understand how to use ANA NetworkVision and ANA EventVision.
This section contains:
•![]() Fault Management, page 6-43
Fault Management, page 6-43
•![]() ANA NetworkVision, page 6-44
ANA NetworkVision, page 6-44
•![]() ANA EventVision, page 6-44
ANA EventVision, page 6-44
Fault Management
Table 6-2 highlights important aspects of the fault management system in Cisco ANA.
ANA NetworkVision
Network administrators use Cisco ANA NetworkVision to manage, fulfill, plan, and assure the integrity of network resources. Table 6-3 lists important aspects of using Cisco ANA NetworkVision for troubleshooting.
ANA EventVision
You use Cisco ANA EventVision to view, filter, and display the properties of specific events. Table 6-4 lists important aspects of using Cisco ANA EventVision for troubleshooting.
 Feedback