Diagnostics and Troubleshooting with the Multicast Manager Tool
Available Languages
Table Of Contents
Diagnostics and Troubleshooting with the Multicast Manager Tool
Viewing Detailed Multicast Information and Probe Topology
Diagnostics and Troubleshooting with the Multicast Manager Tool
This chapter contains the following sections:
Managing Diagnostics
The Diagnostics tool gives you a global view and a router-specific view of your network. The following sections describe global diagnostics:
The following section describes router-specific diagnostics:
Show All Groups
With the Show All Groups page, you can:
1.
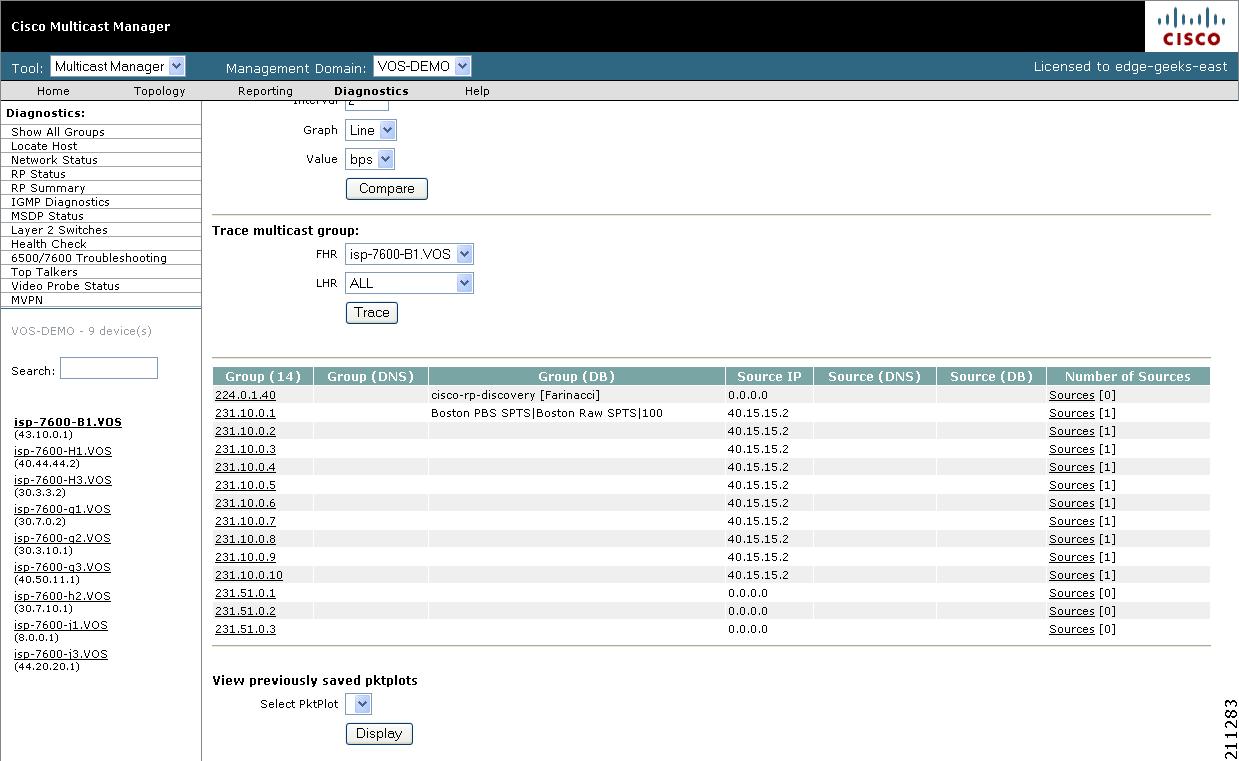
View all the active sources and groups in the network in tabular format. Groups are listed in numerical order, and the number of sources for each group appears in the last column. If there is more than one source for a group, select Sources to view them all.
2.
3.
4.
To use the Show All Groups page:
Step 1
The Multicast Diagnostics page appears, as shown in Figure 4-1.
Figure 4-1 Multicast Diagnostics Page
Step 2
Step 3
The Multicast Diagnostics page appears with the source and group selected.
Step 4
Step 5
•
•
•
•
•
To ensure a source is sending data, you can plot traffic over a period of time:
•
•

Note
•
•
•
•
Note
Step 6
•
•
•
Step 7
Step 8
Note
Figure 4-2 Drawing a Multicast Tree (Baseline)

Step 9
Step 10
Note
Step 11
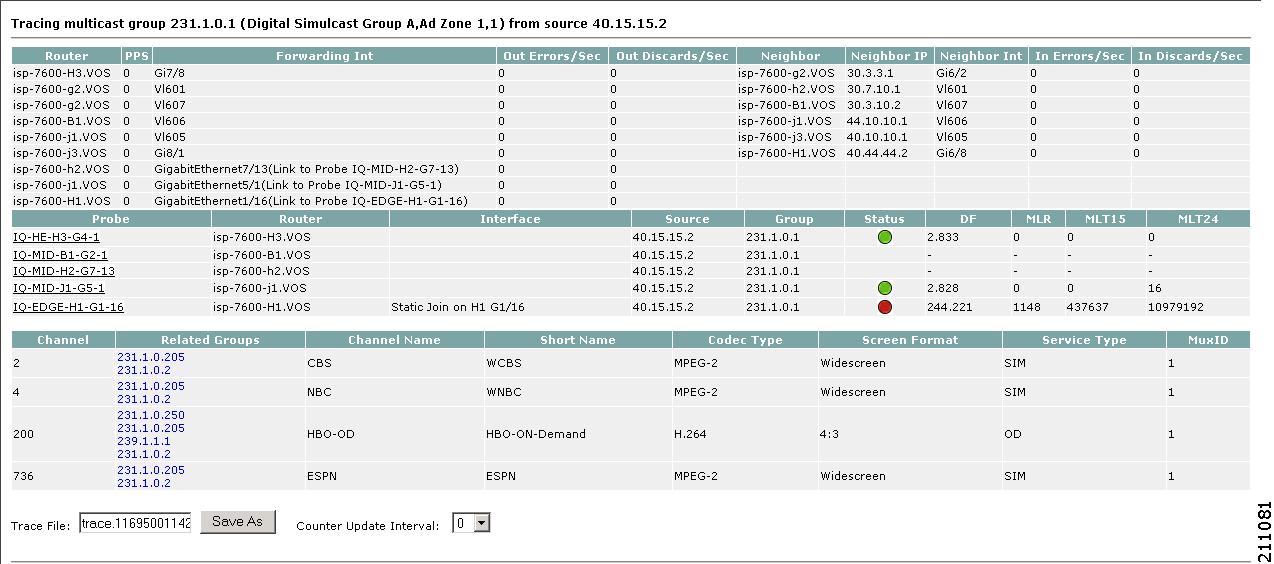
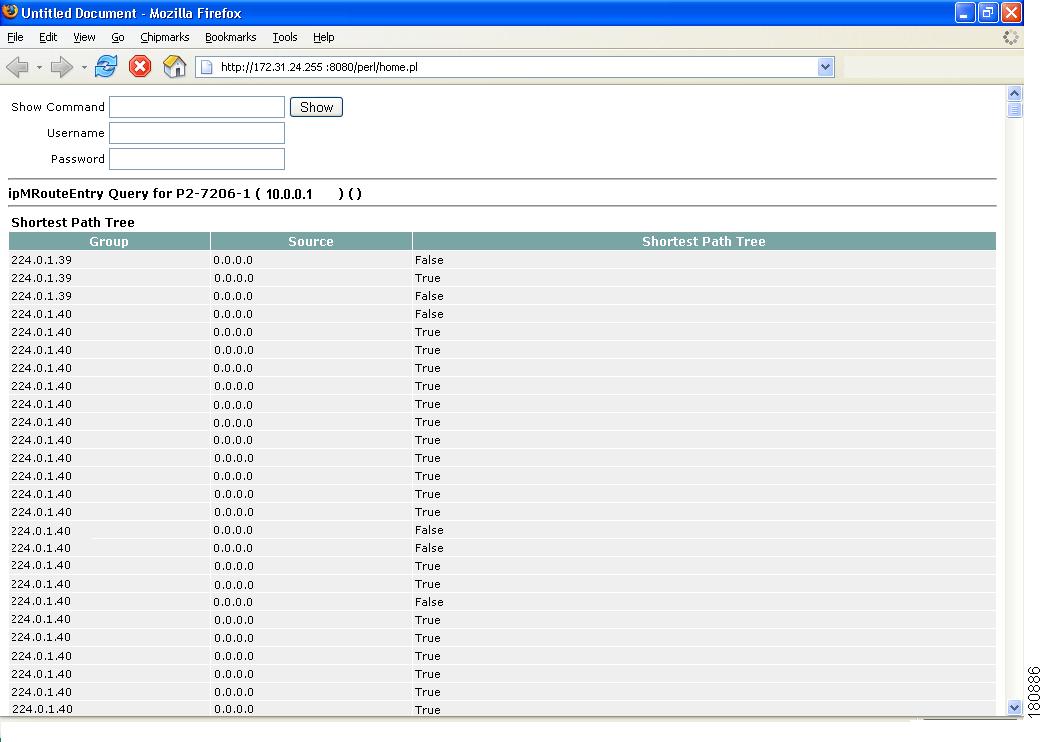
This opens another page that contains IP multicast routing information for the S,G that has been traced:
Figure 4-3 shows sample routing information.
Figure 4-3 Viewing IP Multicast Routing Information
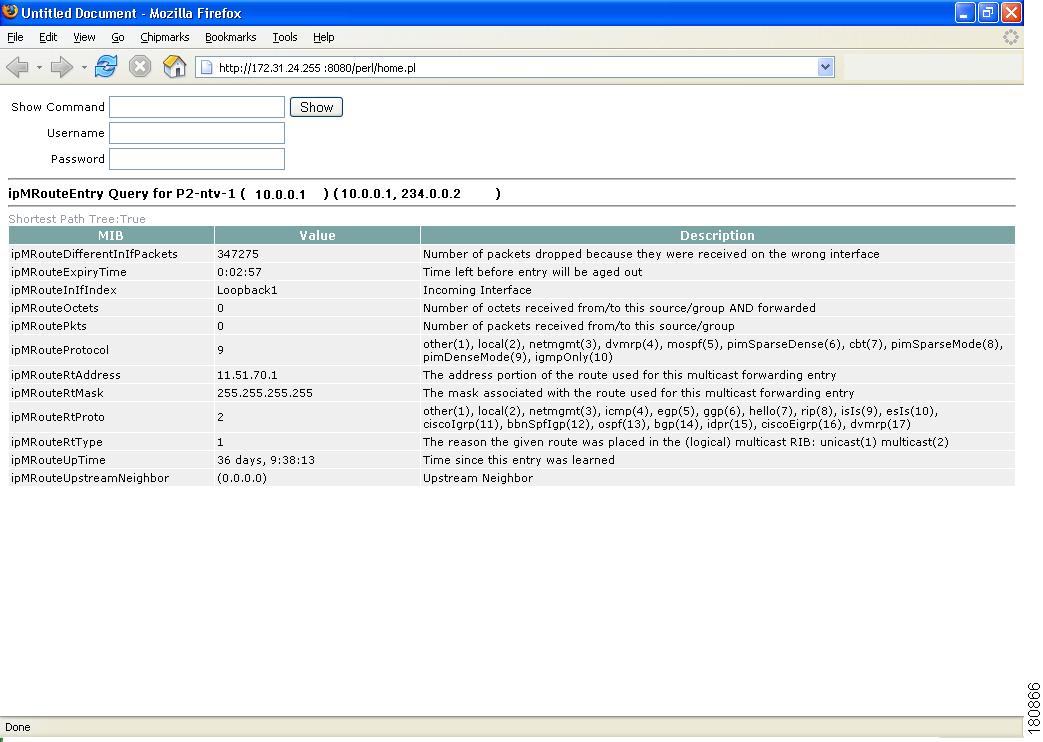
The trace information page contains these fields and selections:
•
•
•
•
•
•
Step 12
Figure 4-4 shows an example.
Figure 4-4 Multicast Diagnostics
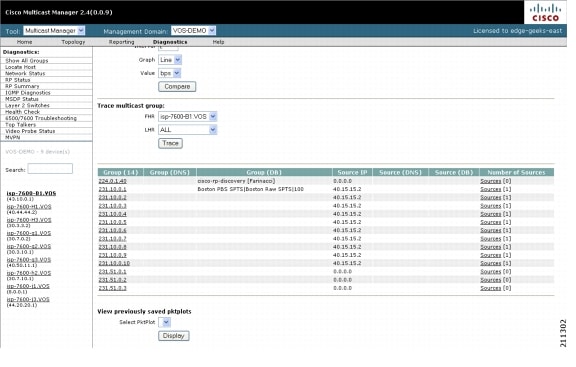
The example in Figure 4-4 shows the following information:
•
•
•
•
Note
•
•
Step 13
Step 14
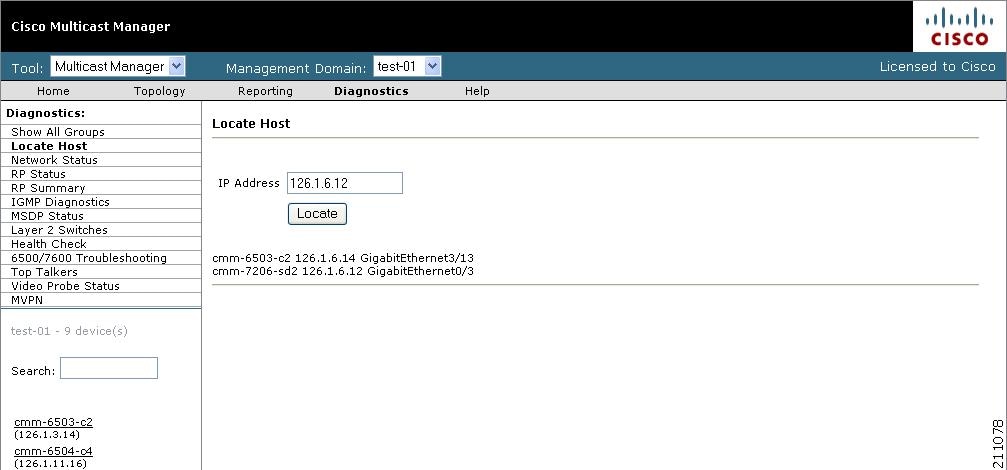
Locate Host
Using the Locate Host page, you can find sources and receivers in the network. Enter the IP Address or hostname (if DNS is configured) and click Locate.
Figure 4-5 shows the Locate Host page.
Figure 4-5 Locate Host Page
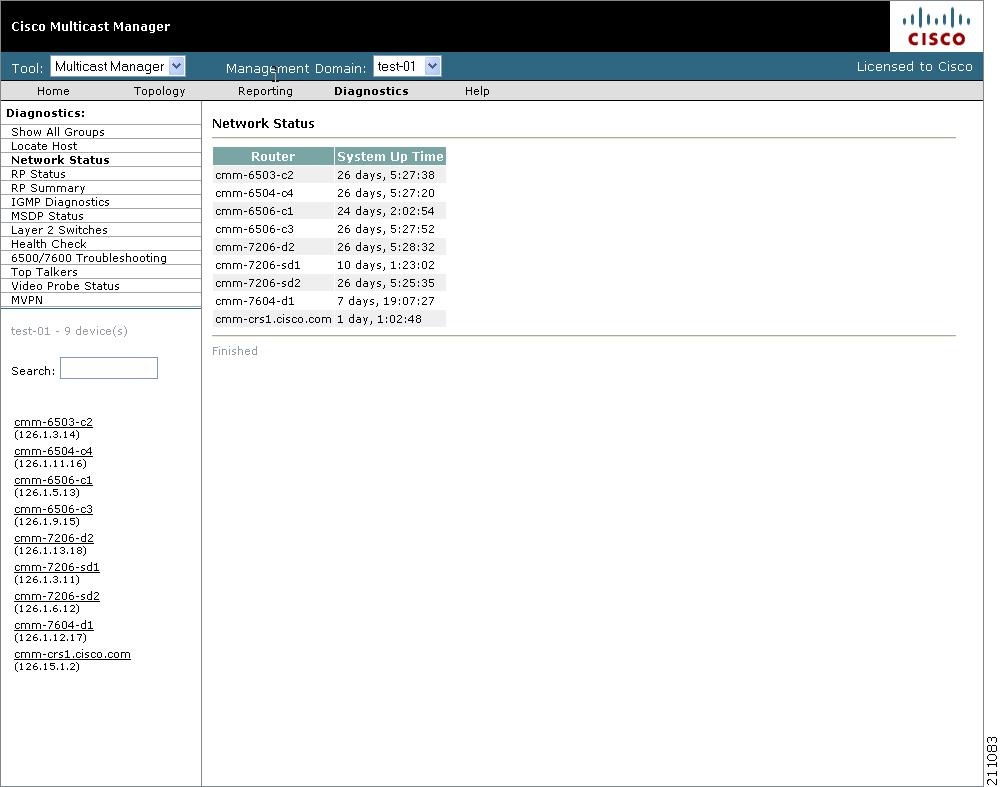
Network Status
Using the Network Status page, you can view the status of all devices in the current multicast domain. The System Up Time appears for all devices that are up. Devices that are down or unreachable appear in red.
Figure 4-6 shows the Network Status page.
Figure 4-6 Network Status
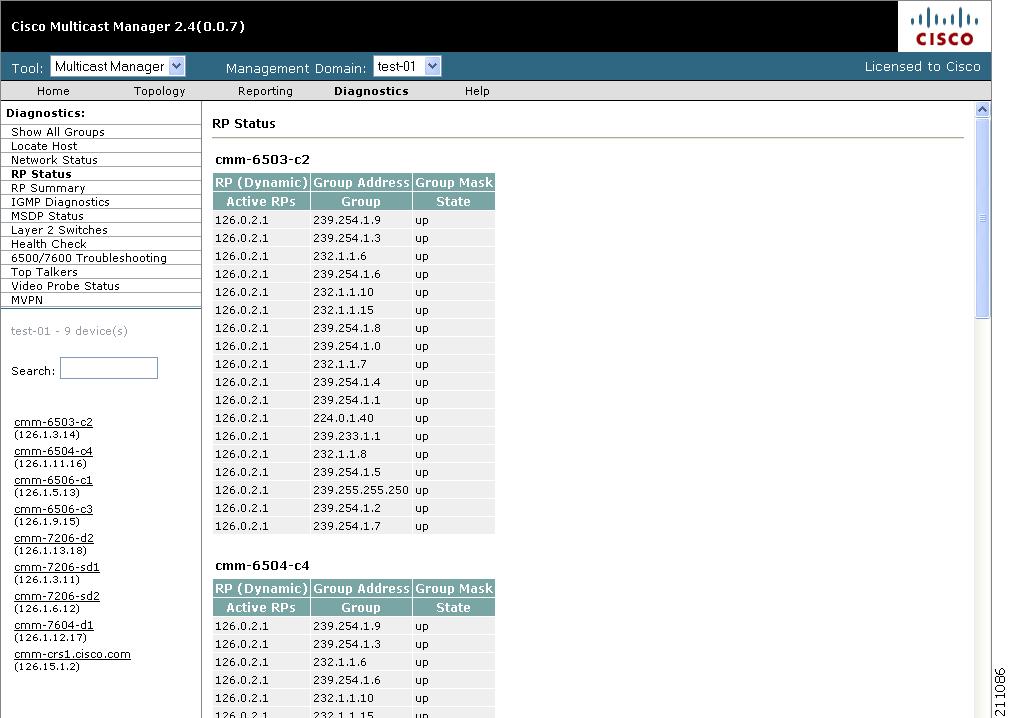
RP Status
Using the RP Status page, you can view all routers in the database, their RPs, and the active groups. In a large network with, many S,Gs, it may take some time for this data to appear, because each router in the multicast domain is queried.
Figure 4-7 shows the RP Status page.
Figure 4-7 RP Status Page
RP Summary
Using the RP Summary, you can view all the RPs that the CMM is aware of, based upon the discovery.
For details on clicking on an RP, see Viewing Topology, page 3-2.
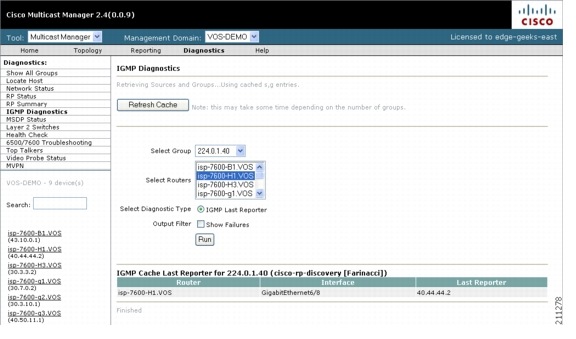
IGMP Diagnostics
Note
Using the IGMP Diagnostics page, you can see the interfaces that have joined onto a particular group:
Step 1
Step 2
Step 3
Step 4
Figure 4-8 shows the IGMP Diagnostics page.
Figure 4-8 IGMP Diagnostics Page
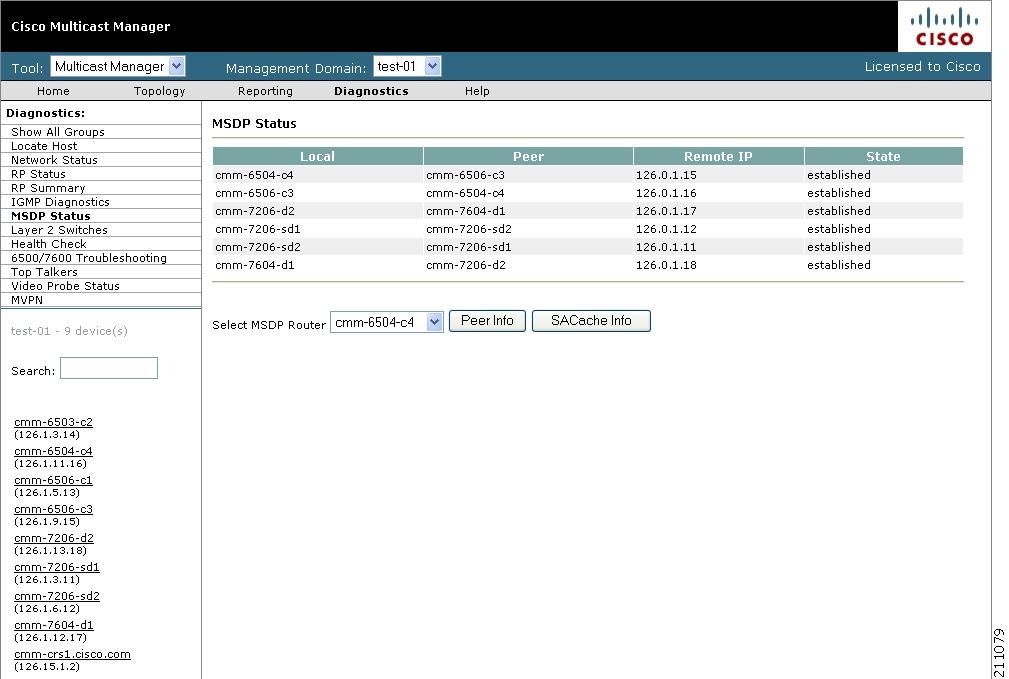
MSDP Status
Using the MSPD Status page, you can view all routers running MSDP and their peering connectivity. You can also view details for a specific router, such as peering information and the SA cache.
Note
To view peer information or SA cache information, select a router from the list and click the corresponding button.
Figure 4-9 shows the MSDP Status page.
Figure 4-9 MSDP Status Page
Layer 2 Switches
Using the Layer 2 Switches pages, you can view:
•
•
Note
To view Layer 2 multicast information or host IPs:
Step 1
Step 2
Step 3
Step 4
A display of L2 Multicast information appears. The possible IP addresses that can be mapped to the MAC address are also shown.
Health Check
Using the Health Check page, you can run a health check on a domain. To run a health check, select it from the list, and click Run.
Figure 4-10 shows a sample health check display.
Figure 4-10 Health Check
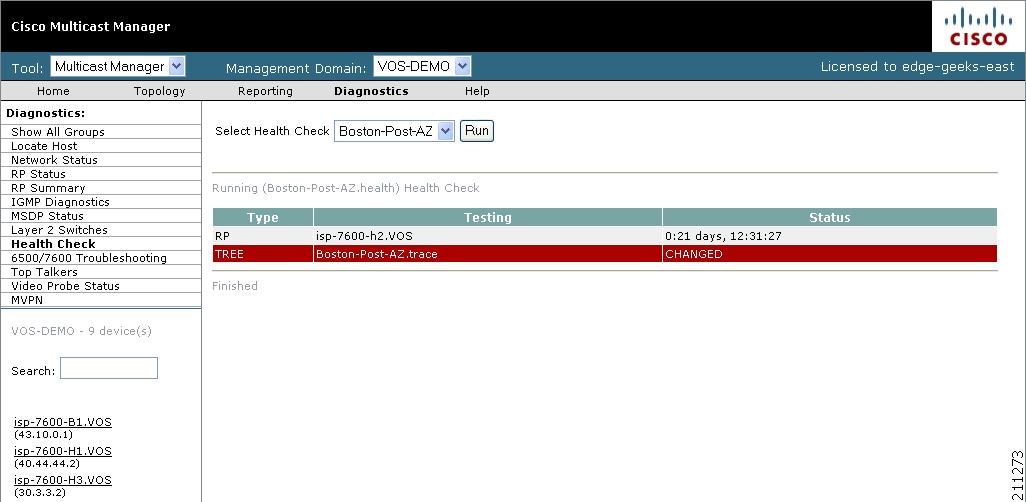
The color of the displayed text on the Health Check display indicates the status of the monitored condition:
•
•
•
6500/7600 Troubleshooting
Using the 6500/7600 Troubleshooting page, you can enable the CMM to gather accurate packet forwarding statistics and other information in a timely manner. This option initiates a remote login session into the PFC. A persistent Telnet session issues show commands and displays live statistics. These sessions are terminated when the windows are closed.

Tip
Figure 4-11 shows the 6500/7600 Troubleshooting diagnostics page.
Figure 4-11 6500/7600 Troubleshooting Page
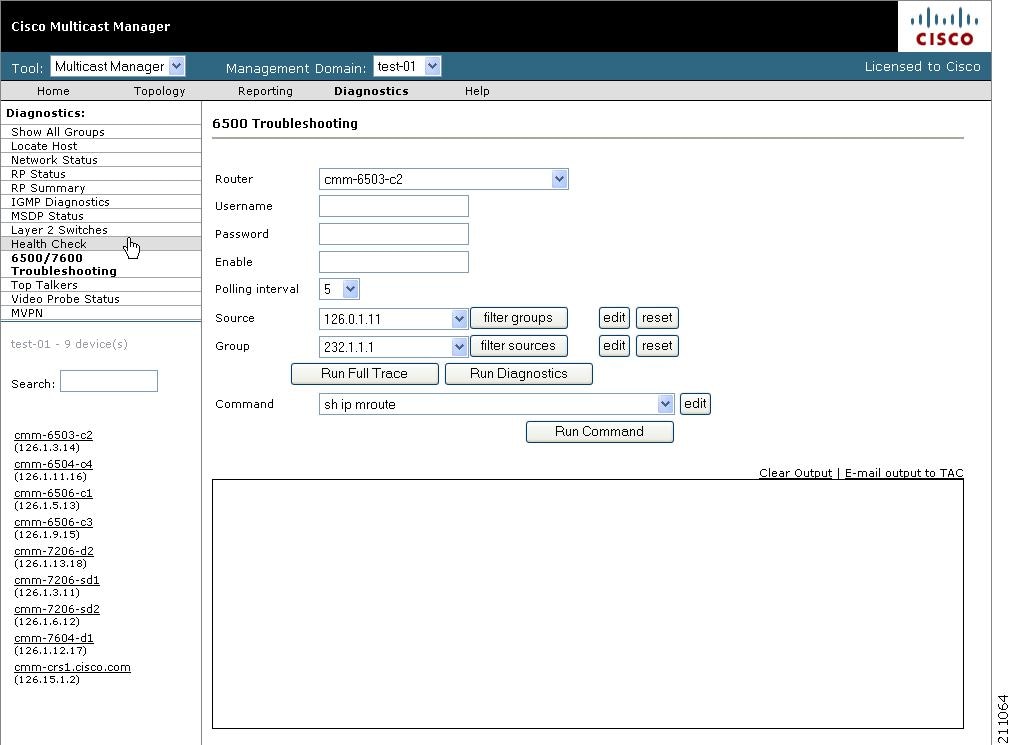
The 6500/7600 Troubleshooting page contains the following fields and buttons:
Router
Select a 6500 or 7600 router.
Username
Enter your username.
Password
Enter the MSFC password.
Enable
Enter the enable password.
Polling Interval
Interval at which the statistics are updated.
Source
IP address of the source.
Group
IP address of the group.
Edit
Lets you manually type in a group or source address.
Reset
Populates the source and group lists again.
Run Full Trace
Starts the tree at the source instead of the selected router. For details, see Show All Groups.
Run Diagnostics
Draws a graphical tree of the source and group selected, starting at the router selected. Live traffic statistics also appear for this source and group at this router. You can click any other router in the picture to see live packets statistics for them (see Show All Groups).
Ensure pop-up blockers are disabled.
Command
Provides a list of show commands.
Edit
Add your own command by clicking Edit, typing in your command, then click Run Command.
Run Command
Runs the selected show command. Output appears in the text box below.
Clear Output
Clears the output.
E-mail output to TAC
Emails the output to the Cisco TAC.
Note
When troubleshooting a problem, you can keep a record of the command output:
Step 1
Step 2
Step 3
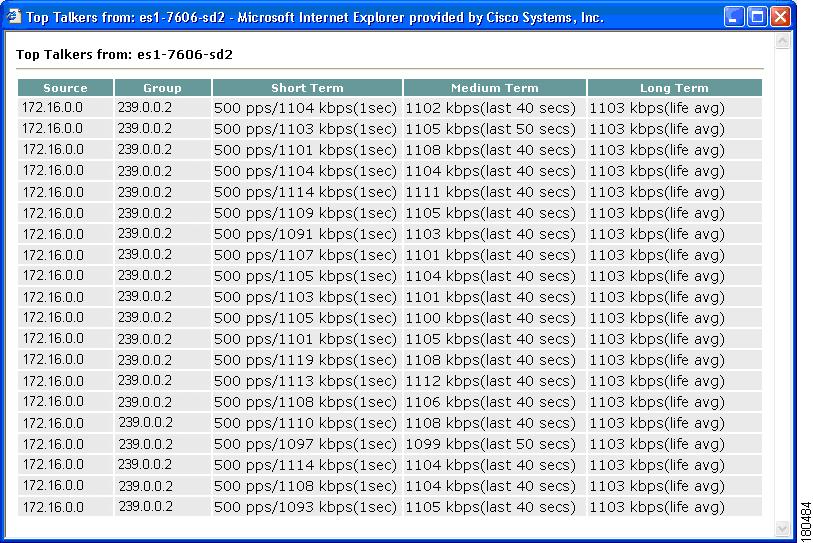
Top Talkers
Using the Top Talkers page, you can view the top 20 talkers, sorted by long term. The top 20 talkers are dynamically updated at every polling interval.
Step 1
Step 2
Step 3
Step 4
Figure 4-12 Top Talkers
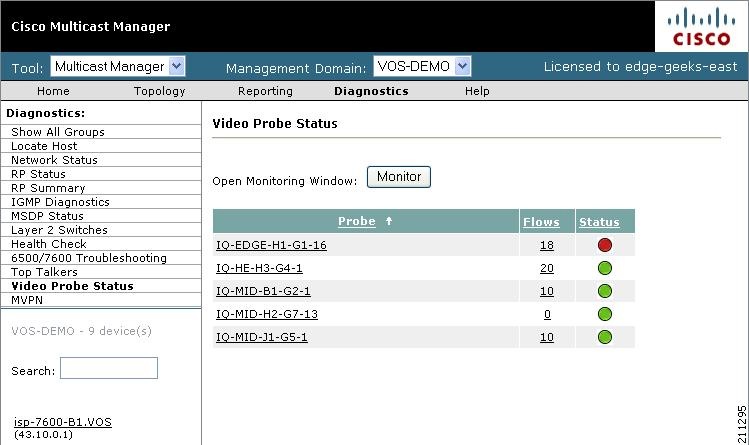
Video Probe Status
You can view diagnostic information about video probes and the flows that they are monitoring from the View Probe Status window.
View probe status shows you:
•
•
•
•
•
In addition, Cisco Multicast Manager draws a topology tree that shows:
•
•
•
•
•
To view video probe status:
Step 1
Step 2
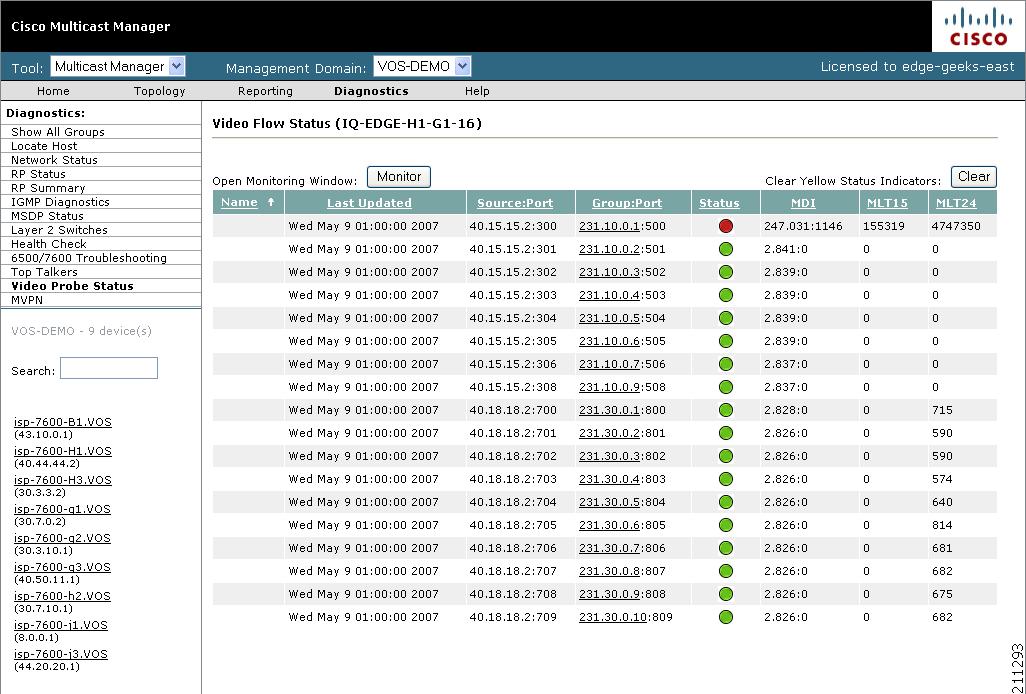
The Video Flow Status window appear, as shown in Figure 4-13. This window shows the probes that are currently configured and running, and indicates how many flows are being monitored and the status of the probe.
The probe status can be:
Green
Good
Yellow
A threshold was exceeded but the status in now normal
Red
Thresholds are currently being exceeded
Figure 4-13 Video Flow Status Window
Step 3
The Video Flow Status window appears, as shown in Figure 4-14, and indicates the status of the video flows.
Figure 4-14 Viewing Video Flow Status
Step 4
Viewing Detailed Multicast Information and Probe Topology
You can view a detailed trace about a video flow and a topology tree that shows the following:
•
•
•
•
To view a detailed flow trace and topology tree:
Step 1
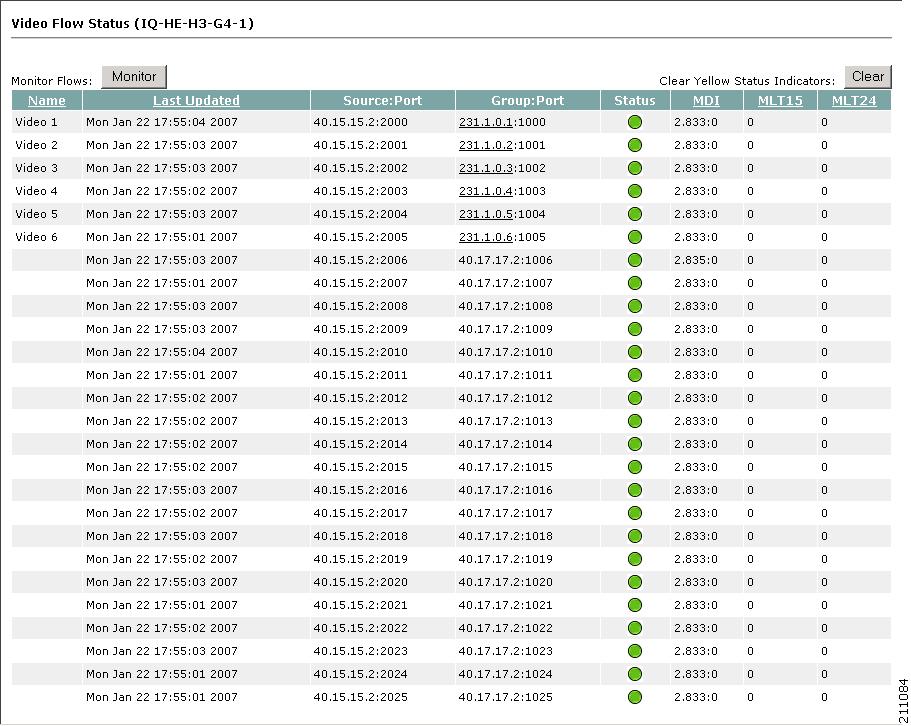
A message indicating the group and source that is being traced appears. The trace window includes a window with tables that show detailed information about the flow, as shown in Figure 4-15; and, Cisco Multicast Manager draws a topology tree for the flow, as shown in Figure 4-16.
Figure 4-15 Detailed Trace Table
The detailed flow trace table shows the following information:
The probe status table shows the following information:
The channel information table shows information about each channel used to transmit the flow:
Figure 4-16 shows a sample topology tree for the data that is shown in Figure 4-15.
Figure 4-16 Probe Topology Tree
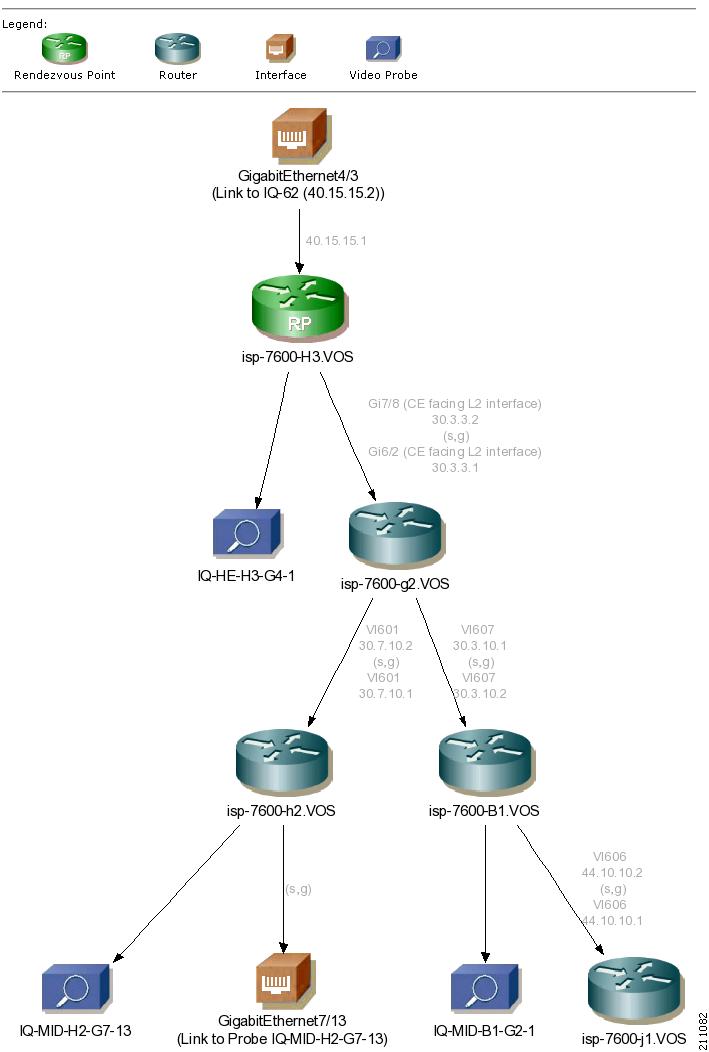
The topology tree shows a network diagram starting with the router that is linked to the interface that is multicasting the video stream. This is indicated by an interface icon.
Each router in the topology is shown by a router icon, each interface by an interface icon, and each probe by a probe icon.
Step 2
Cisco Multicast Manager displays the results of a route query for the router. See Figure 4-3 for a sample report.
Step 3
Step 4
Figure 4-17 Viewing Video Flow Status
MPVN Status
Using the Diagnostics tool, you can view detailed information about the status of Multicast VPNs, including:
•
•
•
To view MVPN status:
Step 1
The MVPN Diagnostics page appears, as shown in Figure 4-18.
Figure 4-18 MVPN Diagnostics Page
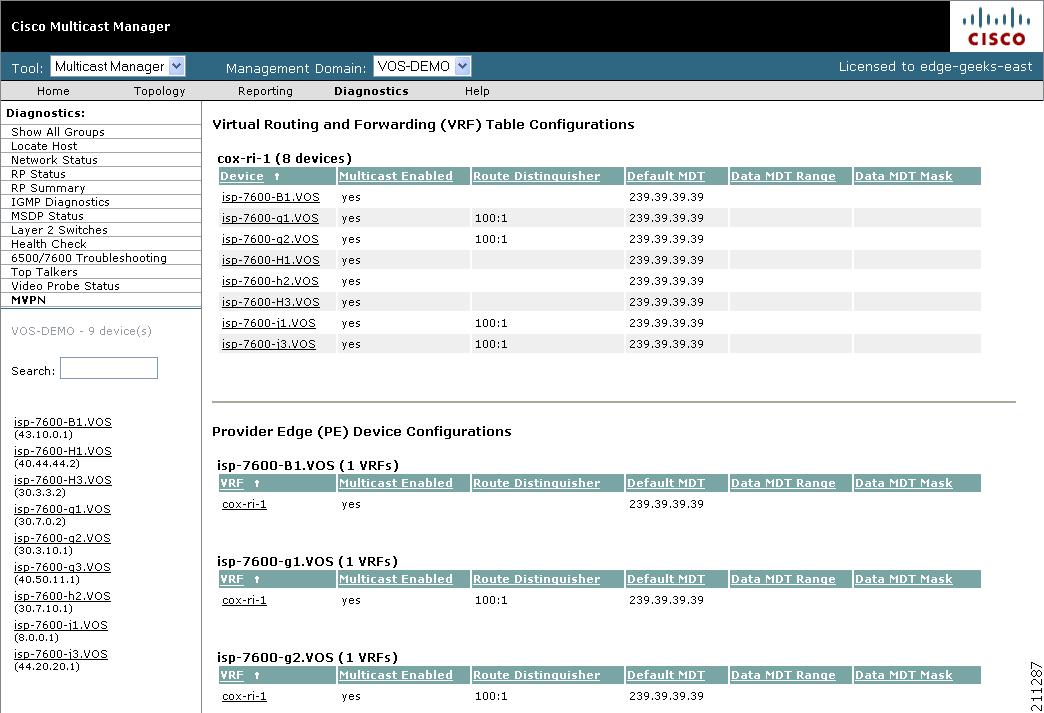
The MPVN Diagnostics page shows:
•
•
Step 2
Cisco Multicast Manager displays the status of the VRF, as shown in Figure 4-19.
Figure 4-19 Viewing VRF Status
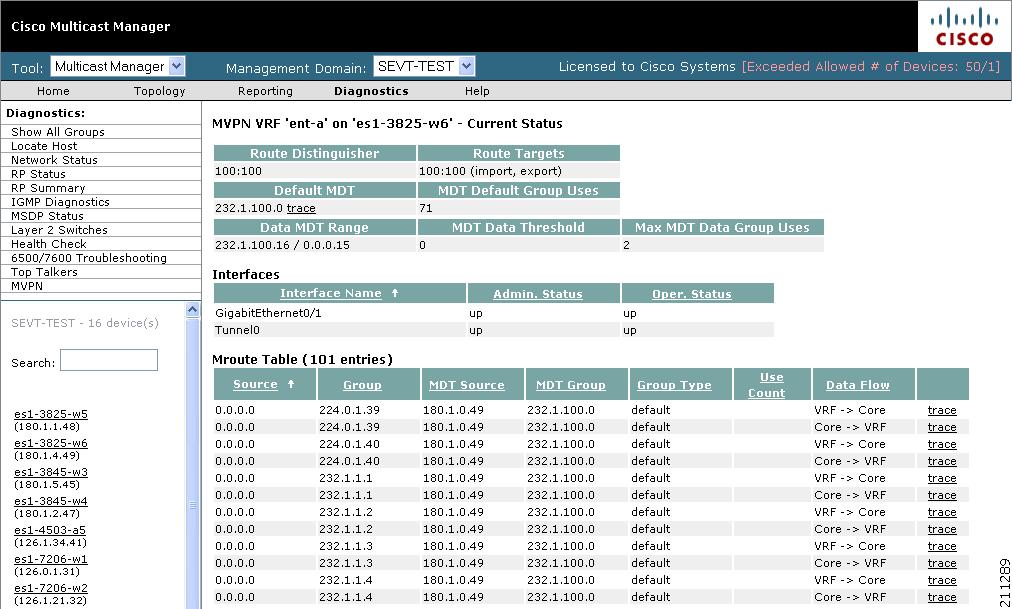
The VRF status page indicates:
•
•
•
•
•
•
•
For each interface in the VRF, the VRF status page indicates the interface name, administrative status, and operation status of the interface.
The bottom portion of the display shows an Mroute table for the VRF.
Step 3
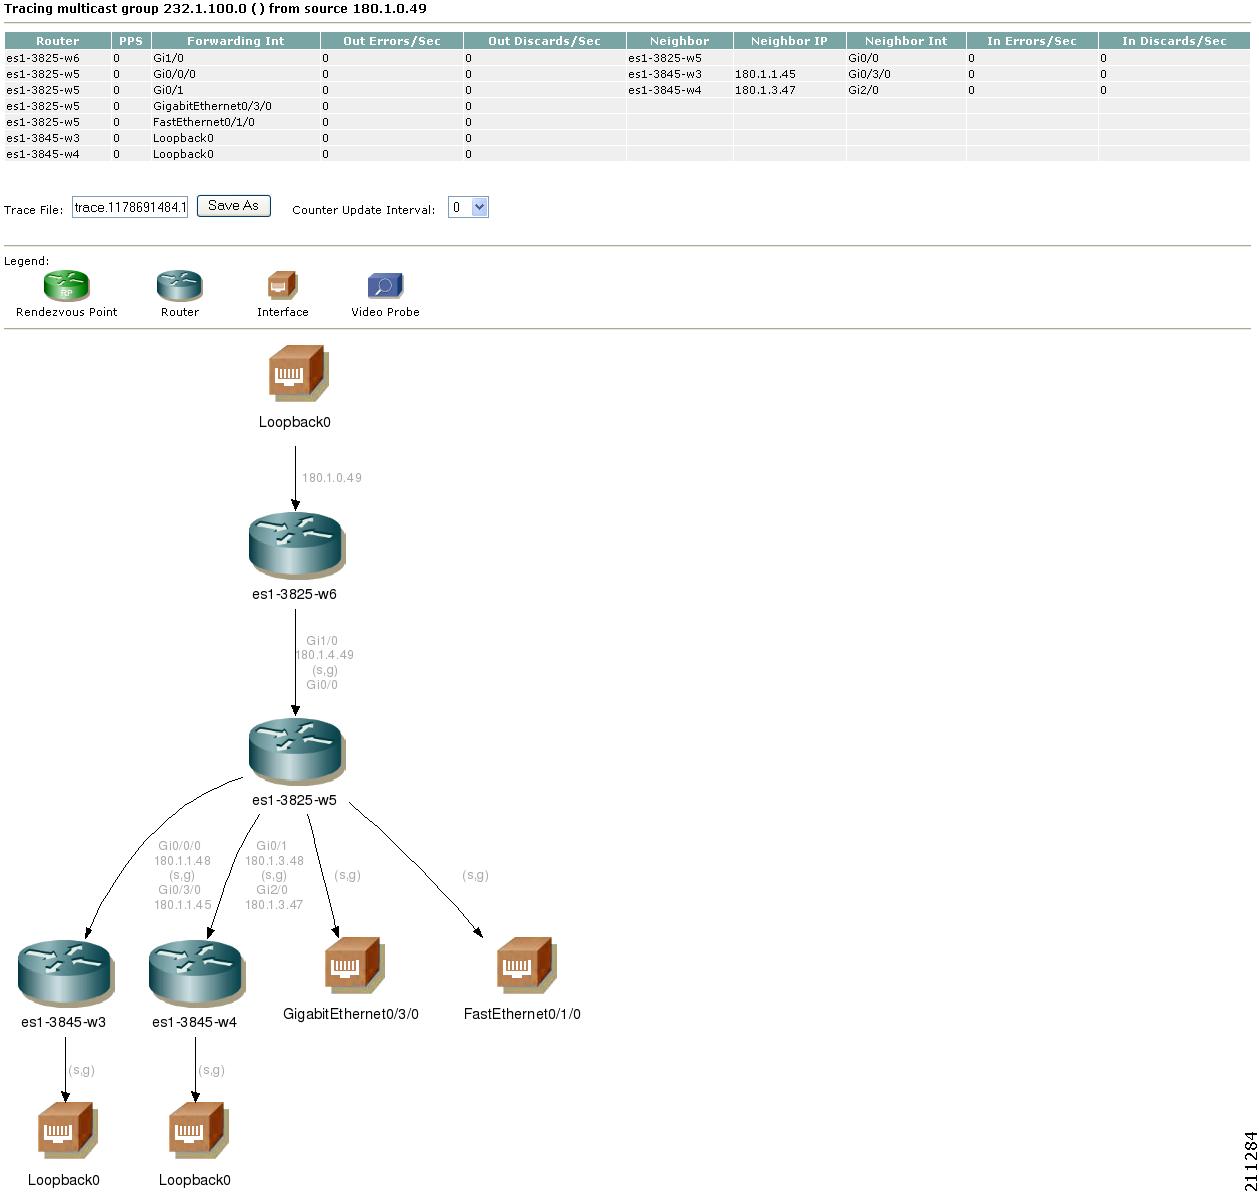
A detailed trace and a topology diagram of the multicast group appear, as shown in Figure 4-20.
Figure 4-20 Viewing a Multicast Group Trace
Step 4
Figure 4-21 shows a sample route entry query display.
Figure 4-21 Route Entry Query for a Router in a Multicast Group

Managing Router Diagnostics
You can view specific multicast diagnostics on a router by clicking the router in the lower left pane.
The Router Diagnostics page is similar to the Multicast Diagnostics page (under Show All Groups), except data is for the selected router only.
•
•
–
Figure 4-22 IGMP Cache Entries
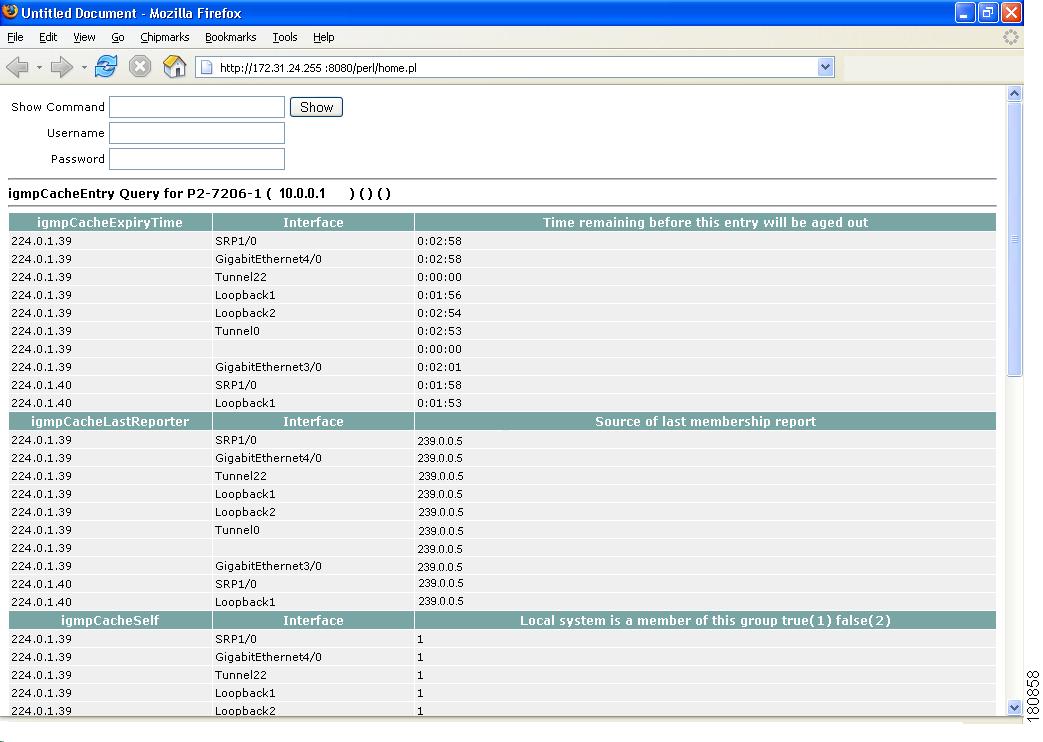
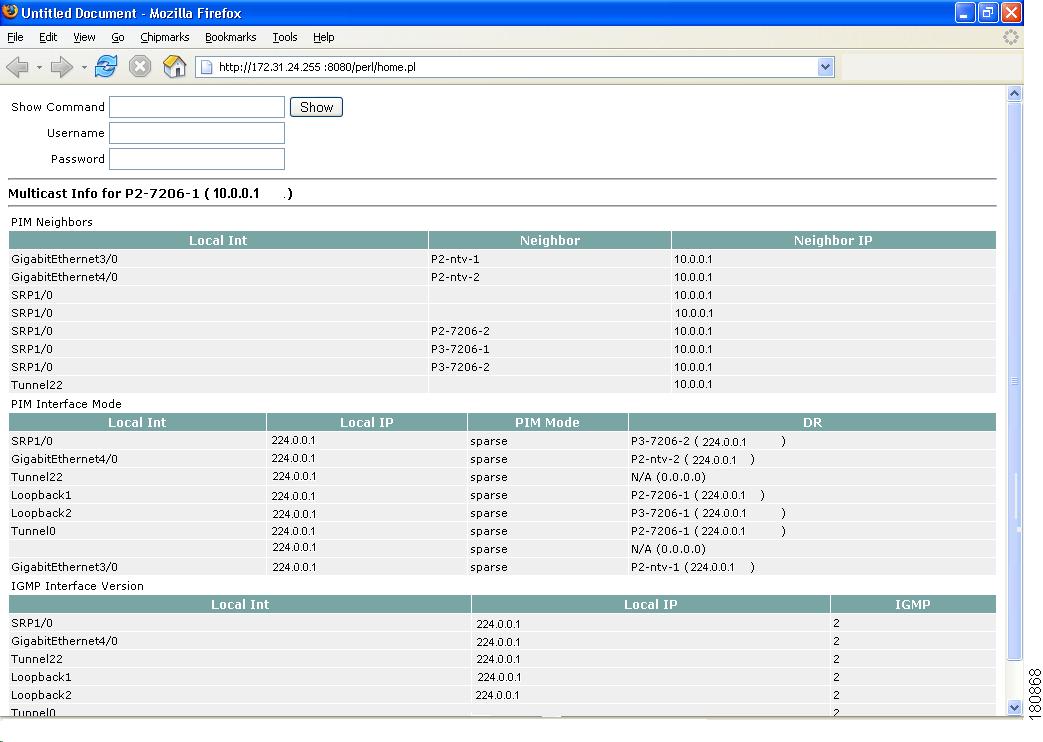
Figure 4-23 Multicast Information
–
–
Figure 4-24 Multicast Routing Table
–
Figure 4-25 PIM Neighbor Information

Viewing User Guide Help
To view a PDF version of the User Guide for Cisco Multicast Manager, 2.4, select Help.
 Feedback