Cisco Application Policy Infrastructure Controller Enterprise Module Configuration Guide, Release 1.2.x
Bias-Free Language
The documentation set for this product strives to use bias-free language. For the purposes of this documentation set, bias-free is defined as language that does not imply discrimination based on age, disability, gender, racial identity, ethnic identity, sexual orientation, socioeconomic status, and intersectionality. Exceptions may be present in the documentation due to language that is hardcoded in the user interfaces of the product software, language used based on RFP documentation, or language that is used by a referenced third-party product. Learn more about how Cisco is using Inclusive Language.
- Updated:
- May 25, 2016
Chapter: Performing Path Traces
Performing Path Traces
- About Path Trace
- Performing a Path Trace
- Performing an ACL-Based Path Trace
- Collecting Statistics During a Path Trace
- Understanding Path Trace Results
- Understanding the Statistics Retrieved During a Path Trace
- Understanding VRF Path Trace Results
- Understanding ACL Path Trace Results
About Path Trace
With Path Trace, the controller reviews and collects network topology and routing data from discovered devices. Then it uses this data to calculate a path between two hosts or Layer 3 interfaces.
Optionally, you can choose to collect interface, QoS, device, and Performance Monitor statistics for a path. You can use the information gathered through Path Trace to monitor and debug traffic paths that are distributed among the various devices throughout your network.
You perform these tasks by running a path trace between two nodes in your network. The two nodes can be a combination of wired or wireless hosts and/or Layer 3 interfaces. In addition, you can specify the protocol for the controller to use to establish the path trace connection, either TCP or UDP.
 Note | Path traces from the a router's loopback interface or a wireless controler's management interface are not supported. |
Note | For devices connected to a voice or video endpoint (for example, Cisco IP phones), you need to enable IP Device Tracking (IPDT) for these devices to discover voice/data VLAN information about the endpoints. For information, see IP Device Tracking Configuration. |
At every node in the path, the controller reports information about the device and path. For example, if a Layer 2 protocol is used to discover a node, the controller reports that the path is a switched path and labels it as Switched. If the controller detects load balancing decisions being made on a discovered device, it reports the path as an ECMP path and labels it as ECMP. Path trace can identify the following information about the devices and paths:
-
HSRP
-
SVI
-
Layer 2
-
Layer 2 Port Channel
-
Layer 3 Routing Protocol
-
ECMP/TR
-
Netflow
-
ECMP over SVI
-
Subinterface
-
EIGRP
-
Level 3 Recursive Loop
-
VRF
-
ACLs
For unknown devices within a path trace (usually non-Cisco devices), the controller calculates the path between the unknown devices starting from the last known Cisco device (from the Host Source IP) to the next, neighboring Cisco device (sometimes the Destination Source IP). The collected IP address data about the unknown device is then sent from this neighboring Cisco device to the controller to calculate the trace path. The unknown device is displayed in the controller's GUI as a question mark (?).
Note | In certain circumstances, a path trace may flow between one of two (or more) devices. To determine which device actually received the flow for the path trace, the controller reads the NetFlow configurations and records on the devices (if they exist). By reading this data from the devices, the controller can determine the likelihood of the actual path. |
Path Trace also supports unknown destinations, where the device is not managed by the Cisco APIC-EM but is reachable.
After the Cisco APIC-EM performs an initial scan, additional on-going network scans are performed at regular intervals every few minutes. Information captured during the on-going scans are displayed in the Devices table. Click Device Inventory in the navigation pane to view the Devices table. Each time the Cisco APIC-EM performs a scan, it also reads and records access control list, quality of service, and SPAN policy configuration information from the network.
Supported Network Environments
Note | If the controller can not complete a path trace for the selected hosts or interfaces, it displays the results of a partial trace. |
Supported Protocols, Network Connections, and Features
The following table describes the device protocols, network connections (physical, wireless, and virtual), and features that Path Trace supports.
Note | For detailed information about protocol, wireless connection, and feature support by platform and scenario, see the Supported Platforms for the Cisco Application Policy Infrastructure Controller Enterprise Module. |
Performing a Path Trace
You can perform a path trace between two nodes in your network. The two nodes may be two hosts and/or Layer 3 interfaces.
Note | The path trace application may display accuracy notes. Accuracy notes are red boxes that appears on a node or path segment indicating the accuracy of the computed path as a percentage. Place your cursor over the note to view suggestions of corrective actions to take to improve the path trace accuracy. For example, you may be prompted to enter port values and run the path trace again. |
Make sure that you have devices in your inventory. If not, discover devices using the Discovery function.
Ensure that the controller has SSH or Telnet access to the devices.
| Step 1 | In the Navigation pane, click Path Trace. | ||
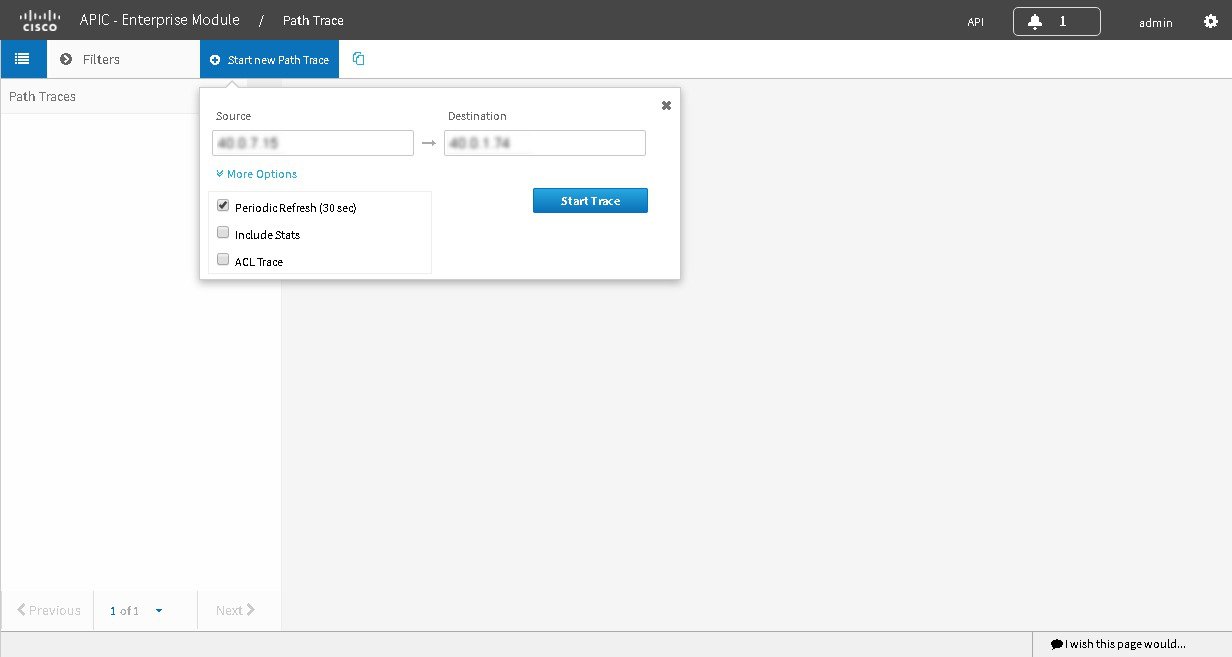
| Step 2 | From the path trace toolbar, click Start new Path Trace. | ||
| Step 3 | In the Source field,
enter the IP address of the host or the Layer 3 forwarding interface where you
want the trace to start.
If you enter the device IP address manually, you need to select the device from the list and then the interfaces for that device. | ||
| Step 4 | In the Destination field, enter the IP address of the host or Layer 3 forwarding interface where you want the trace to end. You can also enter an IP address of an unmanaged device (called an unknown destination).
If you enter the device IP address manually, you need to select the device from the list and then the interfaces for that device. | ||
| Step 5 | (Optional)To configure source and destination ports or protocols, click More Options. | ||
| Step 6 | (Optional)In the Source Port field, enter the port number of the host where you want the trace to end. | ||
| Step 7 | (Optional)In the Destination Port field, enter the port number of the host where you want the trace to end. | ||
| Step 8 | (Optional)In the Protocol field, choose tcp or udp from the drop-down menu for the Layer 4 path trace protocol. | ||
| Step 9 | (Optional)To configure the path trace to refresh every 30 seconds, check the Periodic Refresh (30 sec) check box. | ||
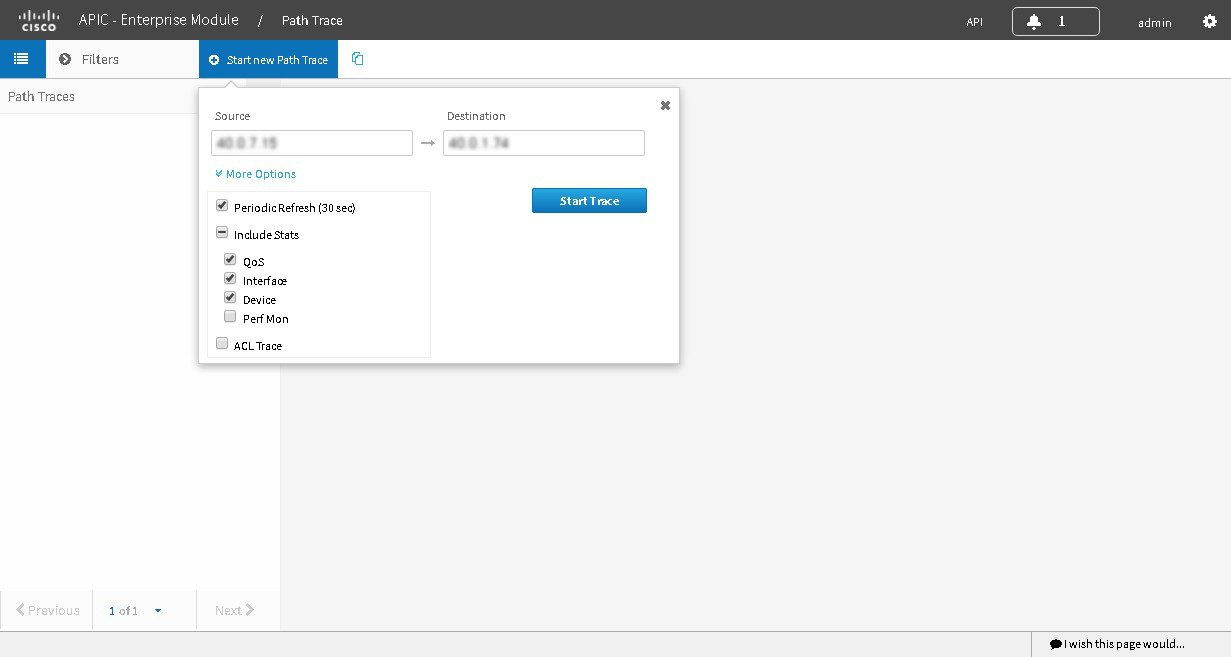
| Step 10 | (Optional)To configure the path trace
to collect additonal statistics, check the Stats check
box and any of the following check boxes, as desired:
| ||
| Step 11 | (Optional)Select the ACL Trace check box to run an ACL-based path trace. | ||
| Step 12 | Click Start Trace.
Review the path trace output. For more information, see Understanding Path Trace Results. | ||
| Step 13 | Unless you performed a path trace to an unknown destination, you can view the path trace in the Topology window. To do so, click View in Topology. The Topology
window opens in a new window with the path trace highlighted in your network.
For more information about the Topology window, see About Topology.
|
Performing an ACL-Based Path Trace
You can perform a path trace between two nodes in your network. The two nodes may be two hosts and/or Layer 3 interfaces.
Note | The path trace application may display accuracy notes. Accuracy notes are red boxes that appears on a node or path segment indicating the accuracy of the computed path as a percentage. Place your cursor over the note to view suggestions of corrective actions to take to improve the path trace accuracy. For example, you may be prompted to enter port values and run the path trace again. |
Make sure that you have devices in your inventory. If not, discover devices using the Discovery function.
Ensure that the controller has SSH or Telnet access to the devices.
| Step 1 | In the Navigation pane, click Path Trace. | ||
| Step 2 | From the path trace toolbar, click Start new Path Trace. | ||
| Step 3 | In the Source field, enter the IP address of the host
or the Layer 3 forwarding interface where you want the trace to start.
If you enter the device IP address manually, you need to select the device from the list and then the interfaces for that device. | ||
| Step 4 | In the Destination field, enter the IP address of the host or Layer 3 forwarding interface where you want the trace to end. You can also enter an IP address of an unmanaged device (called an unknown destination).
If you enter the device IP address manually, you need to select the device from the list and then the interfaces for that device. | ||
| Step 5 | (Optional)To configure source and destination ports or protocols, click More Options. | ||
| Step 6 | (Optional)In the Source Port field, enter the port number of the host where you want the trace to end. | ||
| Step 7 | (Optional)In the Destination Port field, enter the port number of the host where you want the trace to end. | ||
| Step 8 | (Optional)In the Protocol field, choose tcp or udp from the drop-down menu for the Layer 4 path trace protocol. | ||
| Step 9 | (Optional)To configure the path trace to refresh every 30 seconds, check the Periodic Refresh (30 sec) check box. | ||
| Step 10 | (Optional)To configure the path trace to collect additonal statistics, check the
Stats check box and any of the following check boxes,
as desired:
| ||
| Step 11 | Select the ACL Trace check box to run an ACL-based path trace. | ||
| Step 12 | Click Start Trace.
Review the path trace output. For more information, see Understanding ACL Path Trace Results. | ||
| Step 13 | Unless you performed a path trace to an unknown destination, you can view the path trace in the Topology window. To do so, click View in Topology. The Topology window opens with the path trace
highlighted in your network. For more information about the
Topology window, see About Topology.
|
Collecting Statistics During a Path Trace
You can perform a path trace between two nodes in your network and collect the following types of statistics about the path:
-
Quality of Service (QoS)
-
Interface
-
Device
-
Performance Monitor (If you choose to run a path trace to collect Perf Mon statistics, the Cisco APIC-EM configures all of the devices in the requested path with the necessary flow monitor configuration. For information about this configuration, see Performance Monitor Configuration.)
Note | The path trace application may display accuracy notes. Accuracy notes are red boxes that appears on a node or path segment indicating the accuracy of the computed path as a percentage. Place your cursor over the note to view suggestions of corrective actions to take to improve the path trace accuracy. For example, you may be prompted to enter port values and run the path trace again. |
Make sure that you have devices in your inventory. If not, discover devices using the Discovery function.
| Step 1 | In the Navigation pane, click Path Trace. | ||
| Step 2 | From the path trace toolbar, click Start new Path Trace. | ||
| Step 3 | In the Source field, enter the IP address of the host or the Layer 3 forwarding interface where you want the trace to start. | ||
| Step 4 | In the Destination field, enter the IP address of the host or Layer 3 forwarding interface where you want the trace to end. | ||
| Step 5 | (Optional)To configure source and destination ports or protocols, click More Options. | ||
| Step 6 | (Optional)In the Source Port field, enter the port number of the host where you want the trace to start. | ||
| Step 7 | (Optional)In the Destination Port field, enter the port number of the host where you want the trace to end. | ||
| Step 8 | (Optional)In the Protocol field, choose either tcp or udp from the drop-down menu for the Layer 4 path trace protocol. | ||
| Step 9 | (Optional)To configure the path trace to refresh every 30 seconds, check the Periodic Refresh (30 sec) check box. | ||
| Step 10 | Check the Stats check box. | ||
| Step 11 | Check any of the following check boxes corresponding to the type of statistics that will be collected:
| ||
| Step 12 | Click Start Trace.
The results are displayed in the Trace Results Device Details pane. For information, see the following topics: | ||
| Step 13 | (Optional)To view the path trace in the
Topology window. Click View in
Topology.
The Topology window opens with the path trace highlighted in your network.
For more information about the Topology window, see About Topology. |
Understanding Path Trace Results
After you run a path trace, the results are displayed in the Path Trace window.
Path Trace Toolbar
The Path Trace Toolbar provides the following options and information:
-
Filters—Allows you to search for path traces by source or destination IP address, source or destination ports, protocol, creation date, or statistics gathered (QoS, Device, Interface, Perf Mon, and ACL trace)
-
Start new Path Trace—Displays a dialog box where you can define the parameters for your path trace.
-
Copy icon—Allows you to create a new path trace using the perameters that are defined in the selected (source) path trace. You can keep any of the values from the source path trace and change, add, or deselect any parameters for the new path trace.
Path Traces Pane
The Path Traces pane lists the path traces in one of three categories:
-
IN PROGRESS— Path is currently being calculated. No results to show yet.
-
ACTIVE—A path has been calculated and will be refreshed every 30 seconds. Statistics may also be collected periodically.
-
COMPLETED—The path has been calculated one time and is not being refreshed. However, statistics may still be collected periodically.
Trace Results Toolbar
At the top of the Trace Results Graphical Display pane, the toolbar provides buttons for adjusting the path trace display.
|
Name 1 |
Description |
||
|---|---|---|---|
|
View Small |
Minimizes the trace results to view the details better. |
||
|
Reverse |
Displays the trace results from the host destination IP to the host source IP. The reverse path trace graphic is displayed directly below the original path trace. The reverse path trace details are displayed to the right of the original path trace details.
|
||
|
Scroll Lock |
Locks the scrolling of the path trace and reverse path trace details windows. (Available when Show Reverse is enabled.) |
||
|
Show Duplicate Devices |
Displays or hides duplicate devices within a path trace. |
||
|
ACL Trace checkbox 2 |
Displays an icon at each device or interface that indicates whether any ACLs are blocking traffic on the path. |
||
|
Stats |
If statistics were collected for the trace, you can select one or more of the interface, QoS, device, and performance monitor check boxes to display the corresponding information in the graphical display. |
||
|
View in Topology |
Opens the Topology window and highlights the path trace results in your network topology. If you performed a path trace to an unknown destination, this option is not available. For more information about using the Topology window, see About Topology. |
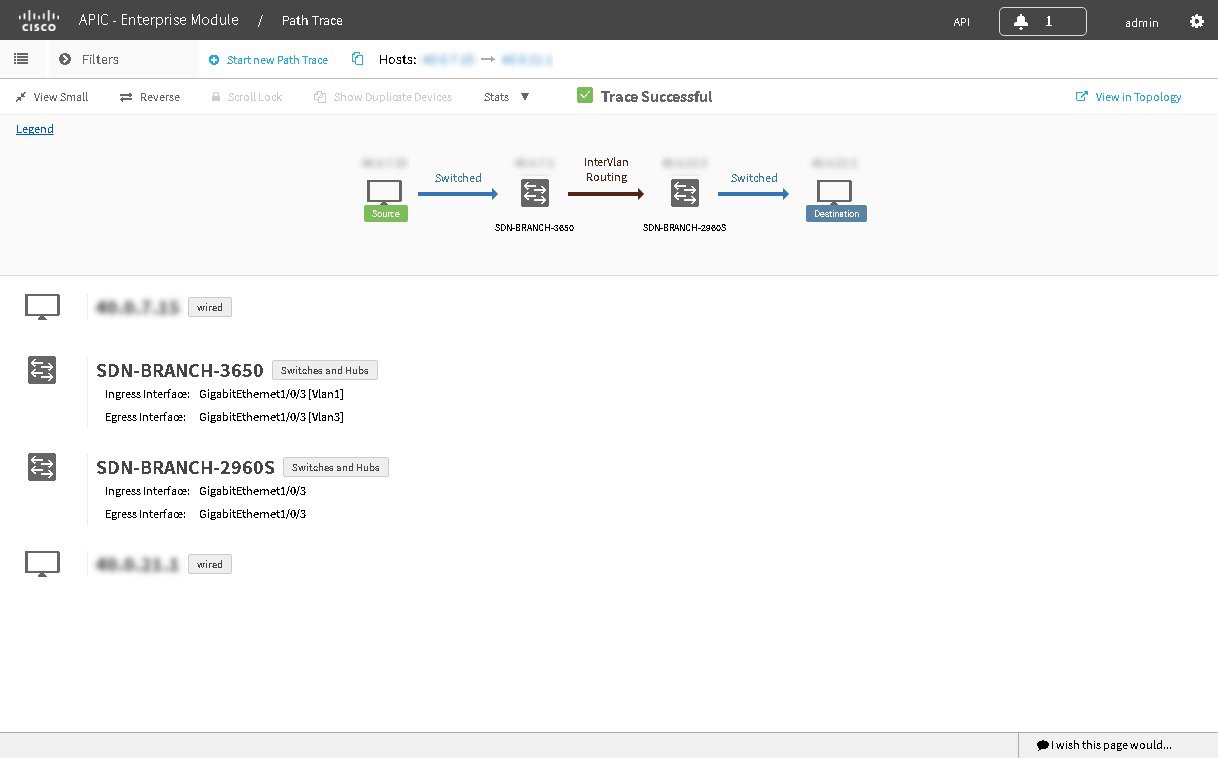
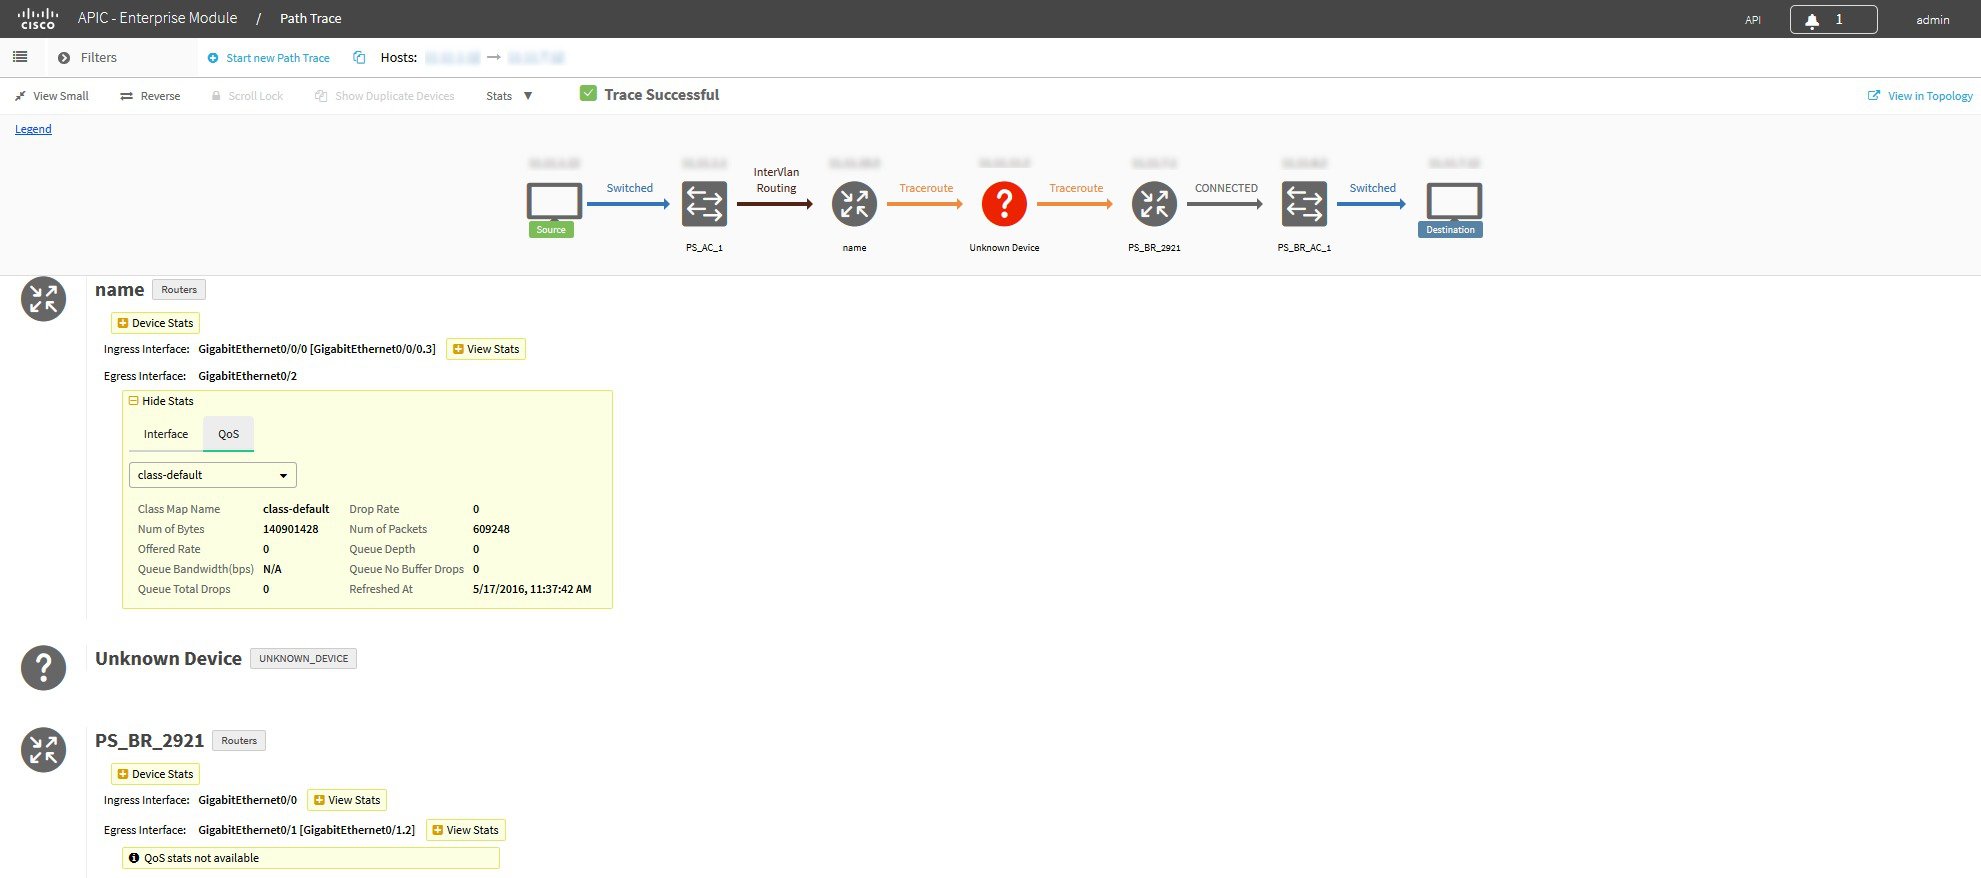
Trace Results Graphical Display
The controller graphically displays the path direction and the hosts and devices (including their IP addresses) along the path between the source (host A) and destination (host B). Clicking an individual device in the path trace highlights the device in the Trace Results Device Details area. The display also shows the protocol of the path source between devices along the path: Switched, STP, ECMP, Routed, Trace Route, or other source type.
If you performed an ACL trace, the devices show whether the traffic matching your criteria would be permitted or denied based on the ACLs configured on the interfaces. For more information, see Performing an ACL-Based Path Trace.
Trace Results Device Details
You can review the detailed information displayed for each device in the path trace.
|
Name |
Description |
||
|---|---|---|---|
|
IP |
IP address of the device. |
||
|
Type |
Wired or wireless device (access point, switch, or router). |
||
|
Link Source |
Information about the link between two devices (source and destination). Link information is based on the configuration of the source device.
|
||
|
Tunnels |
CAPWAP data (wireless) or mobility tunneling.
|
||
|
Ingress interface |
Ingress interface of the device for the path trace (physical or virtual). For example, a physical ingress interface is GigabitEthernet1/0/1 and a virtual ingress interface is GigabitEthernet1/3 [Vlan1]. If statistics were gathered for this path trace, clicking the View Stats button displays the interface or QoS statistics. For information, see Interface Statistics or QoS Statistics. |
||
|
Egress interface |
Egress interface of the device for the path trace (physical or virtual). For example, a physical interface is GigabitEthernet1/0/2 and a virtual ingress interface is GigabitEthernet1/4 [Vlan2]. If statistics were gathered for this path trace, clicking the View Stats button displays the interface or QoS statistics. For information, see Interface Statistics or QoS Statistics. |
||
|
Accuracy note |
If there is uncertainty about the path trace on a segment between devices, path trace displays a note that indicates the accuracy of the computed path as a percentage. For example, 10 percent would indicate lower accuracy than 90 percent. Place your cursor over the note to view suggestions of corrective actions to take to improve the path trace accuracy. For example, you may be prompted to enter port values and run the path trace again. |
||
|
VRF |
If Path Trace detects a VRF on a router, it displays the VRF in the graphical display and provides the interface name and VRF name. For more information, see Understanding VRF Path Trace Results. |
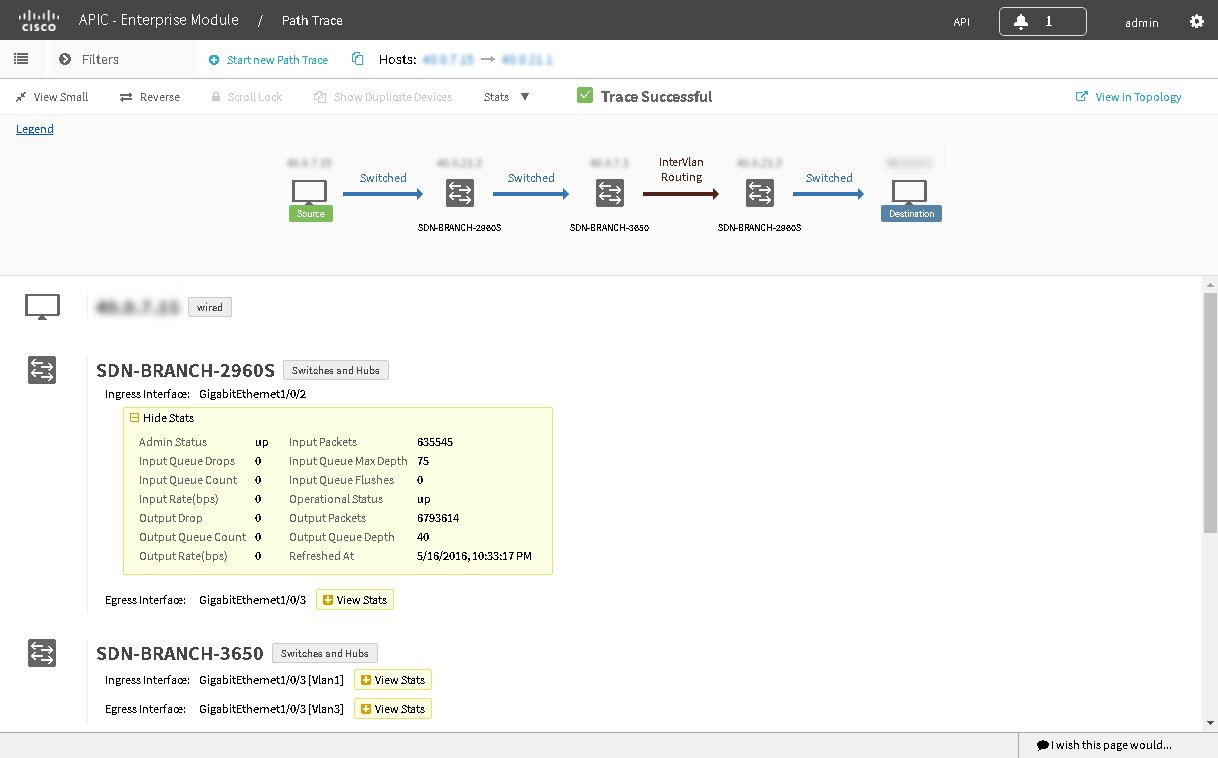
Trace Results Statistics
If you specified that device statistics be included in the path trace, statistical information about the device is gathered and displayed. You can select or deselect one or more of the options from the Stats drop-down list so that you can isolate different information.
For information about the statistics, see the following sections:
Understanding the Statistics Retrieved During a Path Trace
Device Statistics
If you specified that device statistics be included in the path trace, Path Trace gathers and displays statistical information about the device. Not all device types support all of the parameters (5 minutes, 5 seconds, and 1 minute). If a device does not support a particular parameter, Path Trace displays N/A (not supported).
|
Parameter |
Description |
|---|---|
|
CPU Usage |
|
|
5 Mins Usage(%) |
Percentage of the device's CPU usage for the last 5 minutes. |
|
5 Secs Usage(%) |
Percentage of the device's CPU usage for the last 5 seconds. |
|
1 Min Usage(%) |
Percentage of the device's CPU usage for the last minute. |
|
Refreshed At |
Date and time when the information was gathered. |
|
Memory Usage |
|
|
Refreshed At |
Date and time when the information was gathered. |
|
Memory Usage(bytes) |
The amount of memory (in bytes) that the device is using. |
Interface Statistics
When you perform a path trace, you can collect interface statistics that show how the interfaces are performing. In this way, you can monitor the effect of the QoS policies on the network and make any changes, if necessary. The following table lists the interface statistics that are retrieved.
|
Parameter |
Description |
|---|---|
|
Admin Status |
Administrative status of the interface:
|
|
Input Packets |
Number of packets being received on the interface. |
|
Input Queue Drops |
Number of packets dropped from the input queue due to the queue reaching its maximum threshold. |
|
Input Queue Max Depth |
Maximum number of packets that the input queue can hold before it must start dropping packets. |
|
Input Queue Count |
Number of packets in the input queue. |
|
Input Queue Flushes |
Number of packets dropped due to Selective Packet Discard (SPD). SPD is a mechanism that quickly drops low priority packets when the CPU is overloaded in order to save some processing capacity for high priority packets. |
|
Input Rate (bps) |
Number of bits per second at which packets are entering the interface. |
|
Operational Status |
Operational status of the interface:
|
|
Output Drop |
Number of packets dropped from the output queue due to the queue reaching its maximum threshold. |
|
Output Packets |
Number of packets leaving the interface. |
|
Output Queue Count |
Number of packets in the output queue. |
|
Output Queue Depth |
Maximum number of packets that the output queue can hold before it must start dropping packets. |
|
Output Rate (bps) |
Number of bits per second at which packets are leaving the interface. |
|
Refreshed At |
Date and time that the current statisticswere gathered. |
QoS Statistics
When you perform a path trace, you can collect QoS statistics that show how the QoS policies are performing. The only interface statistics included in the QoS statistics are those for the border router egress interface. Collecting QoS statistics helps you to monitor the effect of the QoS policies on your network devices and make any changes, if necessary. The following table lists the QoS Statistics that are retrieved.
|
Parameter |
Description |
|---|---|
|
Policy Name |
Drop-down list of policy names that QoS statistics have been collected about. |
|
Class Map Name |
Name of the class map. |
|
Num of Bytes |
Average number of bytes forwarded by the queue. |
|
Offered Rate |
Traffic rate offered for that particular traffic. |
|
Queue Bandwidth (bps) |
Rate (bps) at which the queue can process packets. |
|
Queue Total Drops |
Number of packets dropped from the queue due to the queue reaching its maximum threshold. |
|
Drop Rate |
Number of bits per second at which packets are being dropped from the queue. |
|
Num of Packets |
Number of packets that the queue can hold. |
|
Queue Depth |
Maximum number of packets that the queue can hold before it must start dropping packets. |
|
Queue No Buffer Drops |
Number of times that packets were dropped due to not enough buffer allocated. |
|
Refreshed At |
Date and time that the current statistics were gathered. |
Performance Monitor Statistics
When you run a path trace to collect Perf Mon statistics, the Cisco APIC-EM automatically configures all of the devices in the requested path with the necessary flow monitor configuration, and then removes the configuration when it is no longer needed (no pending performance monitor path trace for the path or 24 hours, whichever is first). For information about this configuration, see Performance Monitor Configuration.

The following table lists the performance monitor statistics that are retrieved.
|
Parameter |
Description |
|---|---|
|
Packet Count |
Total number of IP packets sent. |
|
Byte Rate |
Average number of packets or bits (as configured) that were processed by the monitoring system per second during the monitoring interval. |
|
Packet Loss |
Total number of IP packets lost by any intermediate system in the monitored flow. |
|
Packet Loss (%) |
Percentage of IP packets lost by any intermediate system in the monitored flow. |
|
RTP Jitter Mean |
Mean value of the Real-time Transport Protocol (RTP) jitter. |
|
RTP Jitter Min |
Minimum value of the Real-time Transport Protocol (RTP) jitter. |
|
RTP Jitter Max |
Maximum value of the Real-time Transport Protocol (RTP) jitter. |
|
IPv4 DSCP |
Value of the IPv4 differentiated services code point (DSCP) type of service (ToS). |
|
IPv4 TTL |
Value of the IPv4 time-to-live (TTL). |
|
Input Interface |
Name of the input interface that was used as match criteria. |
|
Output Interface |
Name of the output interface that was used as match criteria. |
|
Refreshed At |
Date and time that the performance monitor statistics were gathered. |
|
Source IP |
IP address of the source interface for all of the packets sent by a flow exporter. |
|
Destination IP |
IP address of the destination interface for all of the packets sent by a flow exporter. |
Understanding VRF Path Trace Results
Path trace supports VRF Lite and VRF route leaking. If Path Trace detects a VRF on a router, it displays the VRF in the graphical display and provides the interface name and VRF name. VRFs are shown as a colored circle, making it easy to see where they are along the path. VRFs with the same name have the same color.
Understanding ACL Path Trace Results
An ACL path trace shows whether the traffic matching your criteria would be permitted or denied based on the ACLs configured on the path.
The following rules effect the ACL path trace results:
-
Only matching ACEs are reported.
-
If you leave out the protocol, source port, or destination port when defining a path trace, the results include ACE matches for all possible values for these fields.
-
If no matching ACEs exists in the ACL, the flow is reported to be implicitly denied.

|
Icon |
Description |
|---|---|
 |
There are ACLs that permit the traffic applied on the interface. |
 |
Traffic may or may not be blocked. For example, if your traffic matches a deny access control entry (ACE), traffic is denied. However, if your traffic matches any other ACEs, it is permitted. You can get this type of results if you leave out the protocol, source port, or destination port when defining a path trace. |
 |
There is an ACL on the device or interface that is blocking the traffic on the path. |
 |
There are no ACLs applied on the interface. |
 Feedback