Cisco Application Policy Infrastructure Controller Enterprise Module Configuration Guide, Release 1.0.x
Bias-Free Language
The documentation set for this product strives to use bias-free language. For the purposes of this documentation set, bias-free is defined as language that does not imply discrimination based on age, disability, gender, racial identity, ethnic identity, sexual orientation, socioeconomic status, and intersectionality. Exceptions may be present in the documentation due to language that is hardcoded in the user interfaces of the product software, language used based on RFP documentation, or language that is used by a referenced third-party product. Learn more about how Cisco is using Inclusive Language.
- Updated:
- November 2, 2015
Chapter: Managing Applications
- Cisco Network Plug and Play
- Cisco Intelligent WAN (IWAN)
- Topology
- Performing Path Traces
Managing Applications
Cisco Network Plug and Play
The Cisco Network Plug and Play application provides a simple and secure solution for day-zero deployment of Cisco routers, switches, and wireless access points. The Cisco Network Plug and Play application allows users to preprovision devices by specifying the required image, configuration, and other details. When the device installer installs and powers up a Cisco network device, the device automatically discovers the Cisco APIC-EM controller using DHCP or DNS. After the discovery process is complete, the Cisco Network Plug and Play application provisions the device with the preconfigured information. If a device is not preconfigured, after it discovers and connects to the Cisco APIC-EM, it is listed as an unplanned device in the Cisco Network Plug and Play application. You can use the Cisco Network Plug and Play application to claim the unplanned device and configure it with a new configuration and Cisco IOS image. Cisco APIC-EM supports an embedded Plug and Play (PnP) protocol server that simplifies network device provisioning by securely and automatically delivering an image and configuration file to Cisco devices that support PnP. The PnP server communicates with a Cisco PnP agent installed on the PnP-supported Cisco devices.
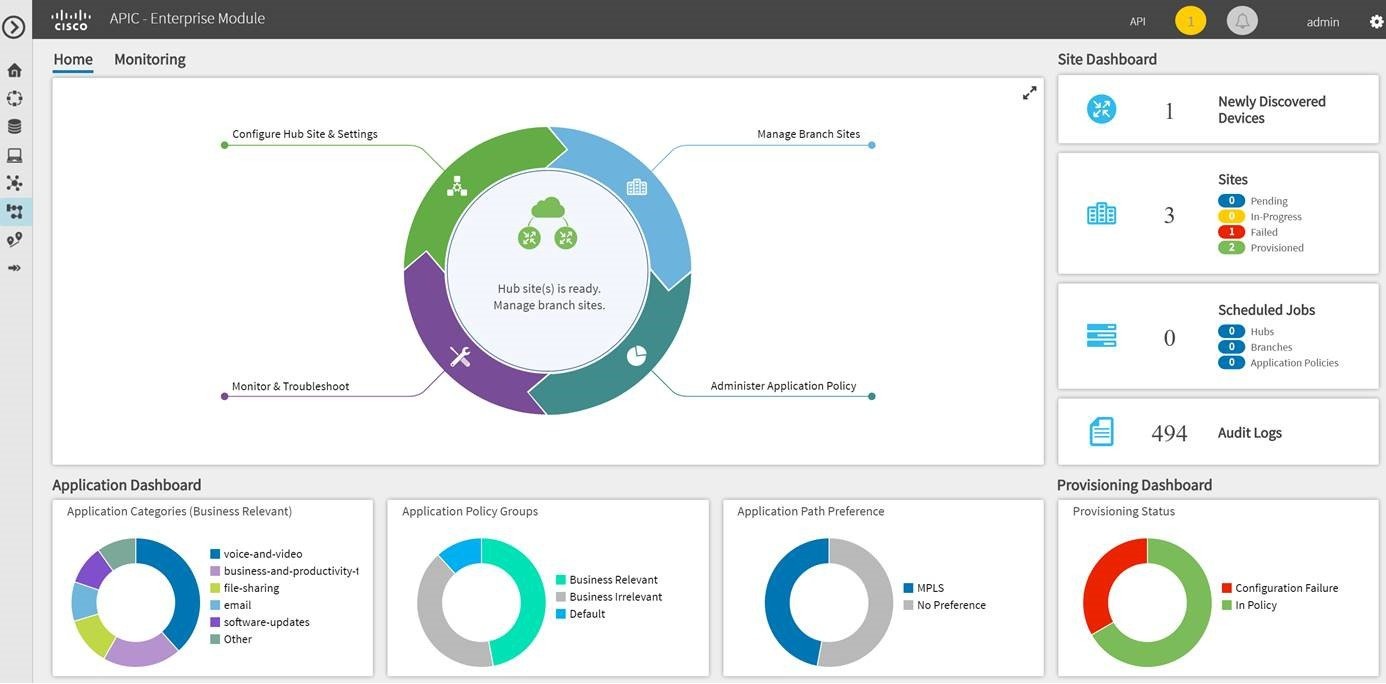
From the Network Plug and Play dashboard page, you can check the status of your site deployment. You can also start defining new sites using the Projects link, or view unclaimed devices using the Unplanned Devices link.
See the Cisco Network Plug and Play documentation for information about Cisco Network Plug and Play configuration procedures.
 Note | You may need to import a proxy gateway certificate if the PnP application is enabled on the controller and a proxy gateway exists in the DMZ between the PnP-enabled devices and the controller. For more information, see the Cisco Application Policy Infrastructure Controller Enterprise Module Deployment Guide. |

Cisco Intelligent WAN (IWAN)
The Cisco Intelligent WAN (IWAN) helps IT deliver an uncompromised user experience over any connection while lowering operational costs. IWAN also simplifies IT operations through a software-based controller model, automating management tasks to ensure faster, more successful deployments.
The Cisco IWAN Application leverages the APIC-EM to abstract the network devices into one system to eliminate network complexity, and provide centralized provisioning of the infrastructure to speed up application and service roll outs.
The Cisco IWAN Application with APIC-EM extends Software Defined Networking to the branch with an application-centric approach based on business policy and application rules. This provides IT centralized management with distributed enforcement across the network.
From the IWAN dashboard page, you can configure your network-wide settings, provision sites, and configure application policies.
See the Cisco IWAN documentation for information about Cisco IWAN network configuration procedures.
Note | You may need to import a proxy gateway certificate if the IWAN application is enabled on the controller and a proxy gateway exists in the DMZ between network devices and the controller. For more information, see the Cisco Application Policy Infrastructure Controller Enterprise Module Deployment Guide. |
Topology
The Topology window displays a graphical view of your network. Using the discovery settings that you have configured, the Cisco APIC-EM discovers and maps devices to a physical topology with detailed device-level data.
To access the Topology window, click Topology in the Navigation pane. The Topology window appears.
In addition, auto-visualization of Layer 2 and 3 topologies on top of the physical topology provides a granular view for design planning and simplified troubleshooting.
For a Layer 2 topology, the controller discovers configured VLANs within your network to display in the Topology window. For a Layer 3 topology, the controller discovers all forms of a Layer 3 topology (OSPF, IS-IS, etc.), depending on what is currently configured and in use within your network to display in the Topology window.
Note | Individual device configurations are retrieved and stored in a network information base (NIB). |
Clicking on a device icon provides information about that device.
Note | For additional detailed information about the paths between hosts and through the network devices, use the Path Trace feature. Click Path Trace in the Navigation pane to access this application. |
- Topology Toolbar
- Topology Icons
- Displaying Device Data
- Device Aggregation
- Configuring the Topology Structure
- Saving a Topology Layout
- Opening a Saved Topology Layout
- Changing the Device Role in the Topology Window
- Searching for Devices and Hosts
- Applying Tags to Devices
- Displaying Devices with Tags
Topology Toolbar
The Topology toolbar is located at the top of the Topology window.
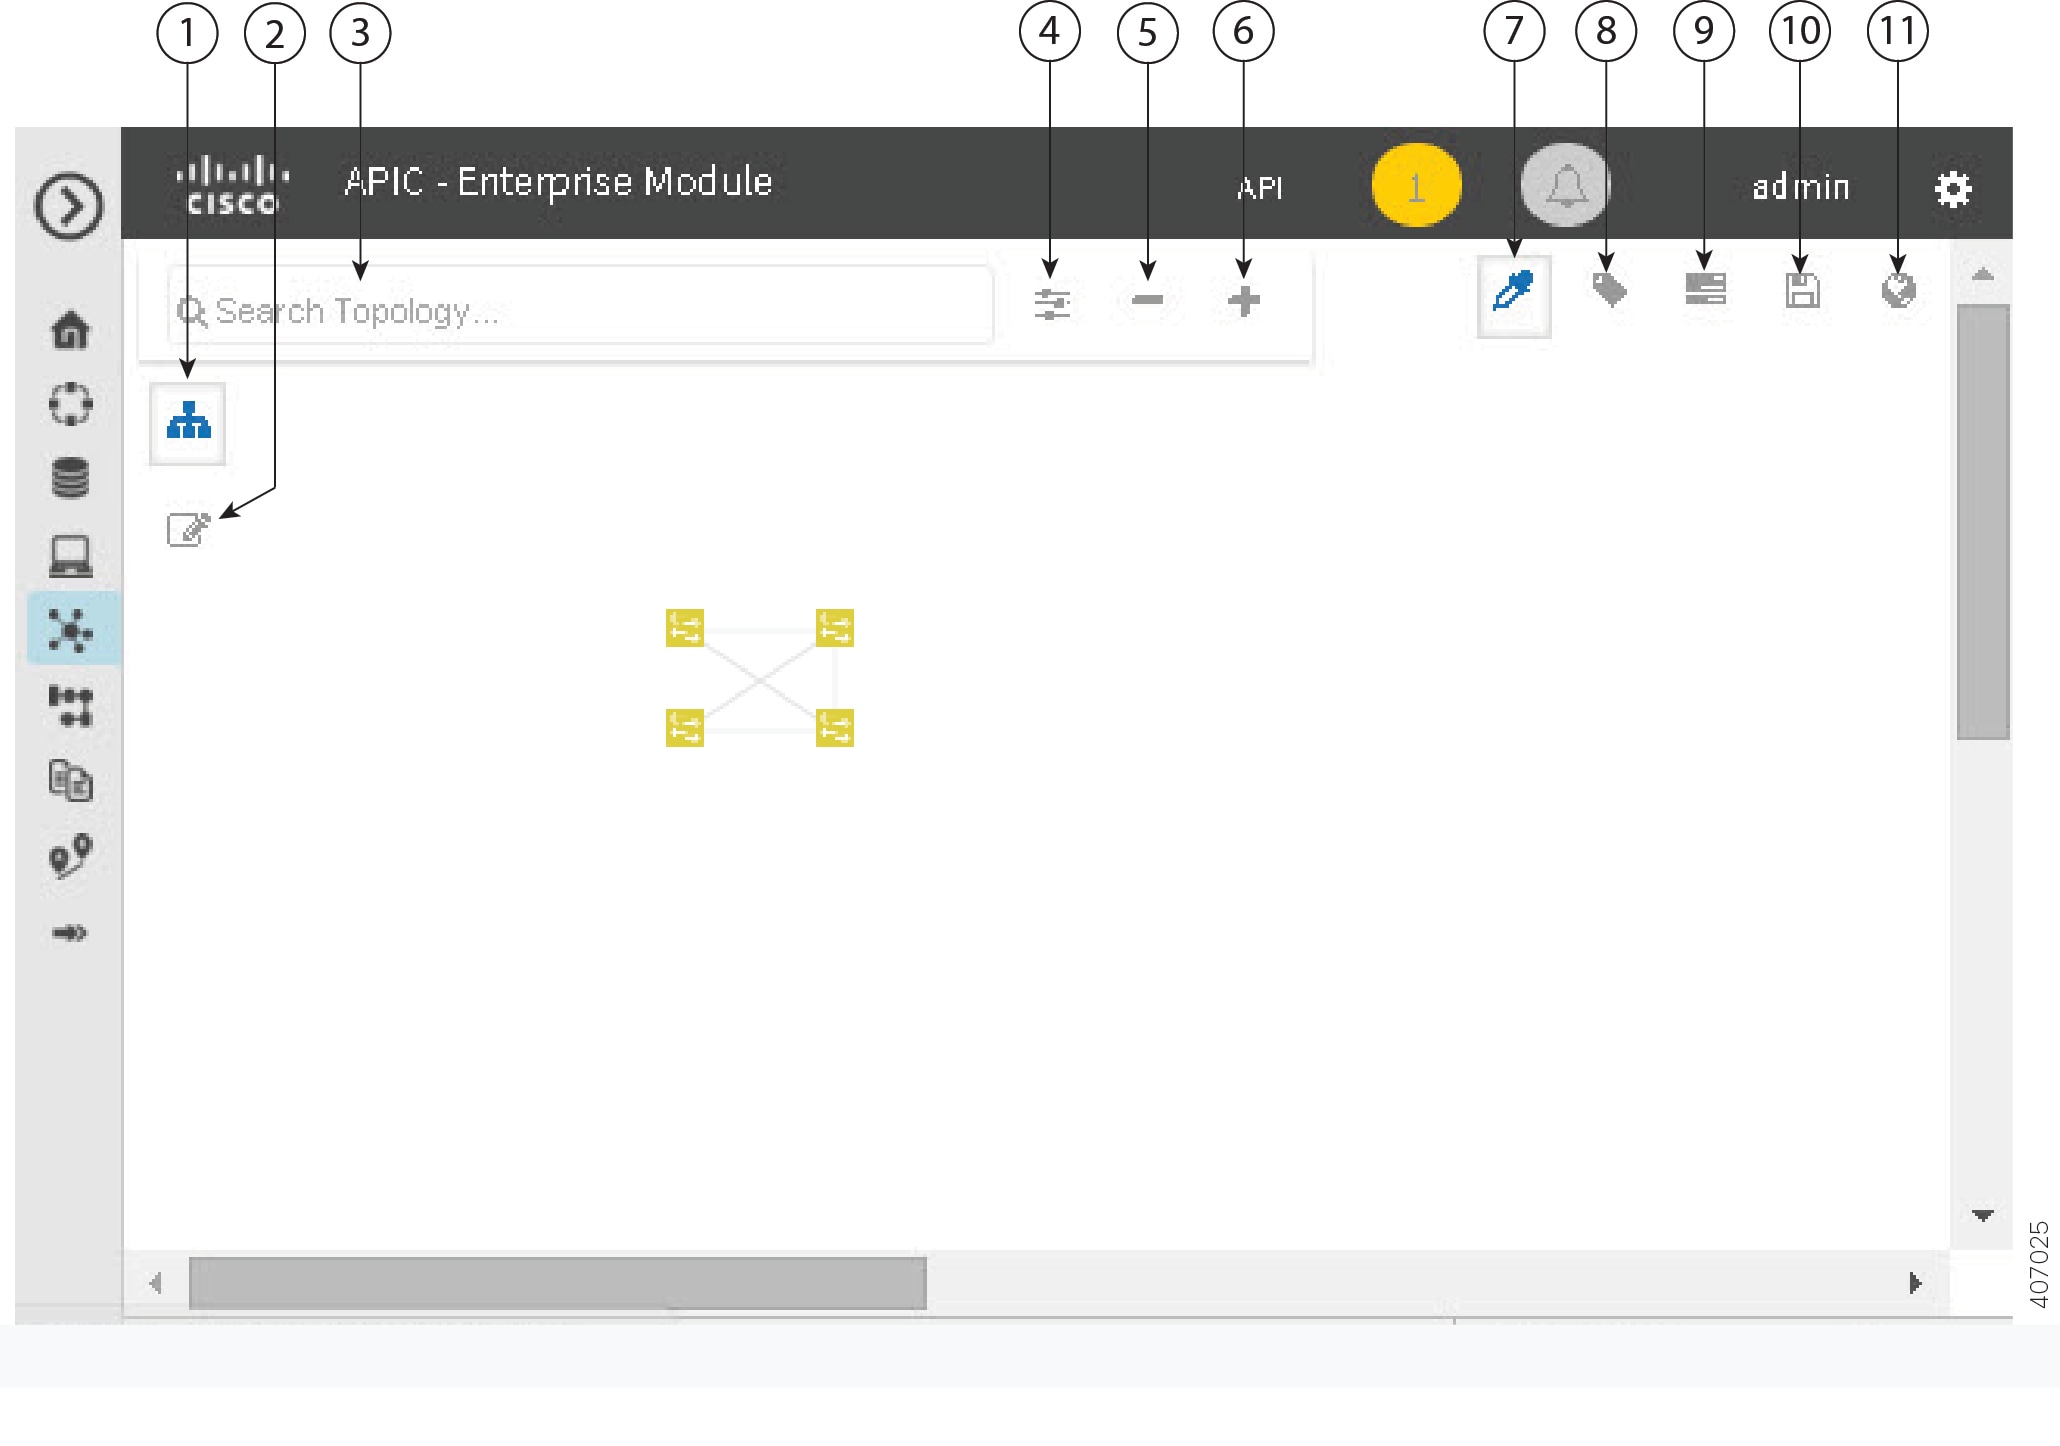
Topology Icons
The following icons appear in the Topology window:
|
Icon |
Network Element |
Description |
||
|---|---|---|---|---|
|
|
Cloud |
Representation of the external network. |
||
|
|
Host |
Displays the hostname or IP address of the host. |
||
|
|
Router |
Displays the device name. |
||
|
|
Switch |
Displays the device name. |
||
|
|
Access Point |
Displays the device name. |
||
|
|
Wireless LAN Controller |
Displays the device name. |
||
|
|
Aggregated Devices |
Displays the number of aggregated devices and the device type.
|
||
|
|
Location Marker |
Displays the device name. The device icon is displayed with a location marker as a background. If you add location markers to your devices (from the Device Inventory window) and then click Topology in the navigation pane or click the Map button on the Topology toolbar, the Topology map view appears. The map view shows where you have placed your location markers (for example, San Jose and London). Click a location marker on the map to display the topology for that location (for example, San Jose). Devices that use a different location marker (for example, London) are shown with a location marker as a background. |
||
|
|
Links |
Lines between devices. Click on a link to display information about the connected devices.
|


Displaying Device Data
You can display data for a specific device in the Topology window. Displaying device data is helpful when troubleshooting network connectivity issues between devices.
Note | The device data that is accessible in the Topology window is also accessible in the Device Inventory window. |
The following device data is available:
-
Location (Location information is displayed if the selected device icon has a location marker background. Click the Location link to display the topology for devices that share that location marker.)
-
Type
-
Device role (For information about changing the device role, see Changing the Device Role.
-
IP address
-
MAC address
-
OS (operating system)
-
Software version
-
Ports -
VLAN (if exists)
-
Number of connections
-
List of connected devices (Each connected device shows its device type (icon) and the number of connections. Clicking on a connected device displays the details for that device.)
-
Tags
| Step 1 | From the
Navigation pane, click
Topology.
The Topology window appears.
| ||
| Step 2 | To display data for a specific device, click that device in the Topology window. | ||
| Step 3 | To display a list of aggregated devices, do the following: |
What to Do Next
Select and review data from other devices within your network, or perform other tasks including the following:
Device Aggregation
You use the Cisco APIC-EM device aggregation feature to adjust how devices are displayed in the Topology window. This feature enhances network navigation and manageability.
- Aggregating Devices in the Topology Window
- Disaggregating Devices in the Topology Window
- Changing the Aggregated Devices Label
Aggregating Devices in the Topology Window
You can aggregate and disaggreate devices into and out of groups in the Topology window.
Scan your network using the discovery functionality of the Cisco APIC-EM to populate device and host inventory for the database.
Determine how the devices within your network configuration are to be visually grouped and organized.
| Step 1 | Click
Topology in the navigation pane.
The Topology window appears.
| ||
| Step 2 | Click the
Toggle Aggregation icon to enable device
aggregation.
| ||
| Step 3 | Drag and drop a device icon onto another device icon.
The device icon changes to an aggregated devices icon. For more information about the aggregated devices icon, see Topology Icons.
|
Disaggregating Devices in the Topology Window
Scan your network using the discovery functionality of the Cisco APIC-EM to populate device and host inventory for the database.
Determine how the devices within your network configuration are to be visually grouped and organized.
| Step 1 | From the
Navigation pane, click
Topology.
The Topology window appears.
| ||
| Step 2 | Click on an
aggregated devices icon.
A list of the aggregated devices appears. | ||
| Step 3 | From the list,
click the
Disaggregate link for each device that you want to
remove from the aggregated devices.
The device is removed from the list and from the aggregated devices icon. The aggregated device label and the aggregated devices icon are updated to reflect the number of devices. |
Changing the Aggregated Devices Label
The default label for aggregated devices is the number of devices and the device type (# devicetype Devices). However, you can change the default label to one that is meaningful in the context of your network topology.
Scan your network using the discovery functionality of the Cisco APIC-EM to populate device and host inventory for the database.
Determine how the devices within your network configuration are to be visually grouped and organized.
| Step 1 | From the
Navigation pane, click
Topology.
The Topology window appears.
| ||
| Step 2 | Click an
aggregated devices icon.
A list of the aggregated devices appears. At the top of the list is the aggregated devices label. | ||
| Step 3 | Click the aggregated devices label to open an edit field where you can change the label. | ||
| Step 4 | Change the label, then click outside of the edit field to save your changes. |
Configuring the Topology Structure
You can choose from three default topology layouts. You can also use advanced settings to modify these layouts, such as the overall size of the topology graph, the spacing that separates individual elements, and more.
Scan your network using the discovery functionality of the Cisco APIC-EM to populate device and host inventory for the database.
| Step 1 | From the
Navigation pane, click
Topology.
The Topology window appears.
| ||||||||||||||||||||||
| Step 2 | From the Topology toolbar, click the Filters icon. | ||||||||||||||||||||||
| Step 3 | Select a filter from the drop down list. Available options are Branch, Connections, or Device & Role. | ||||||||||||||||||||||
| Step 4 | Click the
Advanced View button to configure how each filter is
displayed. Click the
Basic
View button to return to the basic view.
|
What to Do Next
Save the current layout or load a previously saved layout. For information, see Saving a Topology Layout and Opening a Saved Topology Layout.
Saving a Topology Layout
You can save a topology layout so that you can open and view it later.
You must have administrator role permissions.
You must have scanned your network using discovery to populate device and host inventory into the database.
| Step 1 | From the
Navigation pane, click
Topology.
The Topology window appears. |
| Step 2 | From the Topology toolbar, click the Save icon. |
| Step 3 | In the Topology Title field, enter a name for the topology and click Save as New. |
| Step 4 | Click
OK to confirm the save.
The topology is saved and the name appears at the top of the dialog box. |
Opening a Saved Topology Layout
You can open a topology layout that you have previously saved.
You must have administrator role permissions.
You must have scanned your network using discovery to populate device and host inventory into the database.
You must have saved a topology layout.
| Step 1 | From the
Navigation pane, click
Topology.
The Topology window appears. |
| Step 2 | From the
Topology toolbar, click the
Save icon.
A dialog box appears listing the saved topology layouts. |
| Step 3 | For the topology layout that you want to open, click the Folder icon.. |
| Step 4 | Click
OK to confirm.
The topology layout opens in the Topology window. |
Changing the Device Role in the Topology Window
During the scan process, a device role is automatically assigned to each discovered device. The device role is used for identifying and grouping devices according to their responsibilities and placement within the network.
-
Unknown—Device role is unknown.
-
Access—Device is located within and performs tasks required for the access layer or first tier/edge.
-
Border Router—Device performs the tasks required for a border router.
-
Distribution—Device is located within and performs tasks required for the distribution layer.
-
Core—Device is located within and performs tasks required for the core.
You can change the device role when you select a device and display the device data.
Note | You can also change the device role from the Device Inventory window. |
Scan your network using the discovery functionality of the Cisco APIC-EM to populate device and host inventory for the database.
| Step 1 | From the
Navigation pane, click
Topology.
The Topology window appears.
| ||
| Step 2 | Click a specific device in the Topology window to select it. | ||
| Step 3 | Choose a role from the Role drop-down list: Access, Core, Distribution, or Border Router. | ||
| Step 4 | (Optional) Select additional devices and change device roles. | ||
| Step 5 | Click the Filters icon on the Topology toolbar. | ||
| Step 6 | (Optional) Select a filter from the drop down list. Available options are Branch, Connections, or Device and Role. | ||
| Step 7 | Click the refresh button to the right of the filter type to update all of the device roles. The Topology structure refreshes showing the changed device roles. |
Searching for Devices and Hosts
You use the Cisco APIC-EM search function to locate specific hosts or devices within your network. This function allows you to search the network using any string value. To locate a specific host or device quickly, use any of the following values in the search field:
Note | The search function supports fragmented results. For example, if you enter 12 in the search field, you will get results for devices with IP addresses or device names that contain 1 and 2 (.12, .120, .102, 10.20, 1-switch2, etc). |
Scan your network using the discovery functionality of the Cisco APIC-EM to populate device and host inventory for the database.
Determine the string value to be used within your network for your search.
| Step 1 | Click
Topology in the navigation pane.
The Topology window appears.
| ||
| Step 2 | From the
Topology toolbar, enter a keyword in the
Search
Topology field.
As you begin typing, the controller displays a list of possible matches to your entry.
| ||
| Step 3 | Click on a device from the search results to highlight that device and its links in the Topology window. Click on the device again to display detailed data for that device. | ||
| Step 4 | Proceed with any provisioning or troubleshooting tasks on the located hosts or devices. |
What to Do Next
Search using other string values for other hosts or devices within your network, or perform other tasks including the following:
Applying Tags to Devices
You use the Cisco APIC-EM tag feature to associate devices within your network with a single attribute. A tag also enables the grouping of devices based upon an attribute. For example, you can create a tag and use it to group devices based upon a platform ID, Cisco IOS releases, or location.
To apply tags to devices within your network in the Topology window, perform the following steps.
Note | Applying a tag to a host is not supported. |
You should have performed the following tasks:
| Step 1 | From the
Navigation pane, click
Topology.
The Topology window appears. | ||
| Step 2 | Click the device
or devices you want to tag. To select more than one device, click the
Multiselect icon. For information about how to use
the multiselect function, see
Topology Icons.
| ||
| Step 3 | Click
Device
Tagging.
The Device Tagging dialog box appears. | ||
| Step 4 | From the Available Tags column, click a tag to apply it to the selected device or devices. If the tag you want does not exist, you can create it by following these steps: | ||
| Step 5 | When you are done tagging, click x to close the dialog box. | ||
| Step 6 | You can verify the tagging by clicking on one of the devices that you tagged. The Device Information dialog box shows the Tags field with the total number and the names of the tags applied to the device. |
Displaying Devices with Tags
To display tagged devices from the Topology window, perform the following steps.
You should have performed the following tasks:
| Step 1 | From the Navigation pane, click
Topology.
The Topology window appears.
| ||
| Step 2 | From the Topology toolbar, click the
Tags.
A tag selection box appears. | ||
| Step 3 | To identify the devices associated with a tag, click the tag. To
return the devices to their normal display, click the tag again.
Tags are color-coded, so when you click a tag, a circle of the same color is drawn around its associated devices.
| ||
| Step 4 | To close the tag selection box, click the Tags icon in the Topology toolbar. |
Performing Path Traces
About Path Trace
Path trace involves the controller reviewing and collecting protocol and other types of data from discovered devices in your network, and then using this data to calculate a path between two hosts or Layer 3 interfaces. You can use the path trace application to monitor and debug traffic paths that are distributed among the various devices throughout your network.
You perform these tasks by running a path trace between two nodes in your network. The two nodes can be a combination of wired or wireless hosts and/or Layer 3 interfaces. In addition, you can specify the protocol for the controller to use to establish the path trace connection, either TCP or UDP.
At every node in the path, the controller reports information about the device and path. For example, if a Layer 2 protocol is used to discover a node, the controller reports that the path is a switched path and labels it as Switched. If the controller detects load balancing decisions being made on a discovered device, it reports the path as an ECMP path and labels it as ECMP. Path trace can identify the following information about the devices and paths:
For nodes that are unknown devices within a path trace (usually non-Cisco devices), the controller calculates the path between the unknown devices starting from the last known Cisco device (from the Host Source IP) to the next, neighboring Cisco device (sometimes the Destination Source IP). The collected IP address data about the unknown device is then sent from this neighboring Cisco device to the controller to calculate the trace path. The unknown device is displayed in the controller's GUI as a question mark (?).
Note | In certain circumstances, a path trace may flow between one of two (or more) devices. To determine which device actually received the flow for the path trace, the controller reads the NetFlow configurations and records on the devices (if they exist). By reading this data from the devices, the controller can determine the likelihood of the actual path. |
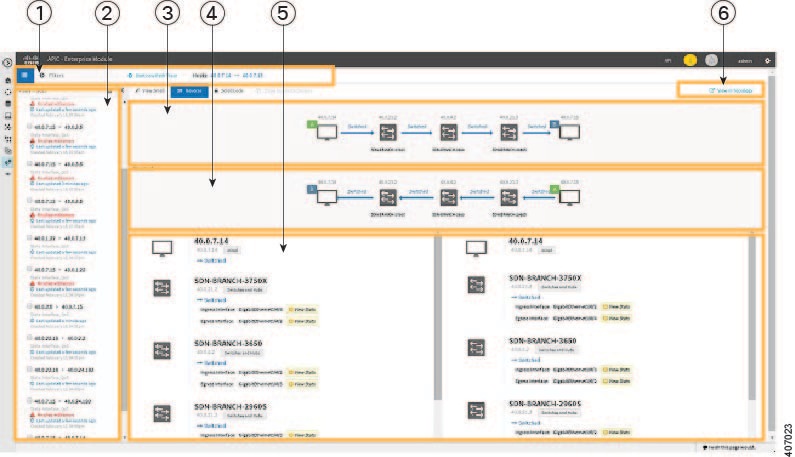
To perform a path trace, from the Navigation pane, click Path Trace. The Path Trace window opens.
|
Callout Number |
Name |
Description |
||
|---|---|---|---|---|
|
1 |
Toolbar |
Contains tools that act on the path trace shown in the Trace Results Graphical Display. |
||
|
2 |
Trace Results Graphical Display |
Shows a graphical representation of the path trace. |
||
|
3 |
Trace Results Details |
Provides detailed information about the devices along the path. |
||
|
4 |
Original Trace Results |
Shows the path trace from the source host to the destination host. |
||
|
5 |
Reverse Results |
Shows the path trace in reverse order, from the destination host to the source host. |
||
|
6 |
View in Topology button |
Displays the trace results in the Topology window.
|
Path Trace Support
Note | If the controller can not complete a path trace for the selected hosts or interfaces, it displays the results of a partial trace. |
Path Trace Protocols and Network Connections
The following table describes the supported device protocols and network connections (physical, wireless, and virtual) for a Cisco APIC-EM path trace.
Note | For detailed information about protocol, wireless, and AP support by platform and scenario, see the Release Notes for the Cisco Application Policy Infrastructure Controller Enterprise Module. |
|
Supported Device Protocols and Network Connections |
Description |
||
|---|---|---|---|
|
Border Gateway Protocol (BGP) |
When BGP is used in a network, the path trace for a given application flow can be displayed through the controller's GUI. The user is able to determine the exact path a particular application is taking. The data used for this path trace calculation is obtained during the discovery process and stored in the controller's database where it is kept up to date. |
||
|
Equal Cost Multi Path (ECMP) |
When an ECMP routing strategy is used in a network, the path trace for a given application flow can be displayed through the controller's GUI. The user is able to determine the exact path a particular application is taking. The data used for this path trace calculation is obtained through an on-demand query made through the network device at the time the path calculation request is made.
|
||
|
Hot Standby Router Protocol (HSRP) |
When HSRP is used in a network, the controller automatically looks up the HSRP active router for a given segment and calculates the path appropriately for a path trace. The data used for this path trace calculation is obtained during the discovery process and stored in the controller's database where it is kept up to date. |
||
|
Intermediate System-to-Intermediate System (IS-IS) Protocol |
When IS-IS is used in a network, the path trace for a given application flow can be displayed through the controller's GUI. The user is able to determine the exact path a particular application is taking. The data used for this path trace calculation is obtained during the discovery process and stored in the controller's database where it is kept up to date. |
||
|
Layer 3 Forwarding Interface |
The controller can perform path traces between two Layer 3 forwarding interfaces or between a Layer 3 forwarding interface and a host. |
||
|
MPLS-VPN (WAN) |
The controller provides path trace support for a branch-to-branch connected and provider-managed MPLS-VPN service. Supported devices for this type of path trace include:
All customer edge (CE) routers should have NetFlow enabled with traffic running between the hosts and routers.
The data used for this path trace calculation is obtained through an on-demand query made through the network device at the time the path calculation request is made. |
||
|
Open Shortest Path First Protocol (OSPF) |
When OSPF is used in a network, the path trace for a given application flow can be displayed through the controller's GUI. The user is able to determine the exact path a particular application is taking. The data used for this path trace calculation is obtained during the discovery process and stored in the controller's database where it is kept up to date. |
||
|
Physical connectivity (Ethernet, Serial and Packet over SONET (PoS)) |
The path trace for a given application flow can be displayed over Ethernet, Serial over SONET, and Packet over SONET. The data used for this path trace calculation is obtained during the discovery process and stored in the controller's database where it is kept up to date. |
||
|
Spanning Tree Protocol (STP) |
The controller provides Layer 2 support for Spanning Tree Protocol (STP). The data used for this path trace calculation is obtained during the discovery process and stored in the controller's database where it is kept up to date. |
||
|
Static Routing |
When static routing is used in a network, the path trace for a given application flow can be displayed through the controller's GUI. The user is able to determine the exact path a particular application is taking. The data used for this path trace calculation is obtained during the discovery process and stored in the controller's database where it is kept up to date. |
||
|
Virtual connectivity—Layer 2 Port Channel |
When virtual connectivity (Layer 2 port channel) is used within a network, the path trace for a given application flow is displayed. The path trace over virtual interfaces (port channels) is displayed, so that the user can visualize an end-to-end path for an application. |
||
|
Virtual connectivity—VLAN/SVI |
When virtual connectivity (VLAN/SVI) is used within a network, the path trace for a given application flow is displayed. The path trace is displayed, so that the user can visualize an end-to-end path for an application. The data used for this path calculation is obtained during the discovery process and stored in the controller's database where it is kept up to date. |
||
|
Wireless |
The controller provides path trace support for Control and Provisioning of Wireless Access Points (CAPWAP), 802.11, and mobility. When wireless network elements are used, the path trace for a given application flow is displayed. The user knows the exact path a particular application is taking.
The data used for this path calculation is obtained during the discovery process and stored in the controller's database where it is kept up to date. |
||
|
Equal Cost Multipath/Trace Route (ECMP/TR) |
When ECMP/TR is used in a network, the path trace for a given application flow can be displayed through the controller's GUI. The user is able to determine the exact path a particular application is taking. The data used for this path trace calculation is obtained on demand by polling the device. When performing a path trace on ECMP, Cisco Express Forwarding (CEF) lookup is performed on the device on demand for requested tuples. When a path trace detects a number of unknown or unmanaged devices in the path, the path trace is executed on demand from the last known or managed Cisco device and the path calculation is restarted from the first known or managed Cisco device in the trace route result. The unknown or unmanaged hops discovered using path trace are added to the path as unknown devices along with their IP addresses. |
||
|
Netflow |
When Netflow is used in a network, the path trace for a given application flow can be displayed through the controller's GUI. The user is able to determine the exact path a particular application is taking. When we have multiple border routers in the destination island, the Netflow cache from the devices are used to find the actual ingress border router. The Netflow record is matched from these devices on demand for a given tuple. It is essential to configure Netflow on the border routers. If Netflow is not configured, trace route is used to find the ingress interfaces, which might not be accurate. |
||
|
Sub interfaces |
When sub interfaces are used within a network, the path trace for a given application flow is displayed. The path trace between the two sub interfaces is displayed, so that the user can visualize an end-to-end path for an application. |
||
|
Enhanced Interior Gateway Routing Protocol (EIGRP) |
When EIGRP is used in a network, the path trace for a given application flow can be displayed through the controller's GUI. The user is able to determine the exact path a particular application is taking. The data used for this path trace calculation is obtained during the discovery process and stored in the controller's database where it is kept up to date. |
||
|
Layer 3 Recursive Lookup |
When Layer 3 Recursive Lookup is used in a network, the path trace for a given application flow can be displayed through the controller's GUI. The user is able to determine the exact path a particular application is taking. Up to three recursive lookups are supported. The data used for this path trace calculation is obtained during the discovery process and stored in the controller's database where it is kept up to date. |
Performing a Path Trace
You can perform a path trace between two nodes in your network. The two nodes may be two hosts and/or Layer 3 interfaces.
Note | The path trace application may display an accuracy notice—a red box with a percentage number in. An accuracy notice that appears on a node or path segment indicates the accuracy level of the path based on the information used to determine the path. Click the accuracy notice to display suggestions for you to take to improve that path trace's accuracy. You can use these suggestions to adjust the device configurations on the path and then perform an second trace for a more accurate result. |
Scan your network using the discovery function to populate device and host inventory for the database.
Ensure that the controller has SSH or Telnet access to the devices.
| Step 1 | In the
Navigation pane, click
Path
Trace.
The Path Trace window appears. | ||
| Step 2 | In the
Source
IP field, enter the IP address of the first host or the Layer 3
forwarding interface.
To determine the current list of hosts recognized by the controller, display the Host Inventory table. To list the Layer 3 forwarding interfaces for a device, enter the device name or IP address followed by a colon ":". All interfaces with IP addresses on the device are displayed. | ||
| Step 3 | In the
Destination IP field, enter the IP address of the
second host or the Layer 3 forwarding interface.
To determine the current list of hosts recognized by the controller, display the Host Inventory table. To list the Layer 3 forwarding interfaces for a device, enter the device name or IP address followed by a colon ":". All interfaces with IP addresses on the device are displayed. | ||
| Step 4 | (Optional)In the Source Port field, enter the port number of the first host. | ||
| Step 5 | (Optional)In the Destination Port field, enter the port number of the second host. | ||
| Step 6 | (Optional)In the Protocol field, choose either tcp or udp from the drop-down menu for the Layer 4 path trace protocol. | ||
| Step 7 | Click
Trace.
Review the path trace output. For more information, see Understanding Path Trace Results. | ||
| Step 8 | To view the
path trace in the
Topology window. Click
View
in Topology.
The
Topology window opens with the path trace highlighted
in your network. For more information about the
Topology window, see
Topology.
|
Understanding Path Trace Results
After you run a path trace, the controller displays the results in the Path Results pane.
Toolbar
At the top of the Path Results pane, the toolbar provides buttons for adjusting the path trace display.
|
View Small |
Minimizes the trace path graphic to better view the trace path details. |
|
Show Reverse |
Displays the trace path graphic from the host destination IP to the host source IP. The reverse path trace graphic is displayed directly below the original path trace. The reverse path trace details are displayed to the right of the original path trace details. |
|
Scroll Lock |
Locks the scrolling of the path trace and reverse path trace details windows. (Available when Show Reverse is enabled.) |
|
Show Duplicate Devices |
Displays or hides duplicate devices within a path trace. |
|
View in Topology |
Opens the Topology window and highlights the path trace results in your network topology. For more information about using the Topology window, see Topology. |
Note | Depending upon the trace results, some of the above buttons may be grayed out and not available. |
Trace Results Graphical Display
The controller graphically displays the path direction and the devices and networks that the path traverses. The following information is also provided:
-
Hosts and devices (including their IP addresses) on the path trace between the source and destination.
-
Link Information Source—Whether the path source between devices is either Switched, STP, ECMP, Routed, Trace Route, or other source type.
Note | If the path trace is lengthy and involves many devices, clicking an individual device in the path trace adjusts the GUI view to focus on that specific device. You can then scroll the view either up or down from that specific device. |
Trace Results Details
Review the detailed information displayed for each device in the path trace:
|
IP |
IP address of the device. |
||
|
Type |
Wired or wireless device (access point, switch, or router). |
||
|
Link Source |
Assuming two devices in a path (device A and device B) and the path direction is from device A to device B, then depending upon your network configuration, the following link information source types might be displayed:
|
||
|
Tunnels |
CAPWAP data (wireless) or mobility tunneling
|
||
|
Ingress interface |
Ingress interface of the device for the path trace (physical or virtual). For example, a physical ingress interface is GigabitEthernet1/0/1 and a virtual ingress interface is GigabitEthernet1/3 [Vlan1]. |
||
|
Egress interface |
Egress interface of the device for the path trace (physical or virtual). For example, a physical interface is GigabitEthernet1/0/2 and a virtual ingress interface is GigabitEthernet1/4 [Vlan2]. |
||
|
Accuracy note |
If there is uncertainty about the path trace on a segment between devices, a note about the accuracy of the computed path on this segment is displayed as a percentage. |
 Feedback