Cisco Service Control Usage Analysis and Reporting Solution Guide, Release 5.2.x
Available Languages
Table of Contents
Cisco Service Control Usage Analysis and Reporting Solution Guide, Release 5.2.x
Service Control Application Reporter
Starting the Reporter and Generating Reports
Creating a Global Bandwidth per Service Report
Viewing Reports by Popularity of Service
Viewing File Sharing Bandwidth Use
Creating a Global Active Subscriber per Service Report
Creating a Relative Consumption of Top Subscribers Report
Creating a Top Subscribers Report
Creating a Subscriber Bandwidth per Service Report
Monitoring Top Sites and Service Ports
Creating a Top Web Hosts Report
Creating a Top Service Ports Report
Creating Global VoIP MOS Reports
Creating a Global VoIP Codec Distribution Report
Creating a Top Scanned or Attacked Ports Report
Zooming in on a 2-Dimensional Chart
Zooming Out of a Zoomed-In Chart
Setting the Colors Used in Charts
Changing the Color of Legend Items
Cisco Service Control Usage Analysis and Reporting Solution Guide, Release 5.2.x
Usage Analysis and Reporting Solution Overview
Useful Cisco SCA Reporter Tools

About this Guide
The Cisco Service Control Usage Analysis and Reporting Solution Guide provides an:
- Overview of the Cisco Service Control solution and the advantages that it can provide when monitoring and analyzing network use.
- Overview of the Cisco Service Control Application (Cisco SCA) Reporter.
- Introduction to using the Cisco SCA Reporter to create reports based on network bandwidth use, which allow you to understand how subscribers are using your network.
Usage Analysis and Reporting Solution Overview
The goal of Usage Analysis is to identify how network resources are used to save operational costs and generate new revenue streams that reflect the established business model. The Cisco Service Control solution gives service providers an effective means of gaining true visibility into subscriber activity and usage patterns of complex network environments.
The Cisco Service Control solution:
- Allows you to identify network activity, control subscriber and application traffic, and to perform traffic management service creation.
- Provides a granular classification and control engine that provides key, actionable data on network activities.
- Consists of the Cisco Service Control Engine (Cisco SCE), Cisco Service Control Application for Broadband (Cisco SCA BB), Cisco Service Control Collection Manager, and Service Control Application (Cisco SCA) Reporter components.
The Cisco Service Control solution provides these advantages:
- Deep packet inspection (DPI) reconstructs traffic semantics up to Layer 7 protocol information, classifies traffic to end application (file sharing, over the top [OTT] video, browsing, VoIP, gaming) even for port-hopping or multiflow applications.
- Subscriber-aware traffic processing monitors traffic at a per-subscriber, group, or global level.
- Usage statistics that are actionable and meaningful.
- Traffic inspection and usage data are exported without any impact on existing network performance.
- The deployment is transparent in either Cisco or third-party networks. The Cisco Service Control solution can be installed inline or in receive-only mode.
When the solution is installed:
1.![]() Cisco Service Control SCE creates raw data records (RDRs) that contain the raw information about network use.
Cisco Service Control SCE creates raw data records (RDRs) that contain the raw information about network use.
2.![]() Cisco Service Control Collection Manager collects the RDRs into a database.
Cisco Service Control Collection Manager collects the RDRs into a database.
3.![]() Cisco SCA Reporter (as part of the Cisco SCA BB Console or as a standalone application) queries the Cisco Service Control Collection Manager database to produce reports.
Cisco SCA Reporter (as part of the Cisco SCA BB Console or as a standalone application) queries the Cisco Service Control Collection Manager database to produce reports.
For details on the Cisco Service Control Solution, see the Cisco Service Control Product Overview.
Using the SCA Reporter
This chapter describes how to use the Cisco SCA Reporter to produce meaningful reports that highlight network use by services and subscribers.
Service Control Application Reporter
The Cisco SCA Reporter enables you to produce reports based on the traffic analysis performed by the Cisco SCE platform. The information is sent from the Cisco SCE platform and is stored in a database. The Cisco SCA Reporter can query and retrieve information from the database, and present the results in a comprehensive range of reports; including global monitoring, subscriber monitoring, file sharing and OTT video, and traffic discovery statistics reports.
Prerequisites
Before proceeding, ensure that these prerequisites are met:
- Cisco SCE platform, Cisco SCA BB Console, Cisco SCA Reporter, and Cisco Service Control Collection Manager are installed. For details on installing these components, see the Cisco Service Control Product Installation Guide.
- Cisco SCE is processing traffic.
- Collection Manager is set up and collecting RDRs.
- Cisco SCA Reporter is connected to the Cisco Service Control Collection Manager database.
Initial Reports
Several categories of reports are available. However, this chapter focuses on the following reports which provide a comprehensive view of the entire bandwidth used by applications, subscribers, and services:
–![]() Global Bandwidth per Service provides information about how much bandwidth is consumed by applications and can be used to view bandwidth use by particular groups of applications.
Global Bandwidth per Service provides information about how much bandwidth is consumed by applications and can be used to view bandwidth use by particular groups of applications.
–![]() Global Active Subscriber per Service shows the distribution of subscribers among the different services defined in the system for all traffic, regardless of subscriber or package.
Global Active Subscriber per Service shows the distribution of subscribers among the different services defined in the system for all traffic, regardless of subscriber or package.
–![]() Relative Consumption of Top Subscribers shows the relative consumption of a specific number of subscribers compared to other subscribers.
Relative Consumption of Top Subscribers shows the relative consumption of a specific number of subscribers compared to other subscribers.
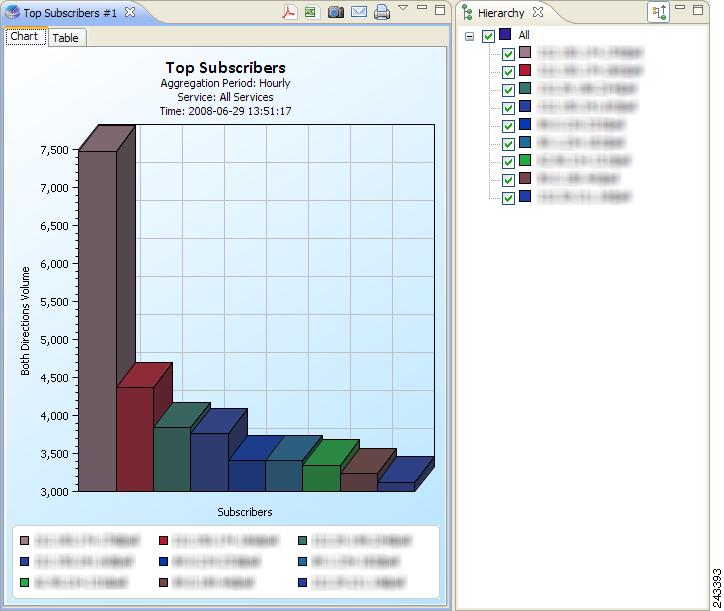
–![]() Top Subscriber shows a list of the top subscriber volume consumption in a specific hour or day.
Top Subscriber shows a list of the top subscriber volume consumption in a specific hour or day.
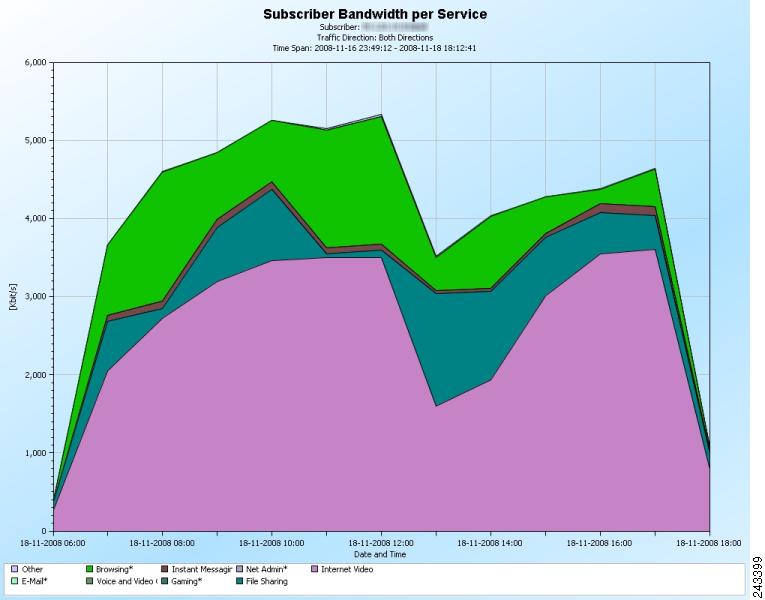
–![]() Subscriber Bandwidth per Service shows the relative consumption of services by a specific subscriber.
Subscriber Bandwidth per Service shows the relative consumption of services by a specific subscriber.
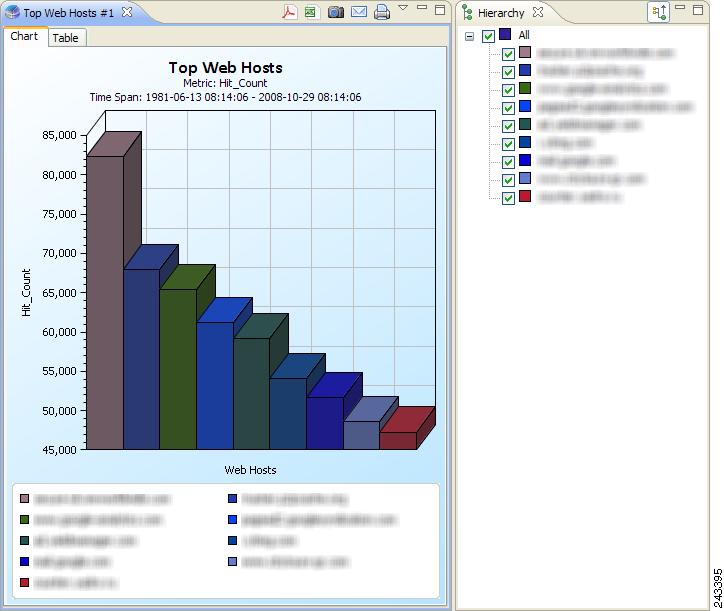
–![]() Top Web Hosts provides information about sites that are most popular among the subscribers.
Top Web Hosts provides information about sites that are most popular among the subscribers.
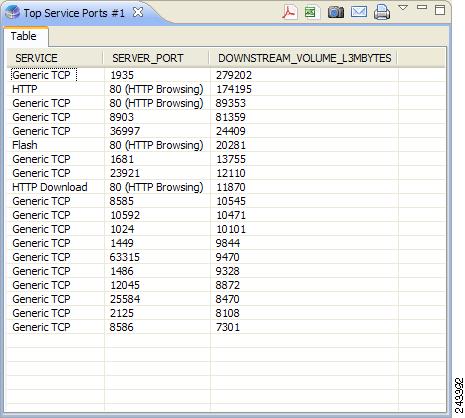
–![]() Top Service Ports shows the most popular server ports of a certain service or services.
Top Service Ports shows the most popular server ports of a certain service or services.
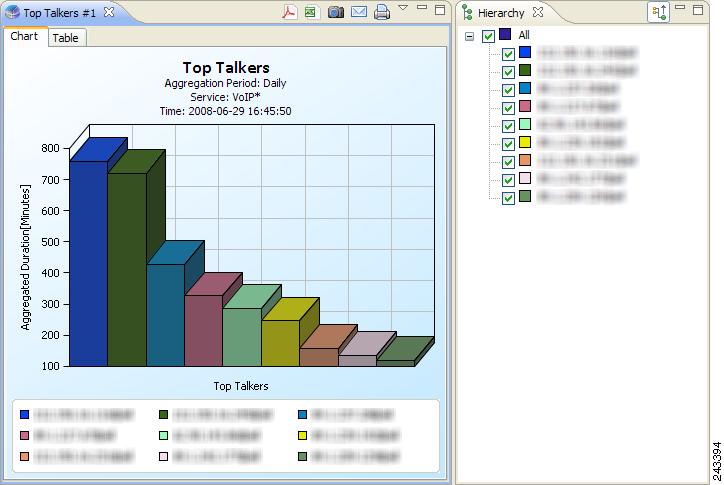
–![]() Top Talkers shows the consumption of volume, sessions, or minutes by the top talkers in a specific hour or day for a specific VoIP service.
Top Talkers shows the consumption of volume, sessions, or minutes by the top talkers in a specific hour or day for a specific VoIP service.
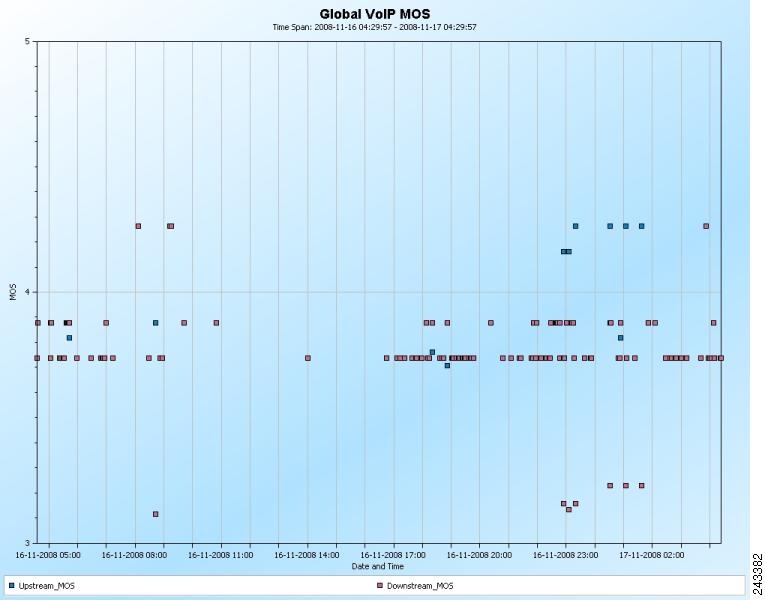
–![]() Global VoIP MOS shows the global VoIP quality estimation, that is, the mean opinion score (MOS).
Global VoIP MOS shows the global VoIP quality estimation, that is, the mean opinion score (MOS).
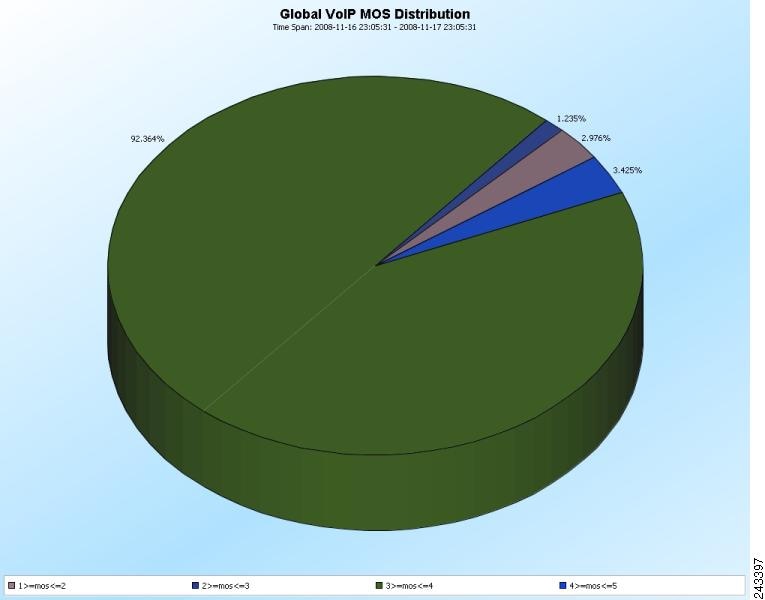
–![]() Global VoIP MOS Distribution shows the distribution of the global VoIP quality estimation.
Global VoIP MOS Distribution shows the distribution of the global VoIP quality estimation.
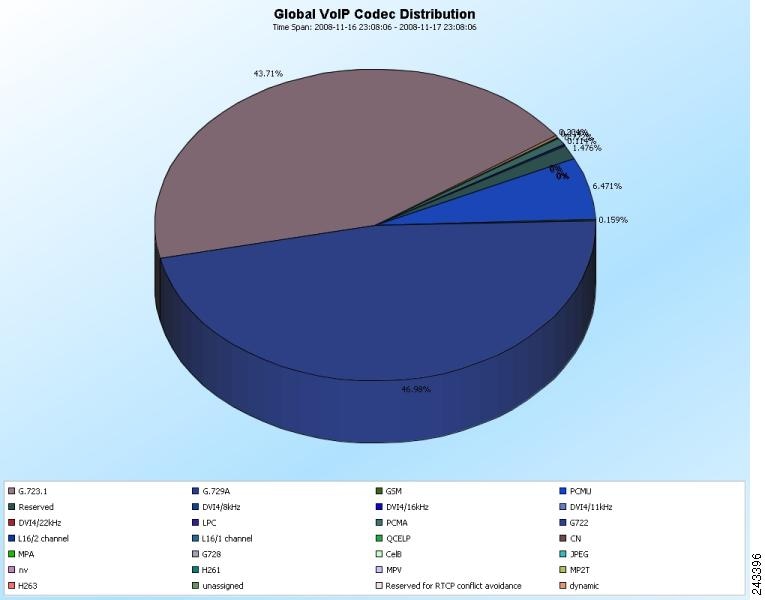
–![]() Global VoIP Codec Distribution shows the distribution of the VoIP codecs in use.
Global VoIP Codec Distribution shows the distribution of the VoIP codecs in use.
–![]() Top Scanned or Attacked Ports shows the top scanned or attacked ports.
Top Scanned or Attacked Ports shows the top scanned or attacked ports.
Starting the Reporter and Generating Reports
Step 1![]() Start the SCA BB Console by choosing Start > All Programs > Cisco SCA > SCA BB Console 5.2.0 > SCA BB Console 5.2.0.
Start the SCA BB Console by choosing Start > All Programs > Cisco SCA > SCA BB Console 5.2.0 > SCA BB Console 5.2.0.
The Cisco SCA BB Console splash screen appears. After the Console has loaded, the main window of the Console appears.
Step 2![]() Choose Tools > Reporter from the main menu.
Choose Tools > Reporter from the main menu.
The Cisco SCA Reporter opens with the Templates tab displayed.
Global Monitoring
The Global Monitoring group of reports are the most commonly used and provide a starting point for monitoring bandwidth use on the network. To monitor bandwidth per service, use the Global Bandwidth per Service report template. A Global Bandwidth per Service report shows the applications that go through the network and the bandwidth they use.
Creating a Global Bandwidth per Service Report
Step 1![]() Open the Cisco SCA Reporter. See the “Starting the Reporter and Generating Reports” section.
Open the Cisco SCA Reporter. See the “Starting the Reporter and Generating Reports” section.
Step 2![]() Expand the Global Monitoring group in the Templates view.
Expand the Global Monitoring group in the Templates view.
Step 3![]() Double-click Global Bandwidth per Service.
Double-click Global Bandwidth per Service.
The New Report Wizard appears (see Figure 1). You can configure the new report using this wizard.
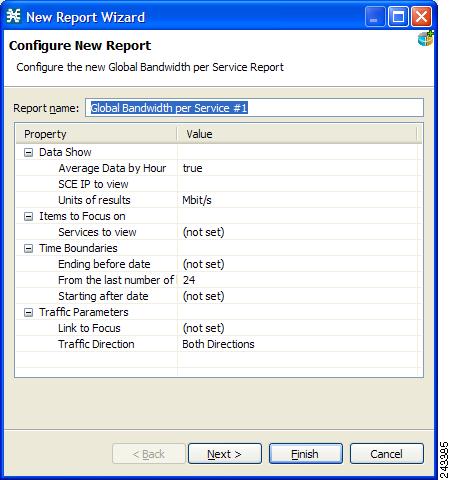
Step 4![]() Click Finish. The report appears with all of the services listed
Click Finish. The report appears with all of the services listed![]() on the Hierarchy tab (see Figure 2).
on the Hierarchy tab (see Figure 2).
Figure 2 Global Bandwidth per Service Report
Viewing Reports by Popularity of Service
By default, reports are generated and displayed based on the configured services tree. However, it is often useful to view the report based on the popularity (that is, the amount of bandwidth consumed) of the services.
Step 1![]() Create a Global Bandwidth per Service report. See the “Creating a Global Bandwidth per Service Report” section.
Create a Global Bandwidth per Service report. See the “Creating a Global Bandwidth per Service Report” section.
Step 2![]() Click the Based on service popularity (
Click the Based on service popularity ( ) icon on the Hierarchy tab.
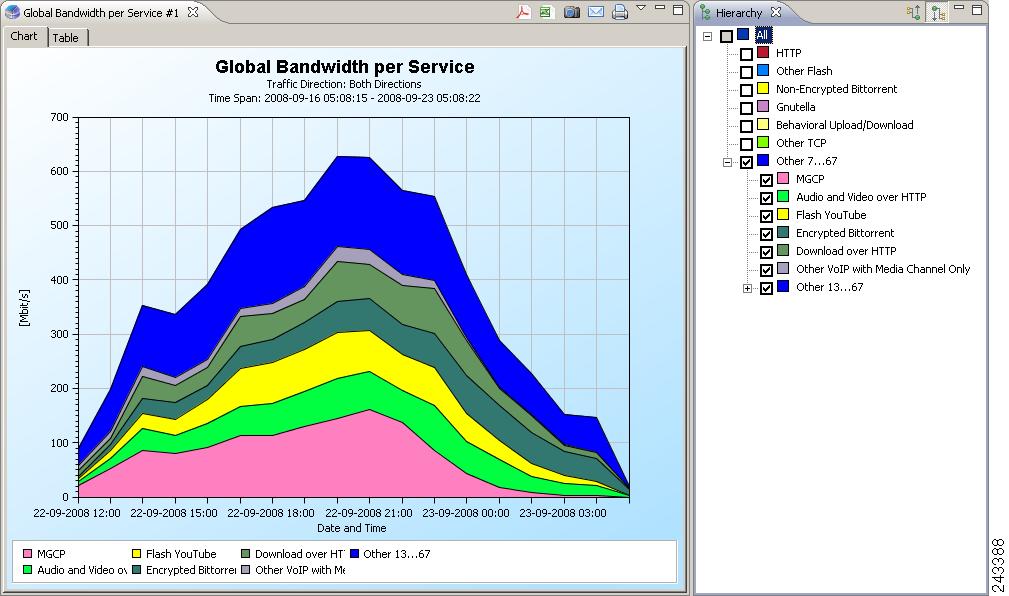
The report is redrawn to show the services based on their popularity (see Figure 3).
Figure 3 Global Bandwidth per Service by Popularity
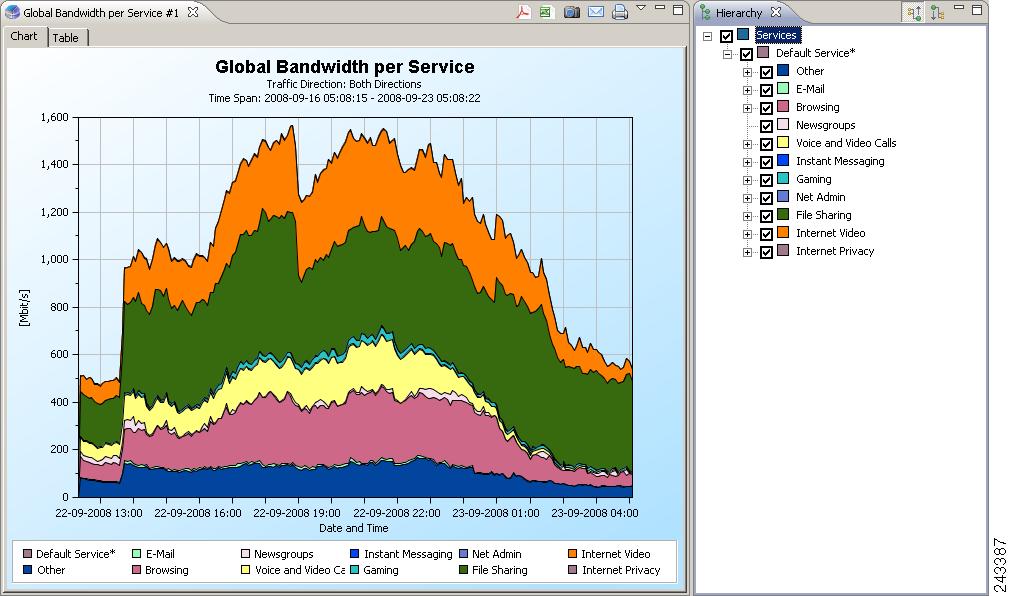
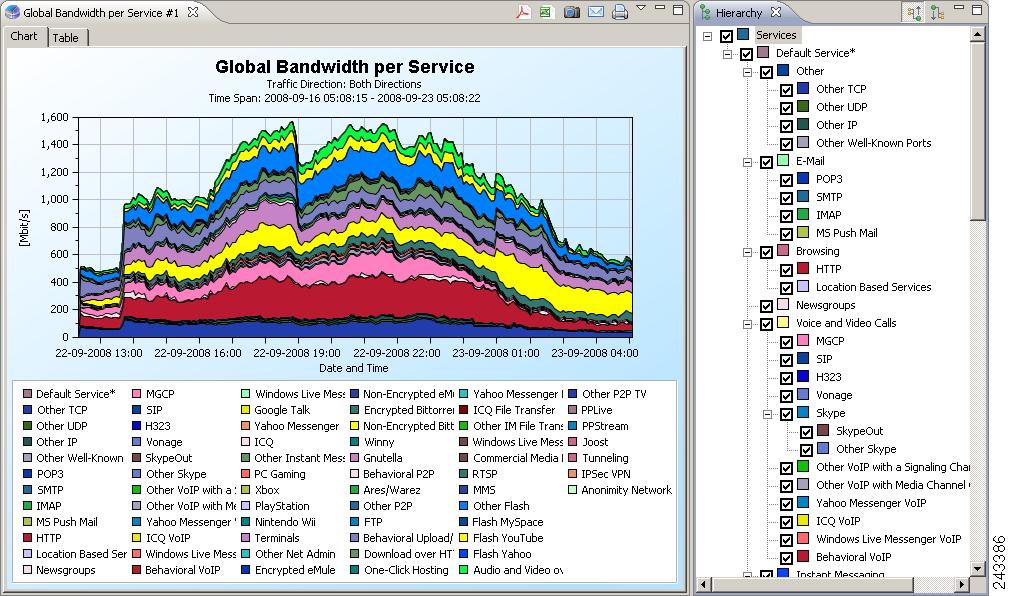
To expand a service, click the expand icon next to the service name on the Hierarchy tab. The report is redrawn to show all the services that were used over the report time period, based on their popularity (see Figure 4).
Figure 4 Global Bandwidth per Service by Popularity Over Time Period
Viewing File Sharing Bandwidth Use
You can use the reporter to drill down and view a particular group of services and see the quantity of bandwidth consumed.
Note![]() You can use the viewing file sharing bandwidth use procedure to view the bandwidth used by any group of service (for example, Internet Video or Gaming).
You can use the viewing file sharing bandwidth use procedure to view the bandwidth used by any group of service (for example, Internet Video or Gaming).
Step 1![]() Create a Global Bandwidth per Service report. See the “Creating a Global Bandwidth per Service Report” section.
Create a Global Bandwidth per Service report. See the “Creating a Global Bandwidth per Service Report” section.
Step 2![]() Click the Based on service popularity () icon on the Hierarchy tab.
Click the Based on service popularity () icon on the Hierarchy tab.
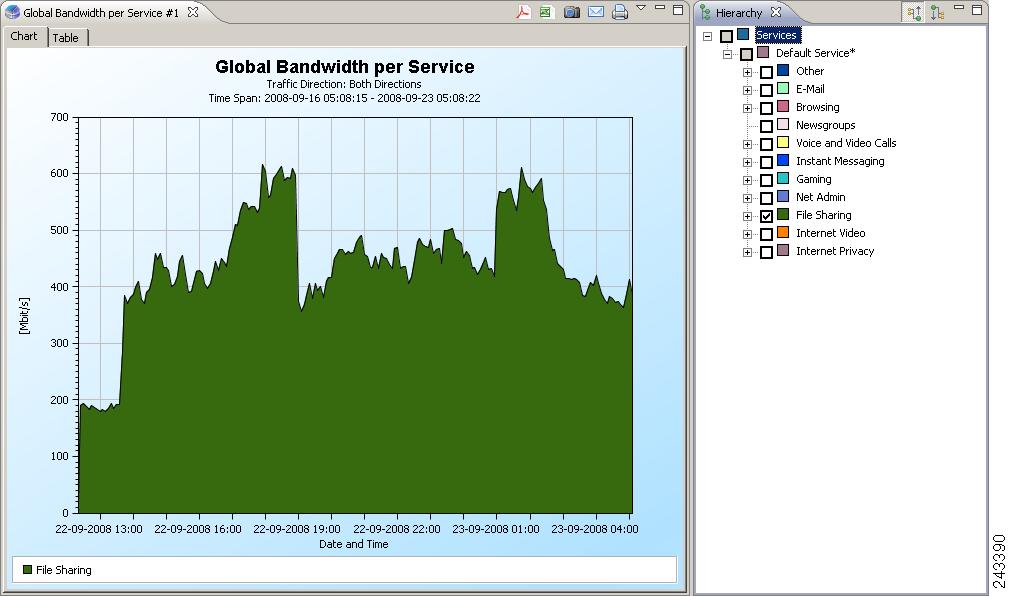
Step 3![]() Uncheck all the group check boxes, but leave the File Sharing check box checked. The report shows only the file sharing bandwidth use (see Figure 5).
Uncheck all the group check boxes, but leave the File Sharing check box checked. The report shows only the file sharing bandwidth use (see Figure 5).
Figure 5 Global Bandwidth per Service—Only File Sharing
Step 4![]() Check the File Sharing checkbox to view the report.
Check the File Sharing checkbox to view the report.
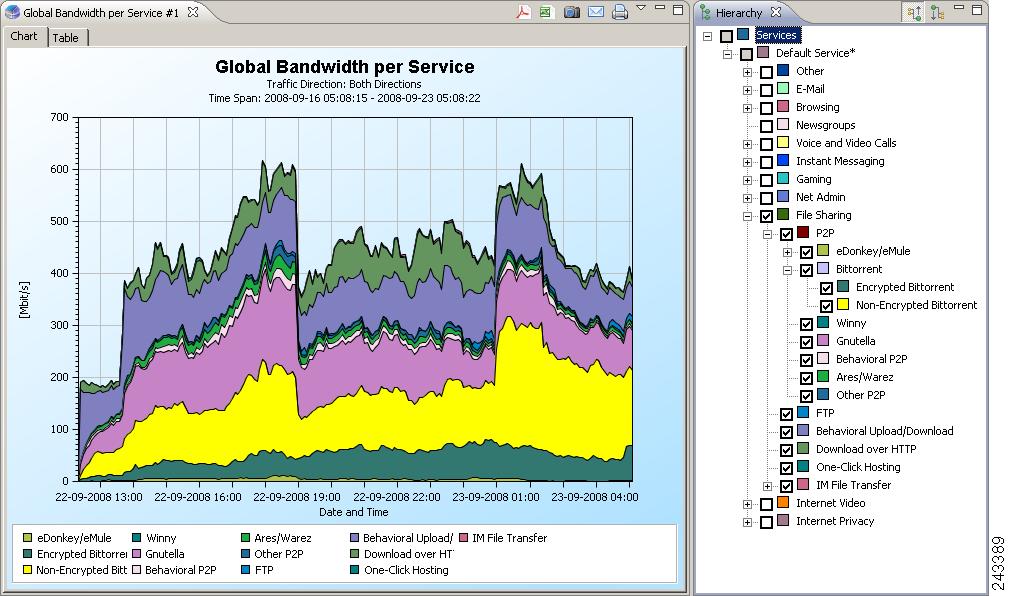
The report shows each of the File Sharing services that consumed bandwidth during the report time period (see Figure 6).
Figure 6 Global Bandwidth per Service—File Sharing Services
Monitoring Demographic Data
Use the Demographic Data and Service Popularity reports to view statistics of the demographic data. The Global Active Subscriber per Service report shows the distribution of subscribers among the different services defined in the system for all traffic, regardless of subscriber or package. The Relative Consumption of Top Subscribers report shows the relative consumption of a specific number of subscribers compared to other subscribers.
Creating a Global Active Subscriber per Service Report
Step 1![]() Open the SCA Reporter. See the “Starting the Reporter and Generating Reports” section.
Open the SCA Reporter. See the “Starting the Reporter and Generating Reports” section.
Step 2![]() Expand the Demographic Data and Service Popularity group in the Templates view.
Expand the Demographic Data and Service Popularity group in the Templates view.
Step 3![]() Double-click Global Active Subscriber per Service. The New Report Wizard appears.
Double-click Global Active Subscriber per Service. The New Report Wizard appears.
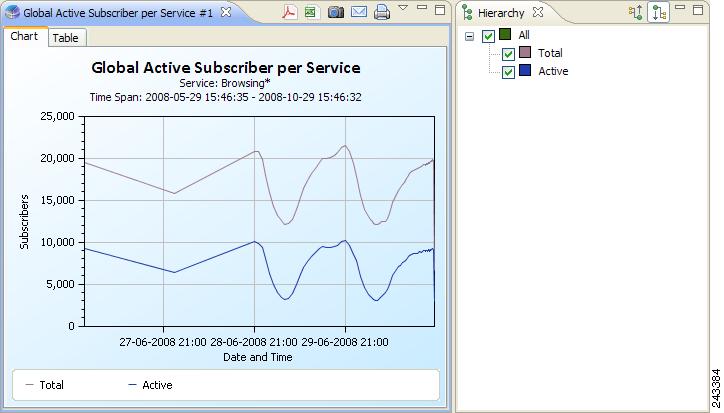
Step 4![]() (Optional) Configure the new report.
(Optional) Configure the new report.
The report shows the number of active subscribers and the number of total subscribers for the time period specified (see Figure 7).
Figure 7 Global Active Subscribers per Service
Creating a Relative Consumption of Top Subscribers Report
Step 1![]() Open the SCA Reporter. See the “Starting the Reporter and Generating Reports” section.
Open the SCA Reporter. See the “Starting the Reporter and Generating Reports” section.
Step 2![]() Expand the Demographic Data and Service Popularity group in the templates view.
Expand the Demographic Data and Service Popularity group in the templates view.
Step 3![]() Double-click Relative Consumption of Top Subscribers. The New Report Wizard appears.
Double-click Relative Consumption of Top Subscribers. The New Report Wizard appears.
Step 4![]() (Optional) Configure the new report.
(Optional) Configure the new report.
Step 5![]() Click the right column in the Specific Time row, and click the Browse button that appears. A calendar appears.
Click the right column in the Specific Time row, and click the Browse button that appears. A calendar appears.
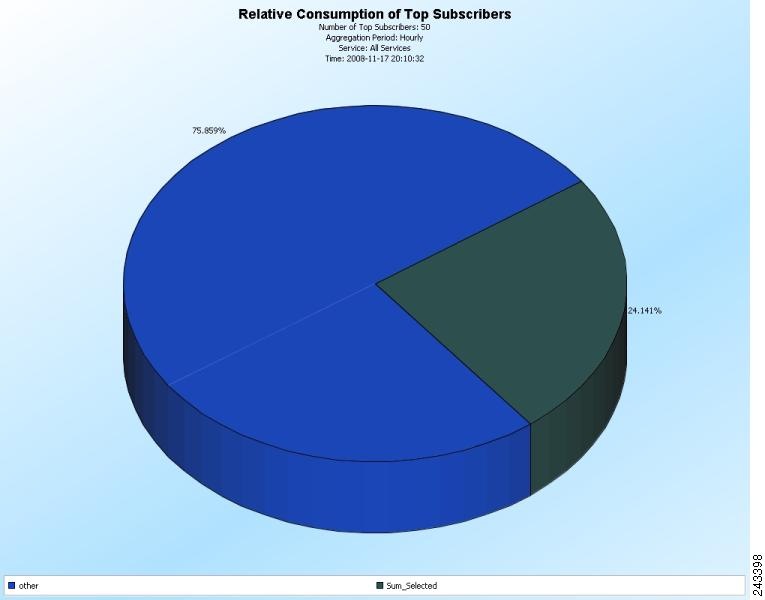
Step 6![]() Choose a date and time that contains the traffic for which you want to produce a report.
Choose a date and time that contains the traffic for which you want to produce a report.
The report shows the consumption of the top subscribers compared to the consumption of the other subscribers (see Figure 8).
Figure 8 Relative Consumption of Top Subscribers
Monitoring Subscribers
Use the Subscriber Monitoring group of reports to view statistics about the bandwidth or volume of traffic used by subscribers. The reports are provided per service usage counter for the total volume consumed by subscribers. The Top Subscribers report identifies the subscribers who consume the largest traffic volume. The Subscriber Bandwidth per Service report shows the bandwidth used for each service by a specific subscriber.
Creating a Top Subscribers Report
Step 1![]() Open the Cisco SCA Reporter. See the “Starting the Reporter and Generating Reports” section.
Open the Cisco SCA Reporter. See the “Starting the Reporter and Generating Reports” section.
Step 2![]() Expand the Subscriber Monitoring group in the Templates view.
Expand the Subscriber Monitoring group in the Templates view.
Step 3![]() Double-click Top Subscribers. The New Report Wizard appears.
Double-click Top Subscribers. The New Report Wizard appears.
Step 4![]() Click the right column in the Specific Time row, and click the Browse button that appears. A calendar appears.
Click the right column in the Specific Time row, and click the Browse button that appears. A calendar appears.
Step 5![]() Choose a date and time that contains the traffic for which you want to produce a report.
Choose a date and time that contains the traffic for which you want to produce a report.
The report shows the top subscribers for the specified time (see Figure 9).
Figure 9 Top Subscribers for a Specified Time Period
Creating a Subscriber Bandwidth per Service Report
After enabling a subscriber for real-time monitoring, you can produce reports specific to that subscriber.
Step 1![]() Open the Cisco SCA Reporter. See the “Starting the Reporter and Generating Reports” section.
Open the Cisco SCA Reporter. See the “Starting the Reporter and Generating Reports” section.
Step 2![]() Expand the Subscriber Monitoring group in the Templates view.
Expand the Subscriber Monitoring group in the Templates view.
Step 3![]() Double-click Subscriber Bandwidth per Service. The New Report Wizard appears.
Double-click Subscriber Bandwidth per Service. The New Report Wizard appears.
Step 4![]() Click the right column in the Name of subscriber to focus on row, and enter the ID of the subscriber you wish to view.
Click the right column in the Name of subscriber to focus on row, and enter the ID of the subscriber you wish to view.
The report shows the bandwidth consumed by the services used by the specified subscriber (see Figure 10).
Figure 10 Subscriber Bandwidth per Service
Monitoring Top Sites and Service Ports
Use the Web and Streaming group of report templates to compile statistics presenting the most popular servers or hosts for the various predefined system services (such as browsing, streaming, and downloading) and for user-defined services. The Top Web Hosts report shows the most popular web hosts among the subscribers.
The Traffic Discovery - Statistics group of report templates allows you to view statistics compiled from the source and destination IP addresses, and ports of the system traffic. The Top Service Ports report shows the most popular server ports of a certain service or services.
Creating a Top Web Hosts Report
Step 1![]() Open the Cisco SCA Reporter. See the “Starting the Reporter and Generating Reports” section.
Open the Cisco SCA Reporter. See the “Starting the Reporter and Generating Reports” section.
Step 2![]() Expand the Web and Streaming group in the Templates view.
Expand the Web and Streaming group in the Templates view.
Step 3![]() Double-click Top Web Hosts. The New Report Wizard appears.
Double-click Top Web Hosts. The New Report Wizard appears.
Step 4![]() (Optional) Configure the new report.
(Optional) Configure the new report.
The report shows all the web hosts listed on the Hierarchy tab (see Figure 11).
Creating a Top Service Ports Report
Step 1![]() Open the Cisco SCA Reporter. See the “Starting the Reporter and Generating Reports” section.
Open the Cisco SCA Reporter. See the “Starting the Reporter and Generating Reports” section.
Step 2![]() Expand the Traffic Discovery - Statistics group in the Templates view.
Expand the Traffic Discovery - Statistics group in the Templates view.
Step 3![]() Double-click Top Service Ports. The New Report Wizard appears.
Double-click Top Service Ports. The New Report Wizard appears.
Step 4![]() (Optional) Configure the new report.
(Optional) Configure the new report.
The report is in table format; listing the top services, the ports used by the top services, and the volume of traffic used by the services (see Figure 12).
Monitoring VoIP Use
The VoIP group of reports allows you to view statistics of the VoIP traffic:
- Top Talkers report—Shows the consumption of volume, sessions, or minutes by the top talkers in a specific hour or day for a specific VoIP service.
- Global VoIP MOS report—Shows the global VoIP quality estimation.
- Global VoIP MOS distribution report—Shows the distribution of the VoIP quality estimation.
- Global VoIP Codec distribution report—Shows the distribution of the VoIP codecs being used.
Creating a Top Talkers Report
Step 1![]() Open the Cisco SCA Reporter. See the “Starting the Reporter and Generating Reports” section.
Open the Cisco SCA Reporter. See the “Starting the Reporter and Generating Reports” section.
Step 2![]() Expand the VoIP group in the Templates view.
Expand the VoIP group in the Templates view.
Step 3![]() Double-click Top Talkers. The New Report Wizard appears.
Double-click Top Talkers. The New Report Wizard appears.
Step 4![]() Choose the service on which the report focuses in the Items to Focus on property group.
Choose the service on which the report focuses in the Items to Focus on property group.
Step 5![]() Click the right column in the Specific Time row, and click the Browse button that appears. A calendar appears.
Click the right column in the Specific Time row, and click the Browse button that appears. A calendar appears.
Step 6![]() Choose a date and time that contains the traffic for which you want to produce a report.
Choose a date and time that contains the traffic for which you want to produce a report.
The report shows the top talkers for the time period and the service chosen (see Figure 13).
Creating Global VoIP MOS Reports
Step 1![]() Open the Cisco SCA Reporter. See the “Starting the Reporter and Generating Reports” section.
Open the Cisco SCA Reporter. See the “Starting the Reporter and Generating Reports” section.
Step 2![]() Expand the VoIP group in the Templates view.
Expand the VoIP group in the Templates view.
Step 3![]() Double-click Global VoIP MOS. The New Report Wizard appears.
Double-click Global VoIP MOS. The New Report Wizard appears.
Step 4![]() (Optional) Configure the new report.
(Optional) Configure the new report.
The report shows the global VoIP quality estimation (see Figure 14).
Step 6![]() Double-click Global VoIP MOS Distribution to create a Global VoIP MOS distribution report. The New Report Wizard appears.
Double-click Global VoIP MOS Distribution to create a Global VoIP MOS distribution report. The New Report Wizard appears.
Step 7![]() (Optional) Configure the new report.
(Optional) Configure the new report.
The report shows the global VoIP quality estimation distribution (see Figure 15).
Figure 15 Global VoIP MOS Distribution
Creating a Global VoIP Codec Distribution Report
Step 1![]() Open the Cisco SCA Reporter. See the “Starting the Reporter and Generating Reports” section.
Open the Cisco SCA Reporter. See the “Starting the Reporter and Generating Reports” section.
Step 2![]() Expand the VoIP group in the Templates view.
Expand the VoIP group in the Templates view.
Step 3![]() Double-click Global VoIP Codec Distribution. The New Report Wizard appears.
Double-click Global VoIP Codec Distribution. The New Report Wizard appears.
Step 4![]() (Optional) Configure the new report.
(Optional) Configure the new report.
The report shows the distribution of VoIP codecs that are used (see Figure 16).
Figure 16 Global VoIP Codec Distribution
Monitoring Malicious Traffic
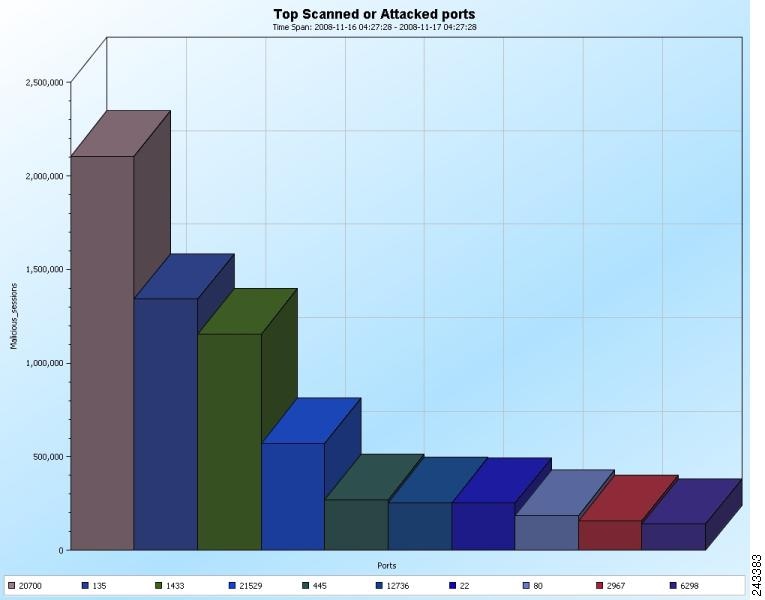
The Malicious Traffic group of report templates allows you to view statistics of the malicious events accrued in the system. The Top Scanned or Attacked Ports report shows the top scanned or attacked ports.
Creating a Top Scanned or Attacked Ports Report
Step 1![]() Open the Cisco SCA Reporter. See the “Starting the Reporter and Generating Reports” section.
Open the Cisco SCA Reporter. See the “Starting the Reporter and Generating Reports” section.
Step 2![]() Expand the Malicious Traffic group in the Templates view.
Expand the Malicious Traffic group in the Templates view.
Step 3![]() Double-click Top Scanned or Attacked Ports. The New Report Wizard appears.
Double-click Top Scanned or Attacked Ports. The New Report Wizard appears.
Step 4![]() (Optional) Configure the new report.
(Optional) Configure the new report.
The report shows the top scanned or attacked ports (see Figure 17).
Figure 17 Top Scanned or Attacked Ports
Useful Cisco SCA Reporter Tools
The Cisco SCA Reporter contains features that enables you to:
- Zoom in and zoom out of the report
- View chart tool tips
- Edit chart colors
- Export the reports to various formats
Zooming in on a 2-Dimensional Chart
Step 1![]() Generate a report. A report view opens displaying the report, and the Properties view displays the chart display properties.
Generate a report. A report view opens displaying the report, and the Properties view displays the chart display properties.
Step 2![]() Click the 3D property to display the chart in two dimensions. The value of the 3D property toggles from True to False and the Look/3D category is removed from the Properties view.
Click the 3D property to display the chart in two dimensions. The value of the 3D property toggles from True to False and the Look/3D category is removed from the Properties view.
Step 3![]() Demarcate a rectangle by dragging the mouse over the chart. The cursor changes to a plus icon.
Demarcate a rectangle by dragging the mouse over the chart. The cursor changes to a plus icon.
Step 4![]() Release the mouse button. The view zooms in.
Release the mouse button. The view zooms in.
Zooming Out of a Zoomed-In Chart
Step 1![]() Demarcate a rectangle by dragging the mouse over the chart while pressing the Shift key. The cursor changes to a minus icon.
Demarcate a rectangle by dragging the mouse over the chart while pressing the Shift key. The cursor changes to a minus icon.
Step 2![]() Release the mouse button. The view zooms out.
Release the mouse button. The view zooms out.
Printing Reports
Step 1![]() Execute one or more report instances.
Execute one or more report instances.
Step 2![]() Choose File > Print Reports. The Print Reports wizard opens (see Figure 18).
Choose File > Print Reports. The Print Reports wizard opens (see Figure 18).
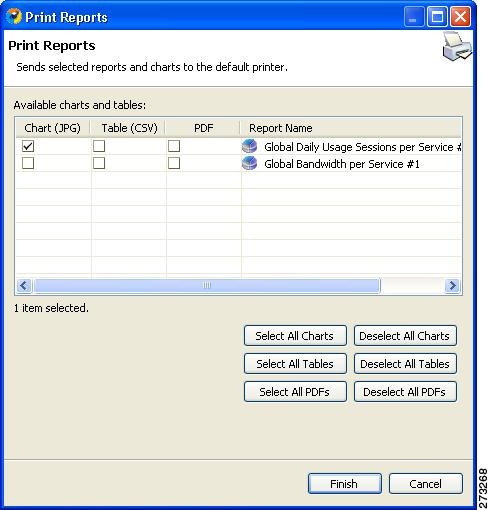
Step 3![]() Select one or more format for each report you are printing.
Select one or more format for each report you are printing.
Step 4![]() Click Finish. The selected reports print in the format or formats you chose in Step 3
Click Finish. The selected reports print in the format or formats you chose in Step 3![]() .
.
Note![]() For PDF and CSV formats, the print feature uses the desktop interface and prints only if the associated application can print from the desktop. If you can print from the desktop without opening the application, the print feature works.
For PDF and CSV formats, the print feature uses the desktop interface and prints only if the associated application can print from the desktop. If you can print from the desktop without opening the application, the print feature works.
Note![]() If you selected several reports to print, the application may freeze for several moments while sending the reports to the printer.
If you selected several reports to print, the application may freeze for several moments while sending the reports to the printer.
Sending Reports by E- mail
Step 1![]() Execute one or more report instances.
Execute one or more report instances.
Step 2![]() Choose File > Send Reports. The Send Reports wizard appears (see Figure 19).
Choose File > Send Reports. The Send Reports wizard appears (see Figure 19).
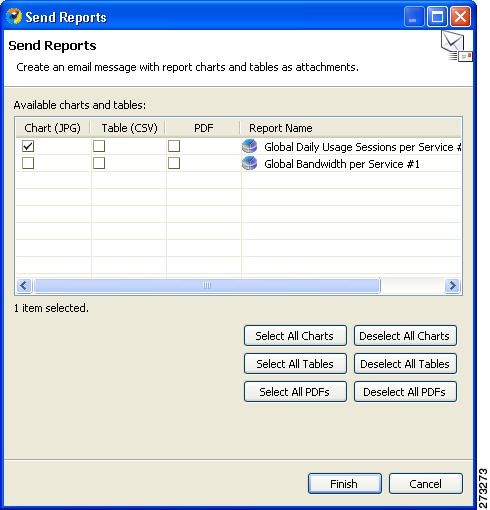
Step 3![]() Select one or more formats for each report you want to send.
Select one or more formats for each report you want to send.
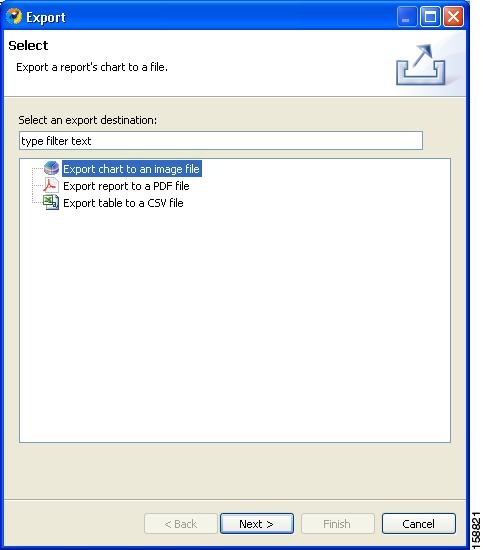
Exporting Reports
Step 1![]() Execute one or more report instances.
Execute one or more report instances.
The Export wizard appears (see Figure 20).
The Tables and Destination page of the Export wizard appears (see Figure 21).
Figure 21 Charts and Destination
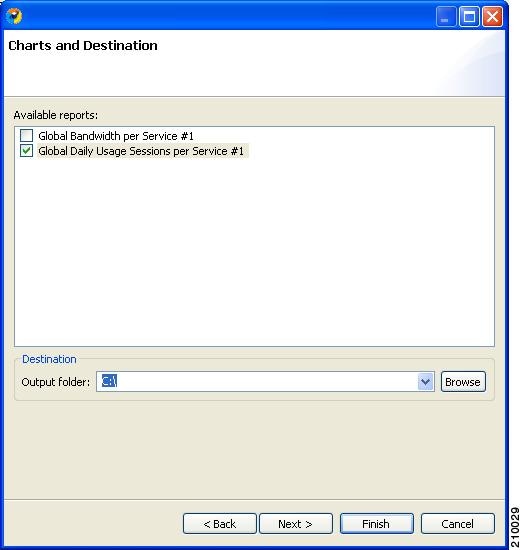
Step 5![]() Check the check box for one or more of the Available reports.
Check the check box for one or more of the Available reports.
Step 6![]() (Optional) Click Browse to change the Output folder.
(Optional) Click Browse to change the Output folder.
The Format page of the Export wizard opens. (The display depends on whether you chose Chart or Table in Step 3.)
Step 8![]() Enter the required information. Do one of these:
Enter the required information. Do one of these:
–![]() From the File type drop-down list, choose a file type.
From the File type drop-down list, choose a file type.
–![]() In the Image width and Image height fields, enter values in pixels.
In the Image width and Image height fields, enter values in pixels.
–![]() From the File type drop-down list, choose a file type.
From the File type drop-down list, choose a file type.
–![]() (Optional) Uncheck Open the exported CSV file in the system's default CSV editor.
(Optional) Uncheck Open the exported CSV file in the system's default CSV editor.
Step 9![]() Click Finish. Each report selected is saved in a separate file.
Click Finish. Each report selected is saved in a separate file.
Setting the Colors Used in Charts
Predefined colors are packaged within the Cisco SCA BB Templates package. Instead of using the default color set for charts that is installed as part of the Reporter installation, you can define your own color sets.
This allows you to ensure color persistence between different sessions of the Reporter, including:
Changing the Color of Legend Items
Step 1![]() From the Cisco SCA BB Console main menu, choose Preferences > Reporter. The Preferences dialog box appears.
From the Cisco SCA BB Console main menu, choose Preferences > Reporter. The Preferences dialog box appears.
Step 2![]() In the Preferences tree, choose Reporter > Charts Colors. The Charts Colors preference page opens.
In the Preferences tree, choose Reporter > Charts Colors. The Charts Colors preference page opens.
Step 3![]() Select a legend item from the color tree.
Select a legend item from the color tree.
Note![]() Possible categories of legend items are Direction, Hostname, Host IP, Protocol, MOS, Range, Codec, Port Number, Newsgroup, Protocol, Service, Measure, and Subscriber.
Possible categories of legend items are Direction, Hostname, Host IP, Protocol, MOS, Range, Codec, Port Number, Newsgroup, Protocol, Service, Measure, and Subscriber.
Categories and legend items are displayed in the Charts Colors pane only after the colors are allocated to legend items. Colors are allocated to any legend items in the chart the first time a report instance is executed.
The current color of the legend item appears in the upper right of the Charts Colors pane.
Step 4![]() Click the displayed color. A color palette dialog box appears.
Click the displayed color. A color palette dialog box appears.
Step 5![]() Select a new color for the legend item and click OK. The Color dialog box closes.
Select a new color for the legend item and click OK. The Color dialog box closes.
The selected color is applied to the legend item.
Viewing Chart Tooltips
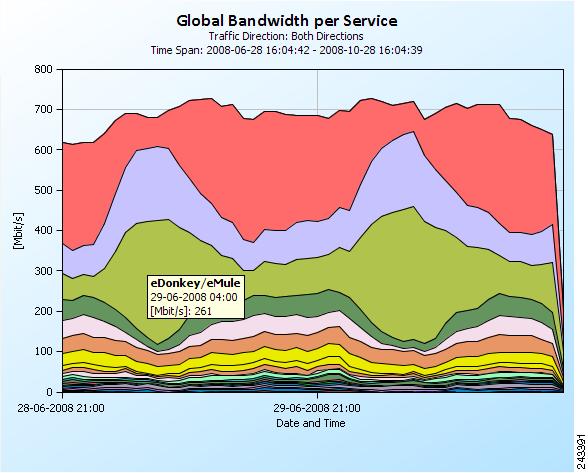
To view the chart tooltips, hover your mouse over the chart from an open chart. A tooltip appears with information about the chart; specifically, information about the location over which the mouse is placed (see Figure 22).
Figure 22 Global Bandwidth per Service—Tooltip
Obtaining Documentation and Submitting a Service Request
For information on obtaining documentation, using the Cisco Bug Search Tool (BST), submitting a service request, and gathering additional information, see What’s New in Cisco Product Documentation at: http://www.cisco.com/c/en/us/td/docs/general/whatsnew/whatsnew.html.
Subscribe to What’s New in Cisco Product Documentation, which lists all new and revised Cisco technical documentation as an RSS feed and delivers content directly to your desktop using a reader application. The RSS feeds are a free service.
 Feedback